Sikbh
@t_Sikbh
What symbols does the trader recommend buying?
Purchase History
پیام های تریدر
Filter
Signal Type
Sikbh
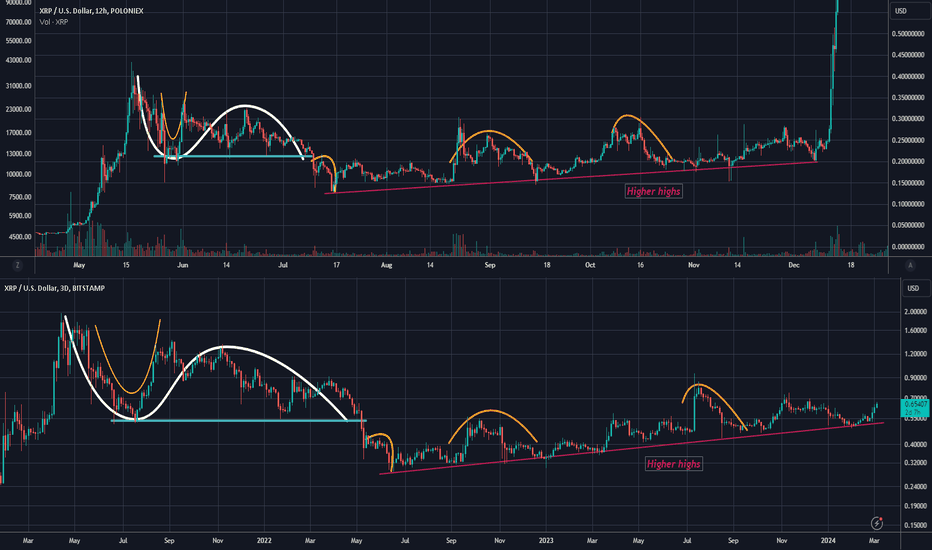
The first chart shows XRPUSD from May 2017 to Dec 2017. The second chart shows XRPUSD from early 2021 to current. Both charts start off with a "U" shaped dip and rise, followed by a slow decline to the support level of the "U" (shown by a white sine wave). The yellow curve on both charts shows price dropping below this bottom to a new low. Purple line marks higher highs with 2 notable jumps, shown in orange. At the end of the first chart, XRPUSD breaks out and goes from about $0.20 to $3.30, an increase of 1500%. If the second chart also follows the same break out from current bottom of higher high trend line, which is $0.50, a 1500% increase puts the target price at $7.70. Disclaimer: Keep in mind that market predictions are about as reliable as a weather forecast in outer space. Use this analysis as a conversation starter, not as financial advice. Investing in cryptocurrencies carries risks, so do your homework and make informed decisions. Remember, no crystal balls here—just a pinch of insight and a dash of caution
Sikbh
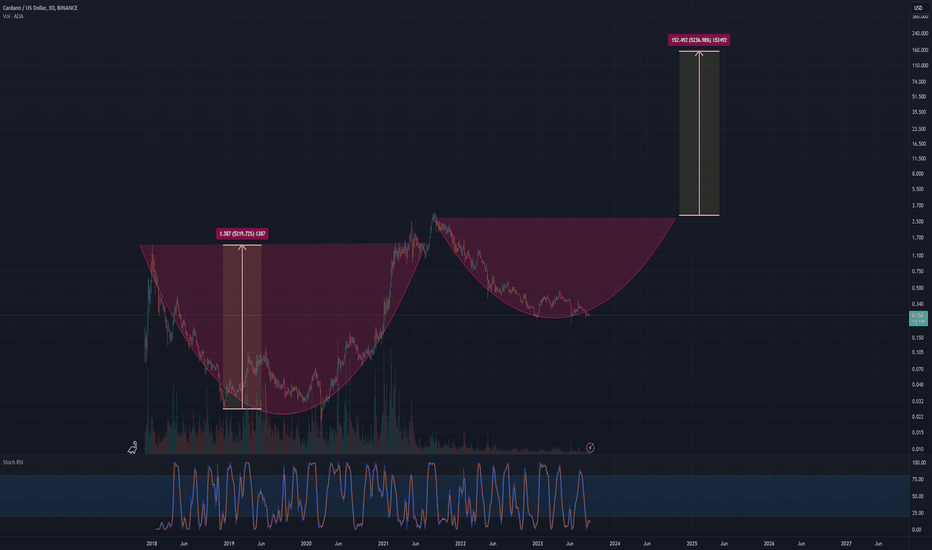
Long term cup and handle formation in play, targeting $150 in next bull run. Disclaimer: Keep in mind that market predictions are about as reliable as a weather forecast in outer space. Use this analysis as a conversation starter, not as financial advice. Investing in cryptocurrencies carries risks, so do your homework and make informed decisions. Remember, no crystal balls here—just a pinch of insight and a dash of caution
Sikbh
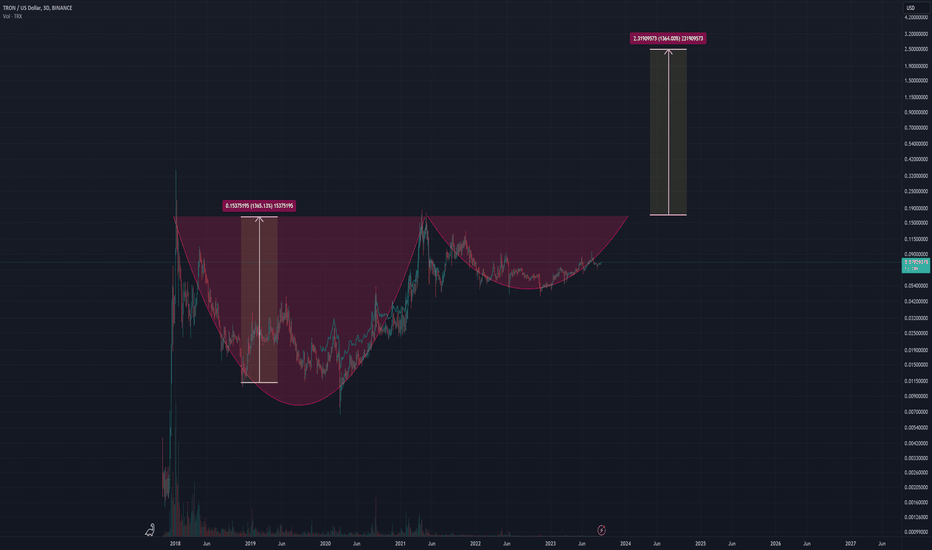
Long term cup and handle in play, with potential target above $2. Disclaimer: Keep in mind that market predictions are about as reliable as a weather forecast in outer space. Use this analysis as a conversation starter, not as financial advice. Investing in cryptocurrencies carries risks, so do your homework and make informed decisions. Remember, no crystal balls here—just a pinch of insight and a dash of caution
Sikbh
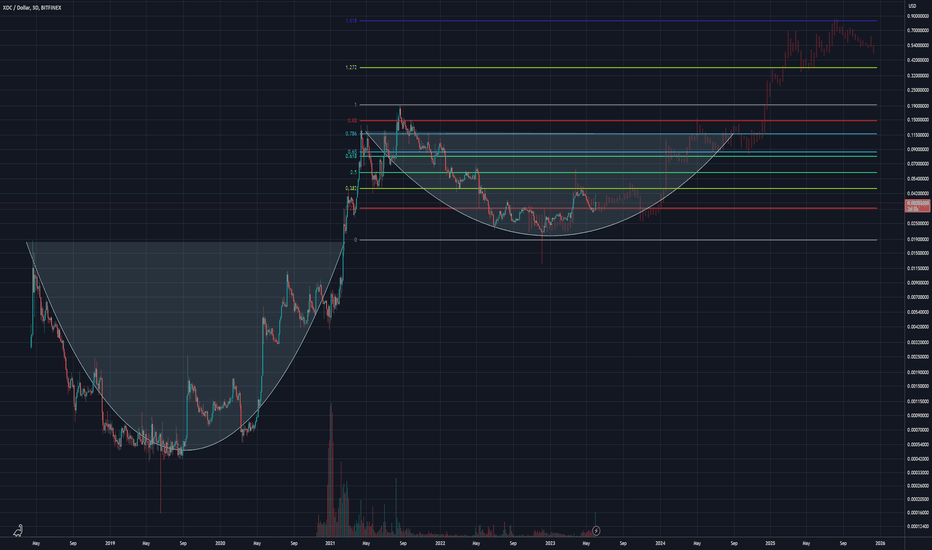
Cup and handle pattern on the long term chart of XDCUSDT XDCUSD. Fib levels show a 2025 cycle top price target of at least $0.75 (25x from today's price of $0.035). If fib level 2.272 is hit, that would put the price of XDCUSD by the end of 2025 at around $3 to $4 (100x from today's price). Disclaimer: Keep in mind that market predictions are about as reliable as a weather forecast in outer space. Use this analysis as a conversation starter, not as financial advice. Investing in cryptocurrencies carries risks, so do your homework and make informed decisions. Remember, no crystal balls here—just a pinch of insight and a dash of caution
Sikbh
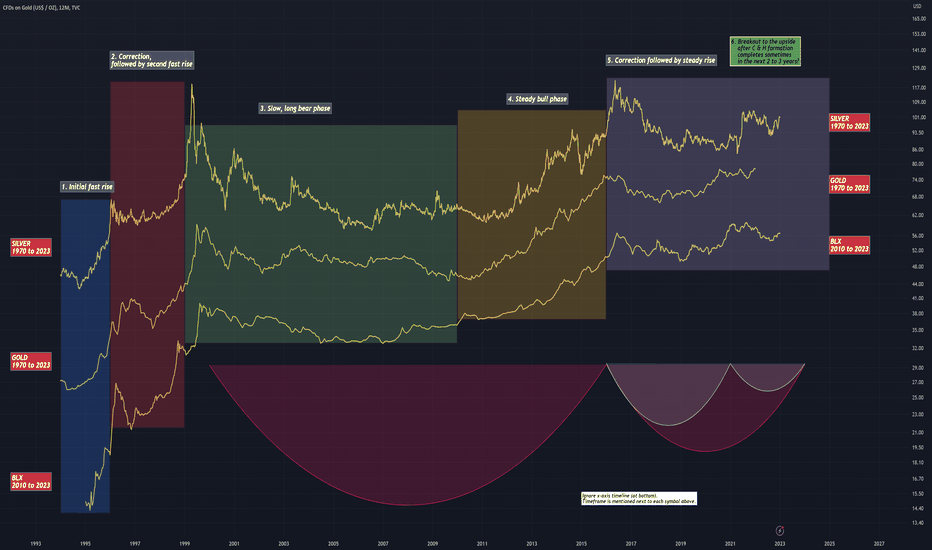
Through meticulous analysis, the three charts displayed side by side present a captivating comparison between silver ( SILVER XAGUSD), gold ( GOLD XAUUSD), and Bitcoin ( BLX BTCUSD). Spanning from the 1970s to the present day, these charts provide a comprehensive view of the remarkable journeys undertaken by these assets. The first two charts depict the price movements of silver and gold over the course of five decades, while the third chart illustrates the relatively short but remarkable trajectory of Bitcoin since its inception in 2010. What immediately catches the eye is the astonishing pace at which Bitcoin has achieved in just 13 years, what took silver and gold a staggering 53 years to accomplish. However, the most striking aspect that commands attention is the unmistakable presence of a colossal "cup and handle" pattern, poised to complete its formation within the next two to four years. This pattern has been dissected into five distinct phases, revealing intriguing similarities across all three commodities. 1/ The initial phase witnessed a rapid surge in prices for all three assets, setting the stage for what was to come. 2/This was followed by a minor correction before another sharp increase in price. 3/ Subsequently, a prolonged period of slow and gradual correction ensued, testing the patience of investors. 4/ However, this was eventually followed by a steady bull phase, characterized by sustained upward momentum. 5/ As the cycle neared completion, another corrective phase emerged, followed by a steady rise once again. (Note: This phase is marked by a smaller cup and handle forming within the larger cup and handle, with completion at around the same time). The question that naturally arises is: what lies ahead? Will there be a breakout to the upside after the completion of the cup and handle formation, expected to materialize within the next two to three years? The simultaneous indication of such a breakout across all three commodities is undeniably intriguing and warrants further exploration. Furthermore, as we examine the intriguing cup and handle formations across silver, gold, and Bitcoin, it is crucial to take into account the profound shifts occurring in the global economic landscape. The traditional dominance of the petrodollar is facing significant challenges, with emerging trends indicating a potential end to its reign. BRICS nations, for instance, are increasingly engaging in domestic currency transactions, bypassing the need for the U.S. dollar as a medium of exchange. The advent of Central Bank Digital Currencies (CBDCs) across numerous nations have introduced a new dimension to the evolving financial ecosystem. As these digital currencies gain traction, they have the potential to reshape the dynamics of international trade and cross-border transactions. This transition towards CBDCs further underscores the changing paradigm of global finance. However, it is important to acknowledge the mounting tensions and conflicts that permeate the geopolitical arena. Wars, both physical and cyber, as well as potential hacking scandals between nations, have the capacity to disrupt and fracture the fabric of the current economic climate. These events have the potential to cause significant fluctuations in financial markets, including the prices of silver, gold, and Bitcoin. When analyzing the broader financial and economic landscape, it is essential to consider the interplay between political developments, economic policies, technological advancements, and market dynamics. Geopolitical shifts and power realignments among nations can have far-reaching implications for asset valuations and investor sentiment. In conclusion, as we explore the cup and handle formations in silver, gold, and Bitcoin, we must recognize the wider context of global transformations. The potential demise of the petrodollar, the growing influence of domestic currency transactions among BRICS nations, the rise of CBDCs, and the geopolitical tensions reshaping the world order are all factors that can significantly impact the future trajectory of these commodities. It is within this intricate interplay of forces that we seek to discern the catalysts that will drive potential breakouts and subsequent price movements. As the global economic landscape continues to evolve, adaptability and astute analysis remain essential for navigating the uncertainties and seizing opportunities in the ever-changing financial markets. Disclaimer: Keep in mind that market predictions are about as reliable as a weather forecast in outer space. Use this analysis as a conversation starter, not as financial advice. Investing in cryptocurrencies carries risks, so do your homework and make informed decisions. Remember, no crystal balls here—just a pinch of insight and a dash of caution
Sikbh
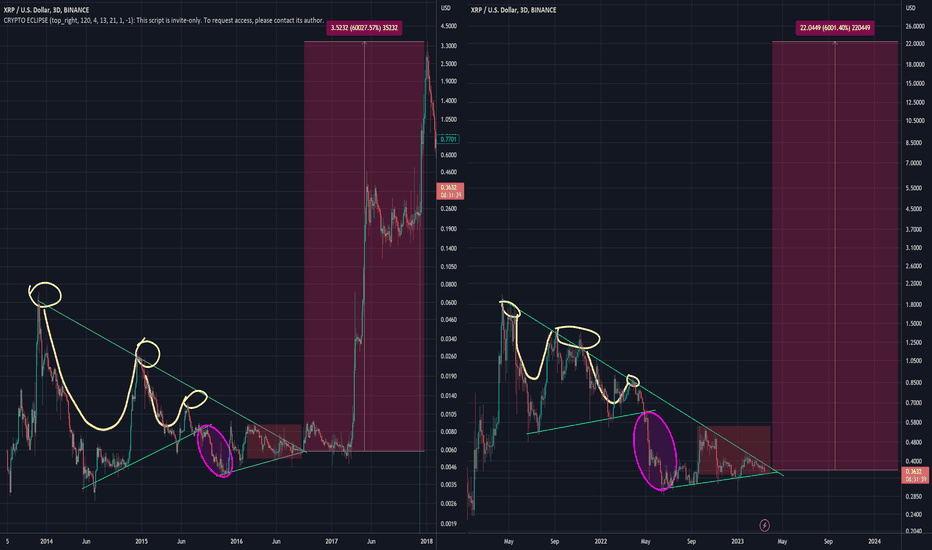
Greetings fellow traders and enthusiasts, Today, we bring you an interesting analysis of the XRPUSD charts on Tradingview. As you may know, XRPUSD is a popular cryptocurrency that has been in the market for some time now. Our team of financial experts has analyzed the charts and we have identified a fractal that we believe is worth exploring. Chart 1 shows the XRPUSDT performance from 2014 to 2017. In this chart, we can observe two large pennants, the first pennant displaying 3 touches on the resistance with 2 touches on support. However, the price drops below support, leading to another pennant with the same resistance trend line. We can see two major touches on resistance, with multiple touches on support, then price squeezes to the tip of the pennant. Finally, it breaks out slightly, corrects for a while, then breaks up in a bull rally with a whopping 60,000% gain in less than 12 months. Moving on to Chart 2, which covers the XRPUSD performance from 2021 to 2023, we observe a similar fractal to Chart 1. In this chart, we can identify two large pennants with the first pennant showing 3 touches on the resistance and 2 touches on support. The price drops below support, leading to another pennant with the same resistance trend line. We can see two major touches on resistance, with multiple touches on support, then price squeezes to the tip of the pennant. Based on this exact fractal, if XRPUSD does the same gains in the same time frame as Chart 1, it could go to $222 by mid-2024. However, we believe it is more realistic to expect gains of 6000% in about 2 years, given the concept of lengthening cycles with diminishing returns as the crypto market matures. This sets the price of XRPUSD around $22 by mid-2025. The concept of lengthening cycles with diminishing returns refers to the idea that as a market matures, its growth rate slows down, and the returns on investment decrease. This is because, in the early stages of a market, there is a lot of potential for growth, and investors rush in to capitalize on this growth, driving up the prices of assets in that market. However, as time passes, the market becomes more saturated, and the potential for growth decreases. This means that the returns on investment become smaller, and the market experiences a lengthening of its cycles. This means that it takes longer for the market to experience the same level of growth as it did in the past, and the returns on investment become more spread out over time. In the case of XRPUSD, we believe that the crypto market has already gone through a significant period of growth and development, and as such, the potential for massive gains in a short period of time is much lower than it was in the past. While we acknowledge that it is possible for XRPUSD to experience gains similar to those seen in Chart 1, we believe it is more realistic to expect gains of 6000% over a 2-year period. This means that investors should not expect to see the same level of explosive growth as in the past, and should instead focus on a more long-term investment strategy that takes into account the concept of lengthening cycles with diminishing returns. By doing so, investors can position themselves to capitalize on the potential for steady, sustainable growth over a longer period of time, rather than relying on short-term gains that may not be sustainable in the long run. It's worth noting that XRP's value is not solely determined by its USD price, but also by its value against Bitcoin (XRPBTC). If XRPBTC were to reach its previous all-time high of approximately 0.00022000 with Bitcoin (BTCUSDT) at about $100,000, that would set the price of XRPUSD at around $22. Therefore, it's important to keep an eye on both XRPUSD and XRPBTC when evaluating the potential for XRP's future growth. DISCLAIMER: It is important to note that the potential gains for XRPUSD outlined in this analysis are based on historical data and trends, and should be treated as hypothetical scenarios for educational purposes only. While the fractal analysis indicates a potential price target of $222 by mid-2024, there are many variables that could impact the price of XRPUSD in the future, including changes in market conditions, regulations, and investor sentiment. Furthermore, the concept of lengthening cycles with diminishing returns suggests that the crypto market may not experience the same level of explosive growth as seen in the past, and that more realistic gains of 6000% over a 2-year period should be expected. However, it is important to remember that past performance is not indicative of future results, and that investors should always conduct their own research and consult with a qualified financial advisor before making any investment decisions. Therefore, this analysis should not be considered as investment advice or a recommendation to buy or sell XRPUSD, and any decisions made based on this information are made at the sole discretion of the individual investor. The author and publisher of this analysis assume no responsibility for any financial losses or gains that may result from the use of this information. Thank you for reading, and happy trading!
Disclaimer
Any content and materials included in Sahmeto's website and official communication channels are a compilation of personal opinions and analyses and are not binding. They do not constitute any recommendation for buying, selling, entering or exiting the stock market and cryptocurrency market. Also, all news and analyses included in the website and channels are merely republished information from official and unofficial domestic and foreign sources, and it is obvious that users of the said content are responsible for following up and ensuring the authenticity and accuracy of the materials. Therefore, while disclaiming responsibility, it is declared that the responsibility for any decision-making, action, and potential profit and loss in the capital market and cryptocurrency market lies with the trader.