
SheikhNaveed
@t_SheikhNaveed
What symbols does the trader recommend buying?
Purchase History
پیام های تریدر
Filter

SheikhNaveed
ONT/USDT 4H Technical Outlook
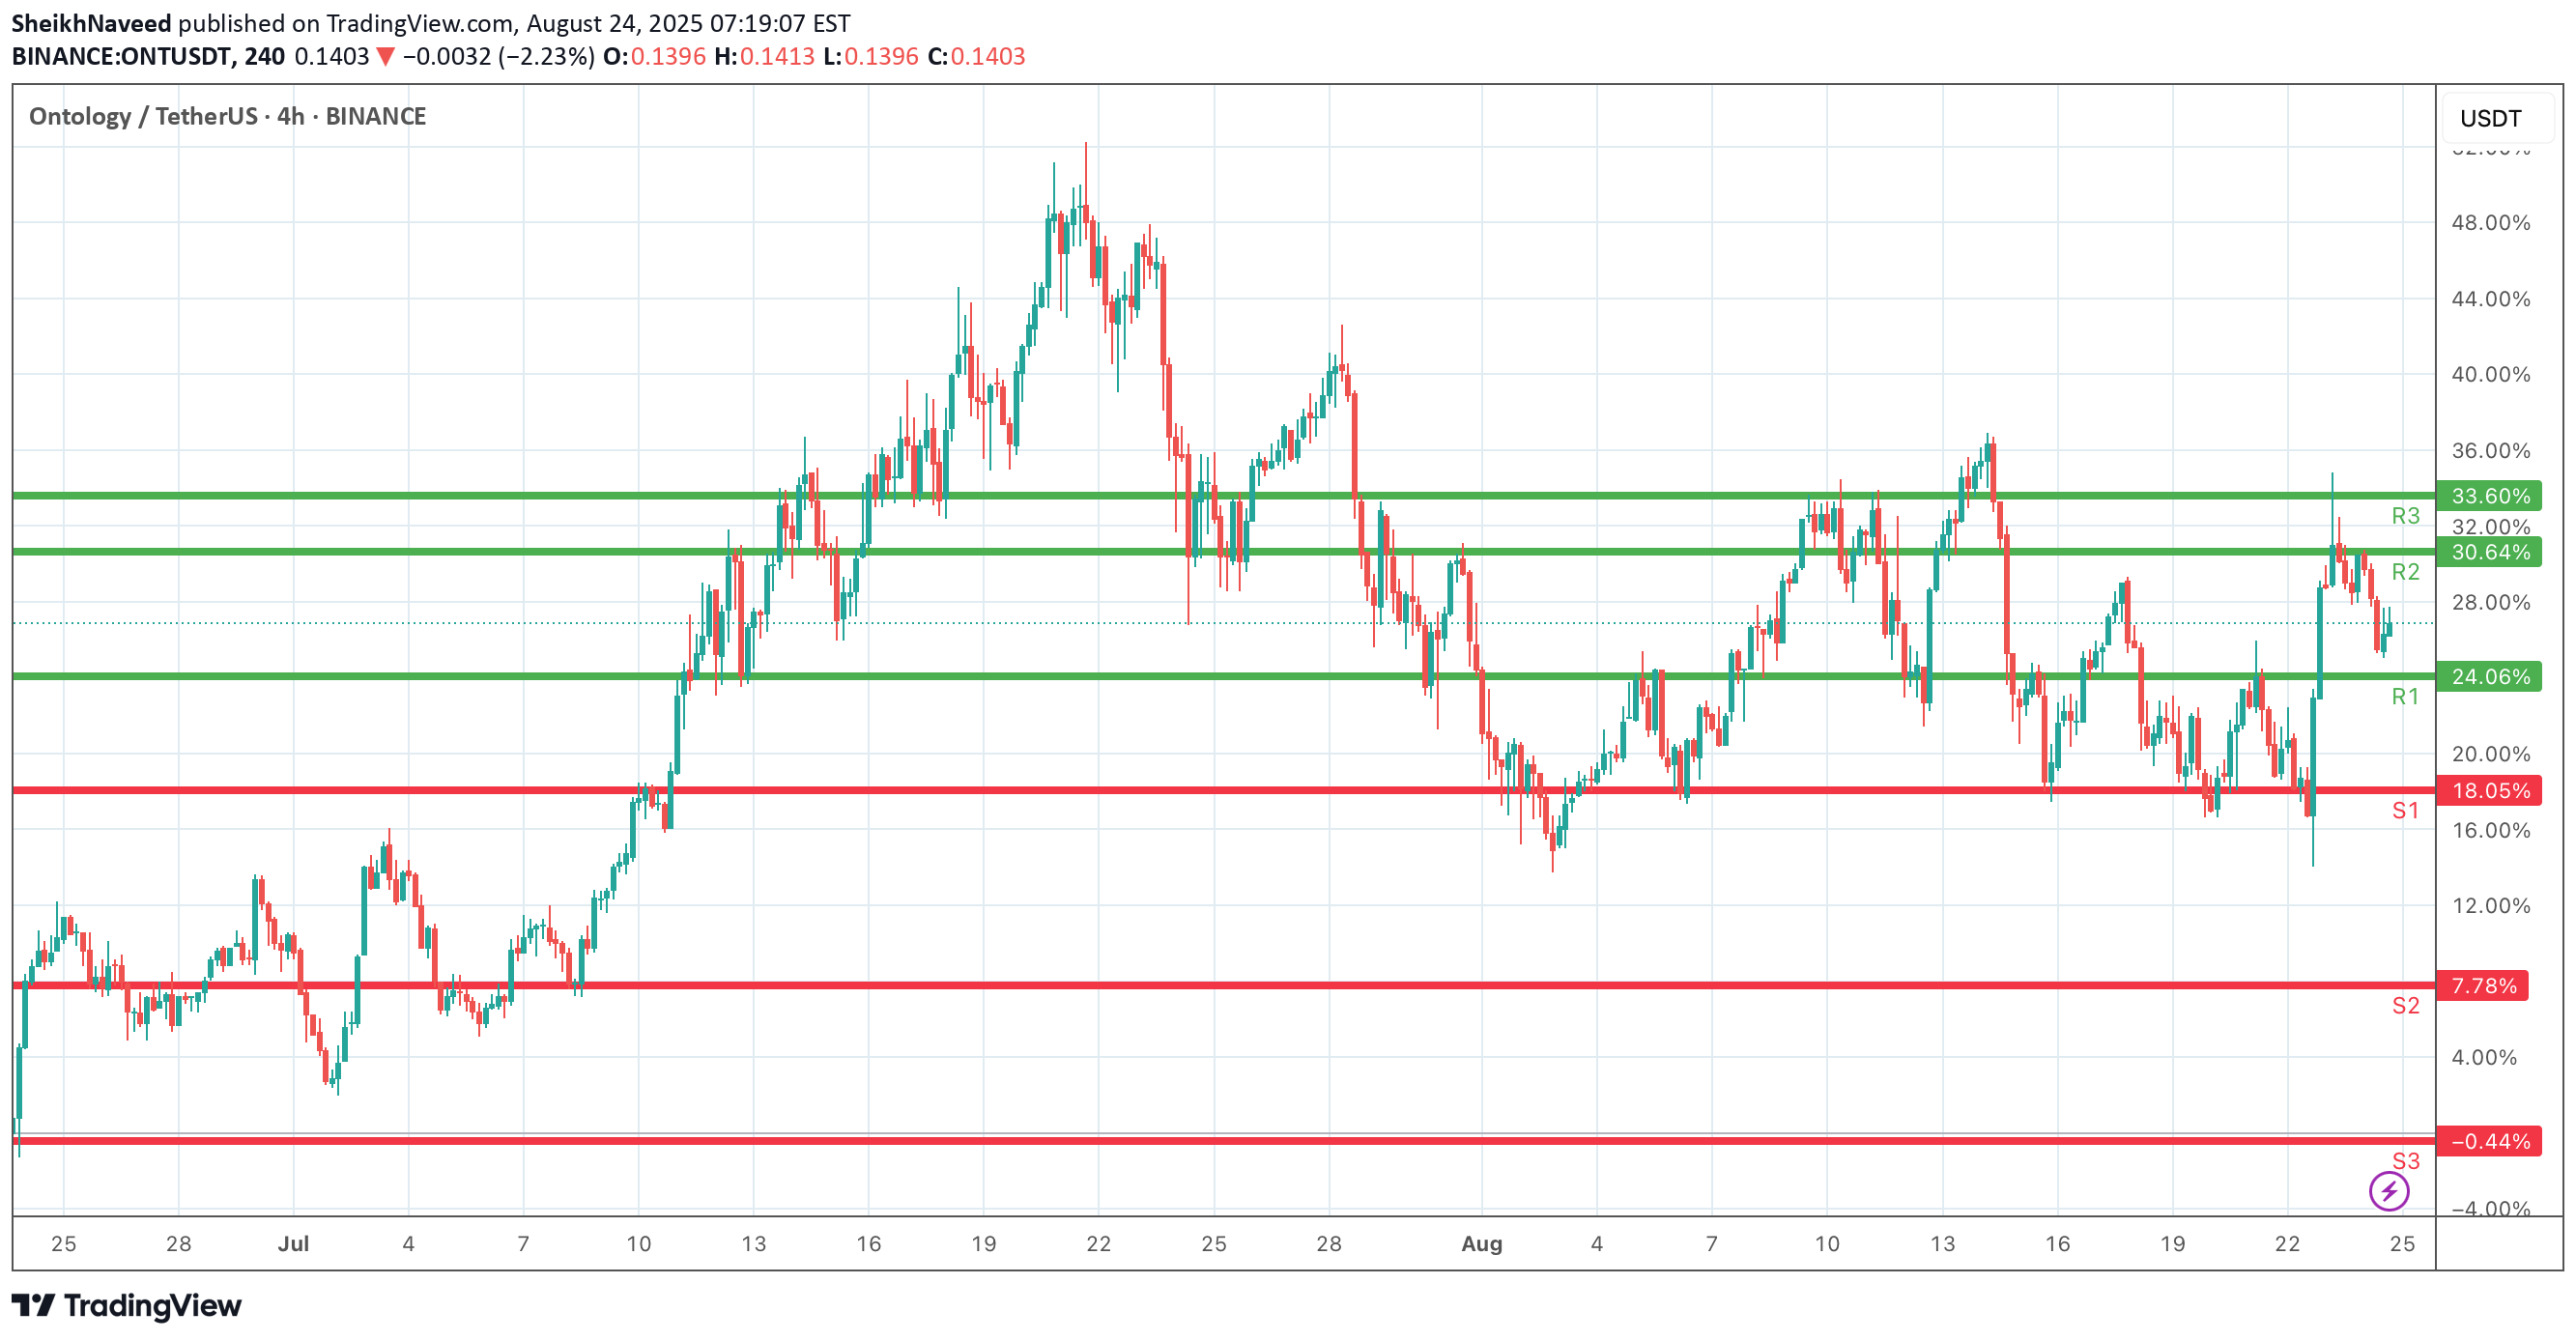
Ontology is trading within a well-defined range, testing support and resistance levels frequently. On the downside, S1 (18.05%) is the first support to monitor. A break below could extend losses toward S2 (7.78%), with S3 (-0.44%) acting as a deeper bearish target. On the upside, R1 (24.06%) is the first resistance that price recently reclaimed. If momentum continues, ONT could challenge R2 (30.64%), with further extension to R3 (33.60%) if buyers strengthen. Currently, price action is hovering between R1 and R2, signaling consolidation. A breakout above R2 would favor a bullish continuation, while rejection could bring a pullback toward S1. ONT/USDT 4H •Support: 18.05 / 7.78 / -0.44 •Resistance: 24.06 / 30.64 / 33.60 Above R2 = bullish momentum. Below S1 = downside risk.

SheikhNaveed
FLM/USDT 4H Technical Outlook
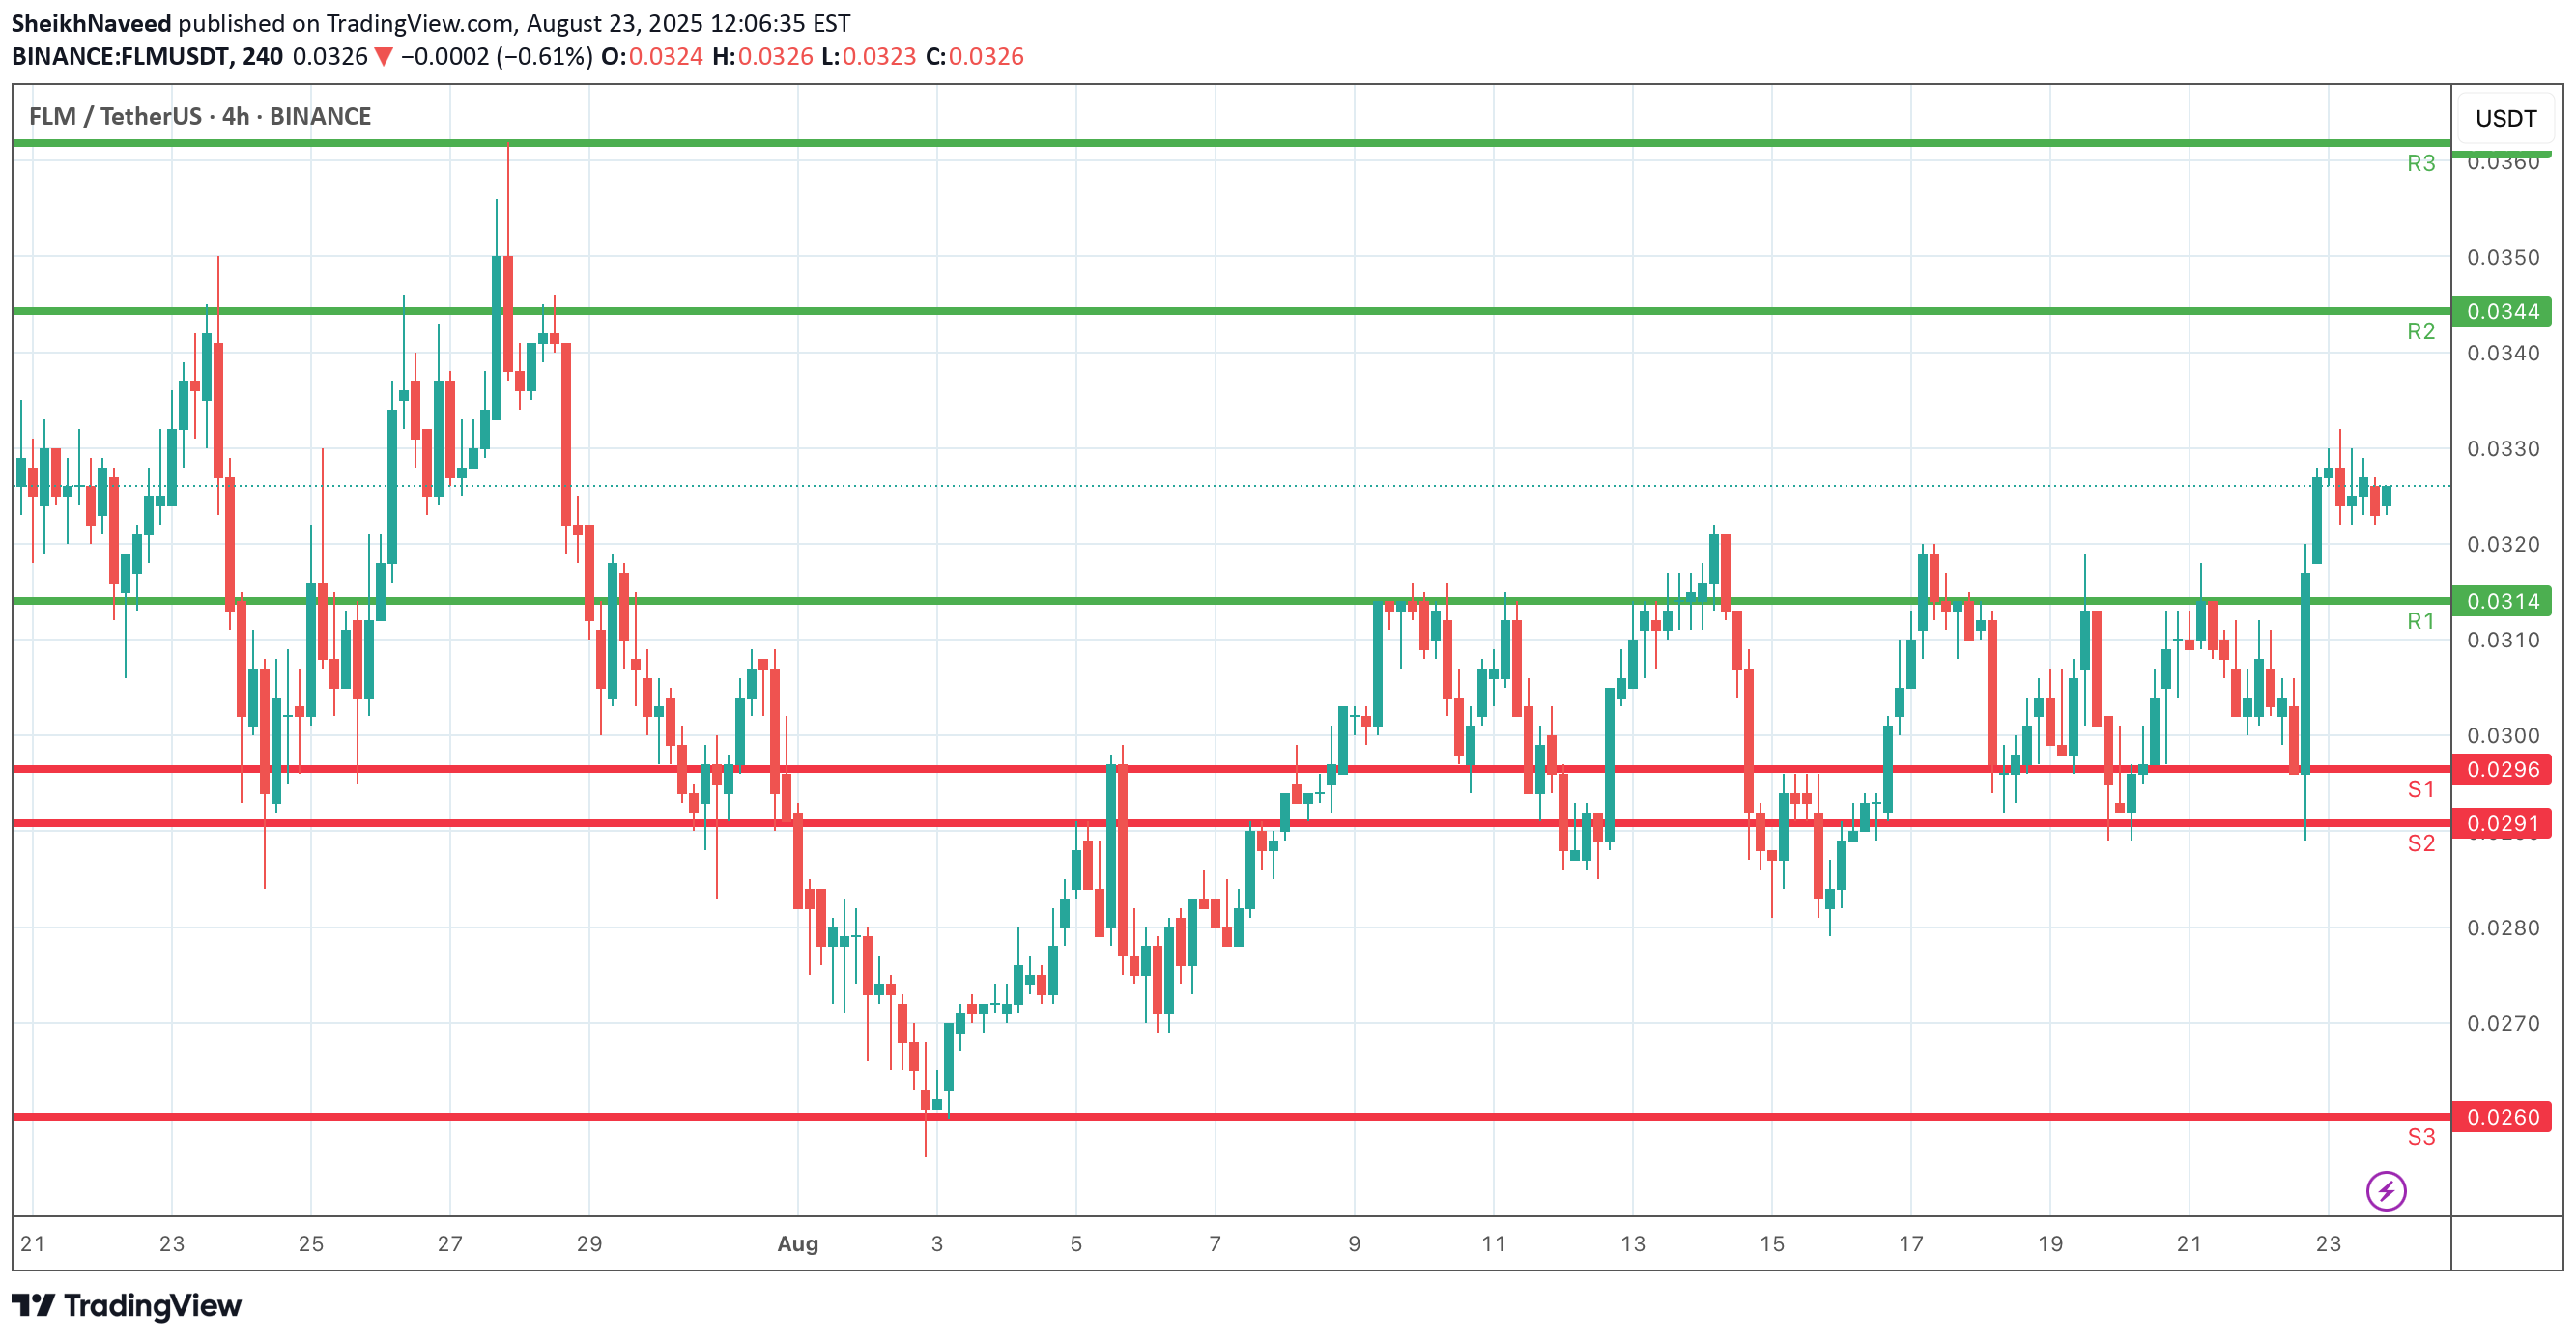
FLM is consolidating after reclaiming key support zones. On the downside, S1 (0.0296) and S2 (0.0291) are the immediate supports. A deeper correction could extend toward S3 (0.0260) if bearish momentum accelerates. On the upside, R1 (0.0314) is the first resistance to watch. A confirmed breakout above it strengthens the case for a move toward R2 (0.0344), with further upside potential to R3 (0.0360) if momentum continues. Currently, price action is holding above R1, suggesting buyers are attempting to build bullish continuation. However, a drop back below S1 could weaken the short-term outlook.

SheikhNaveed
GRTUSDT_2025-08-23_15-07-59
This is a sample analysis description. The chart highlights key support and resistance levels, along with possible price movement scenarios. Please note that this is only placeholder text and does not represent actual financial advice.

SheikhNaveed
AUDIO/USDT 4H Technical Analysis
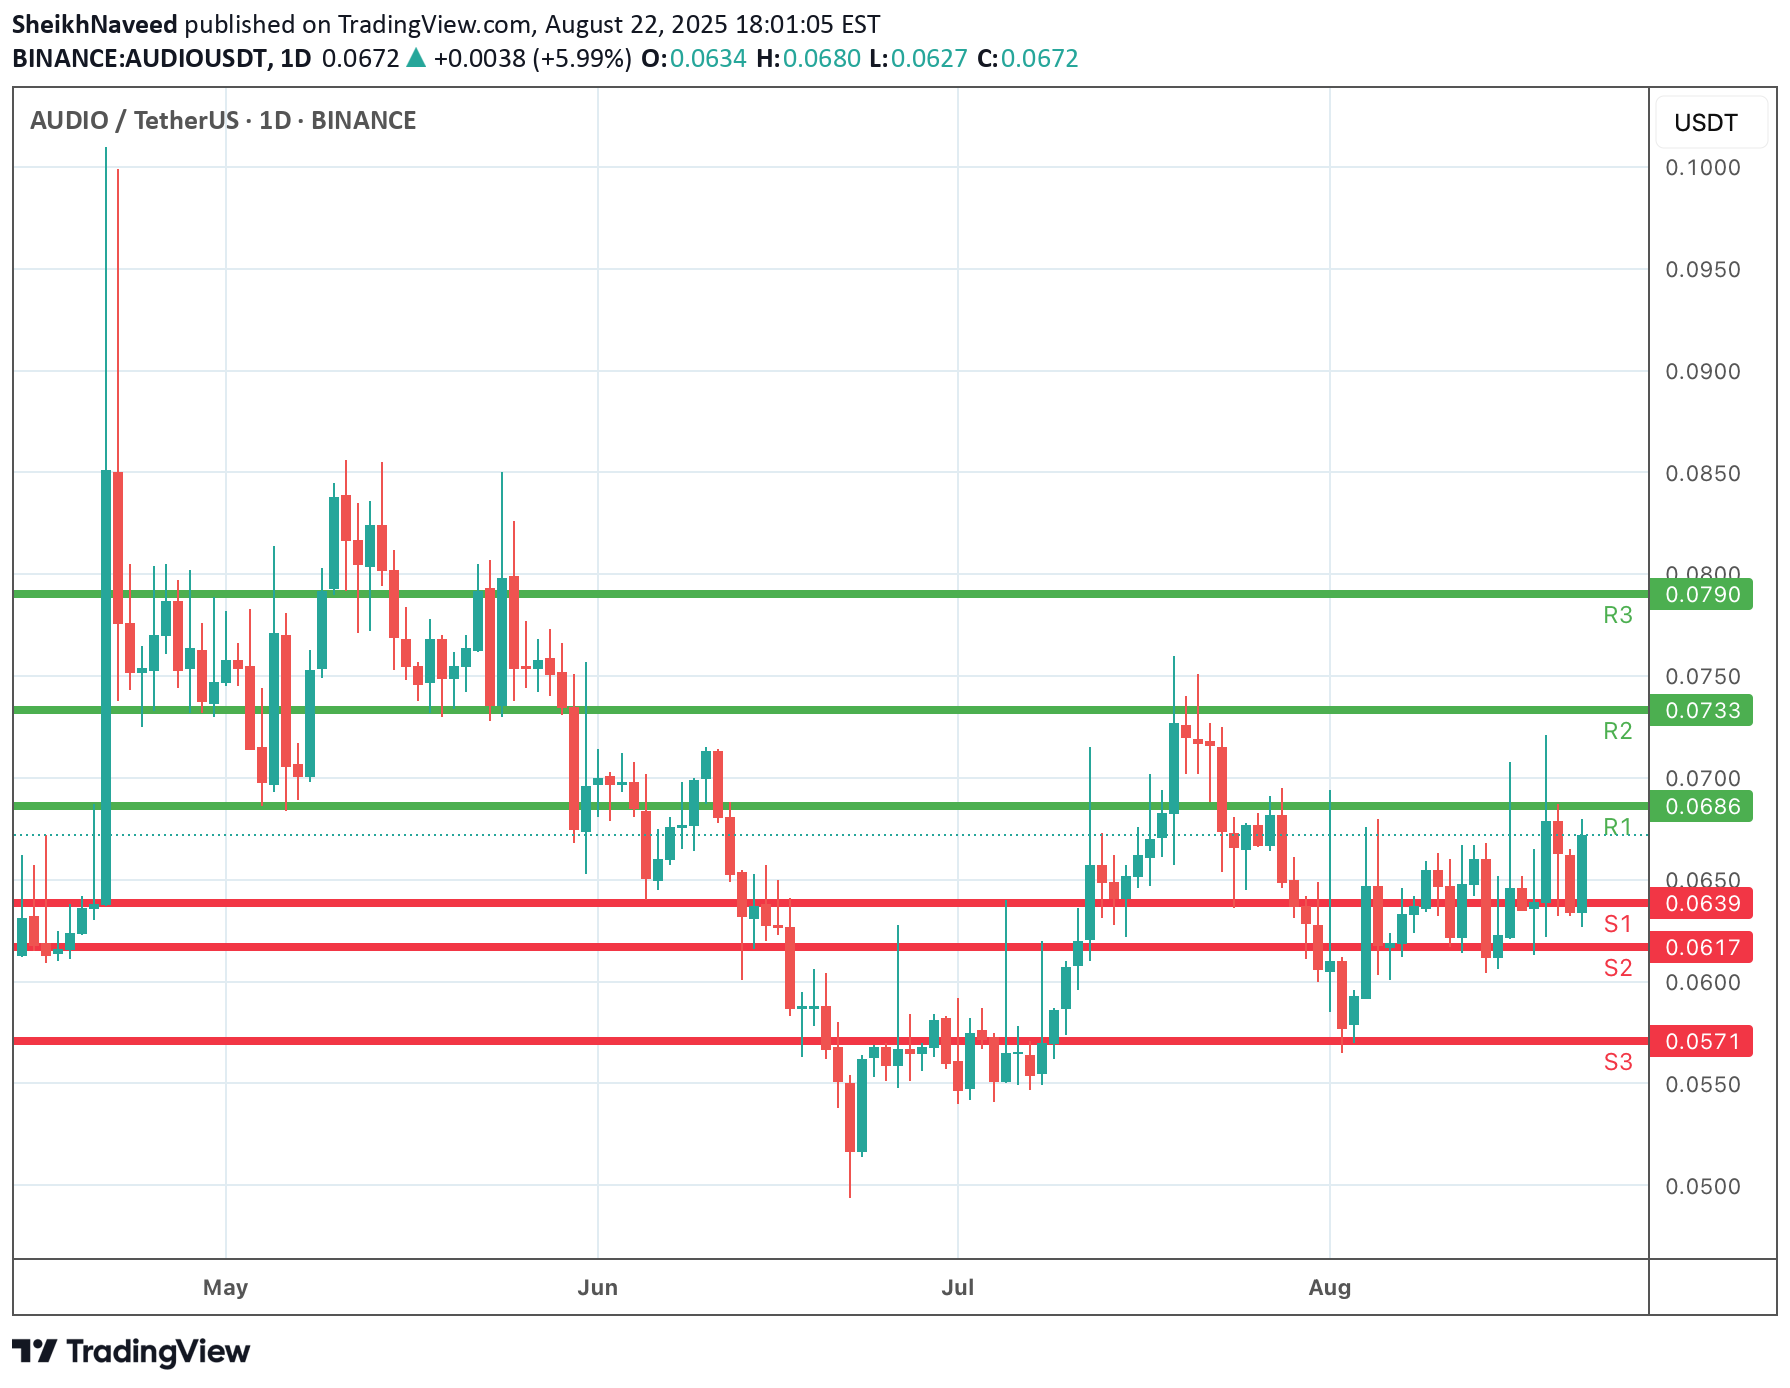
AUDIO/USDT 4H Technical Outlook AUDIO is consolidating within a defined range. S1 and S2 act as immediate downside levels where buyers may attempt to hold the price, while a deeper pullback could test lower supports. On the upside, R1 and R2 serve as resistance barriers that must be cleared for bullish momentum to continue. A confirmed breakout above R1 could open the way for further gains, while a drop below S1 may signal extended weakness. Traders are advised to monitor volume and momentum indicators for confirmation.

SheikhNaveed
ALGO/USDT 4H Technical Outlook
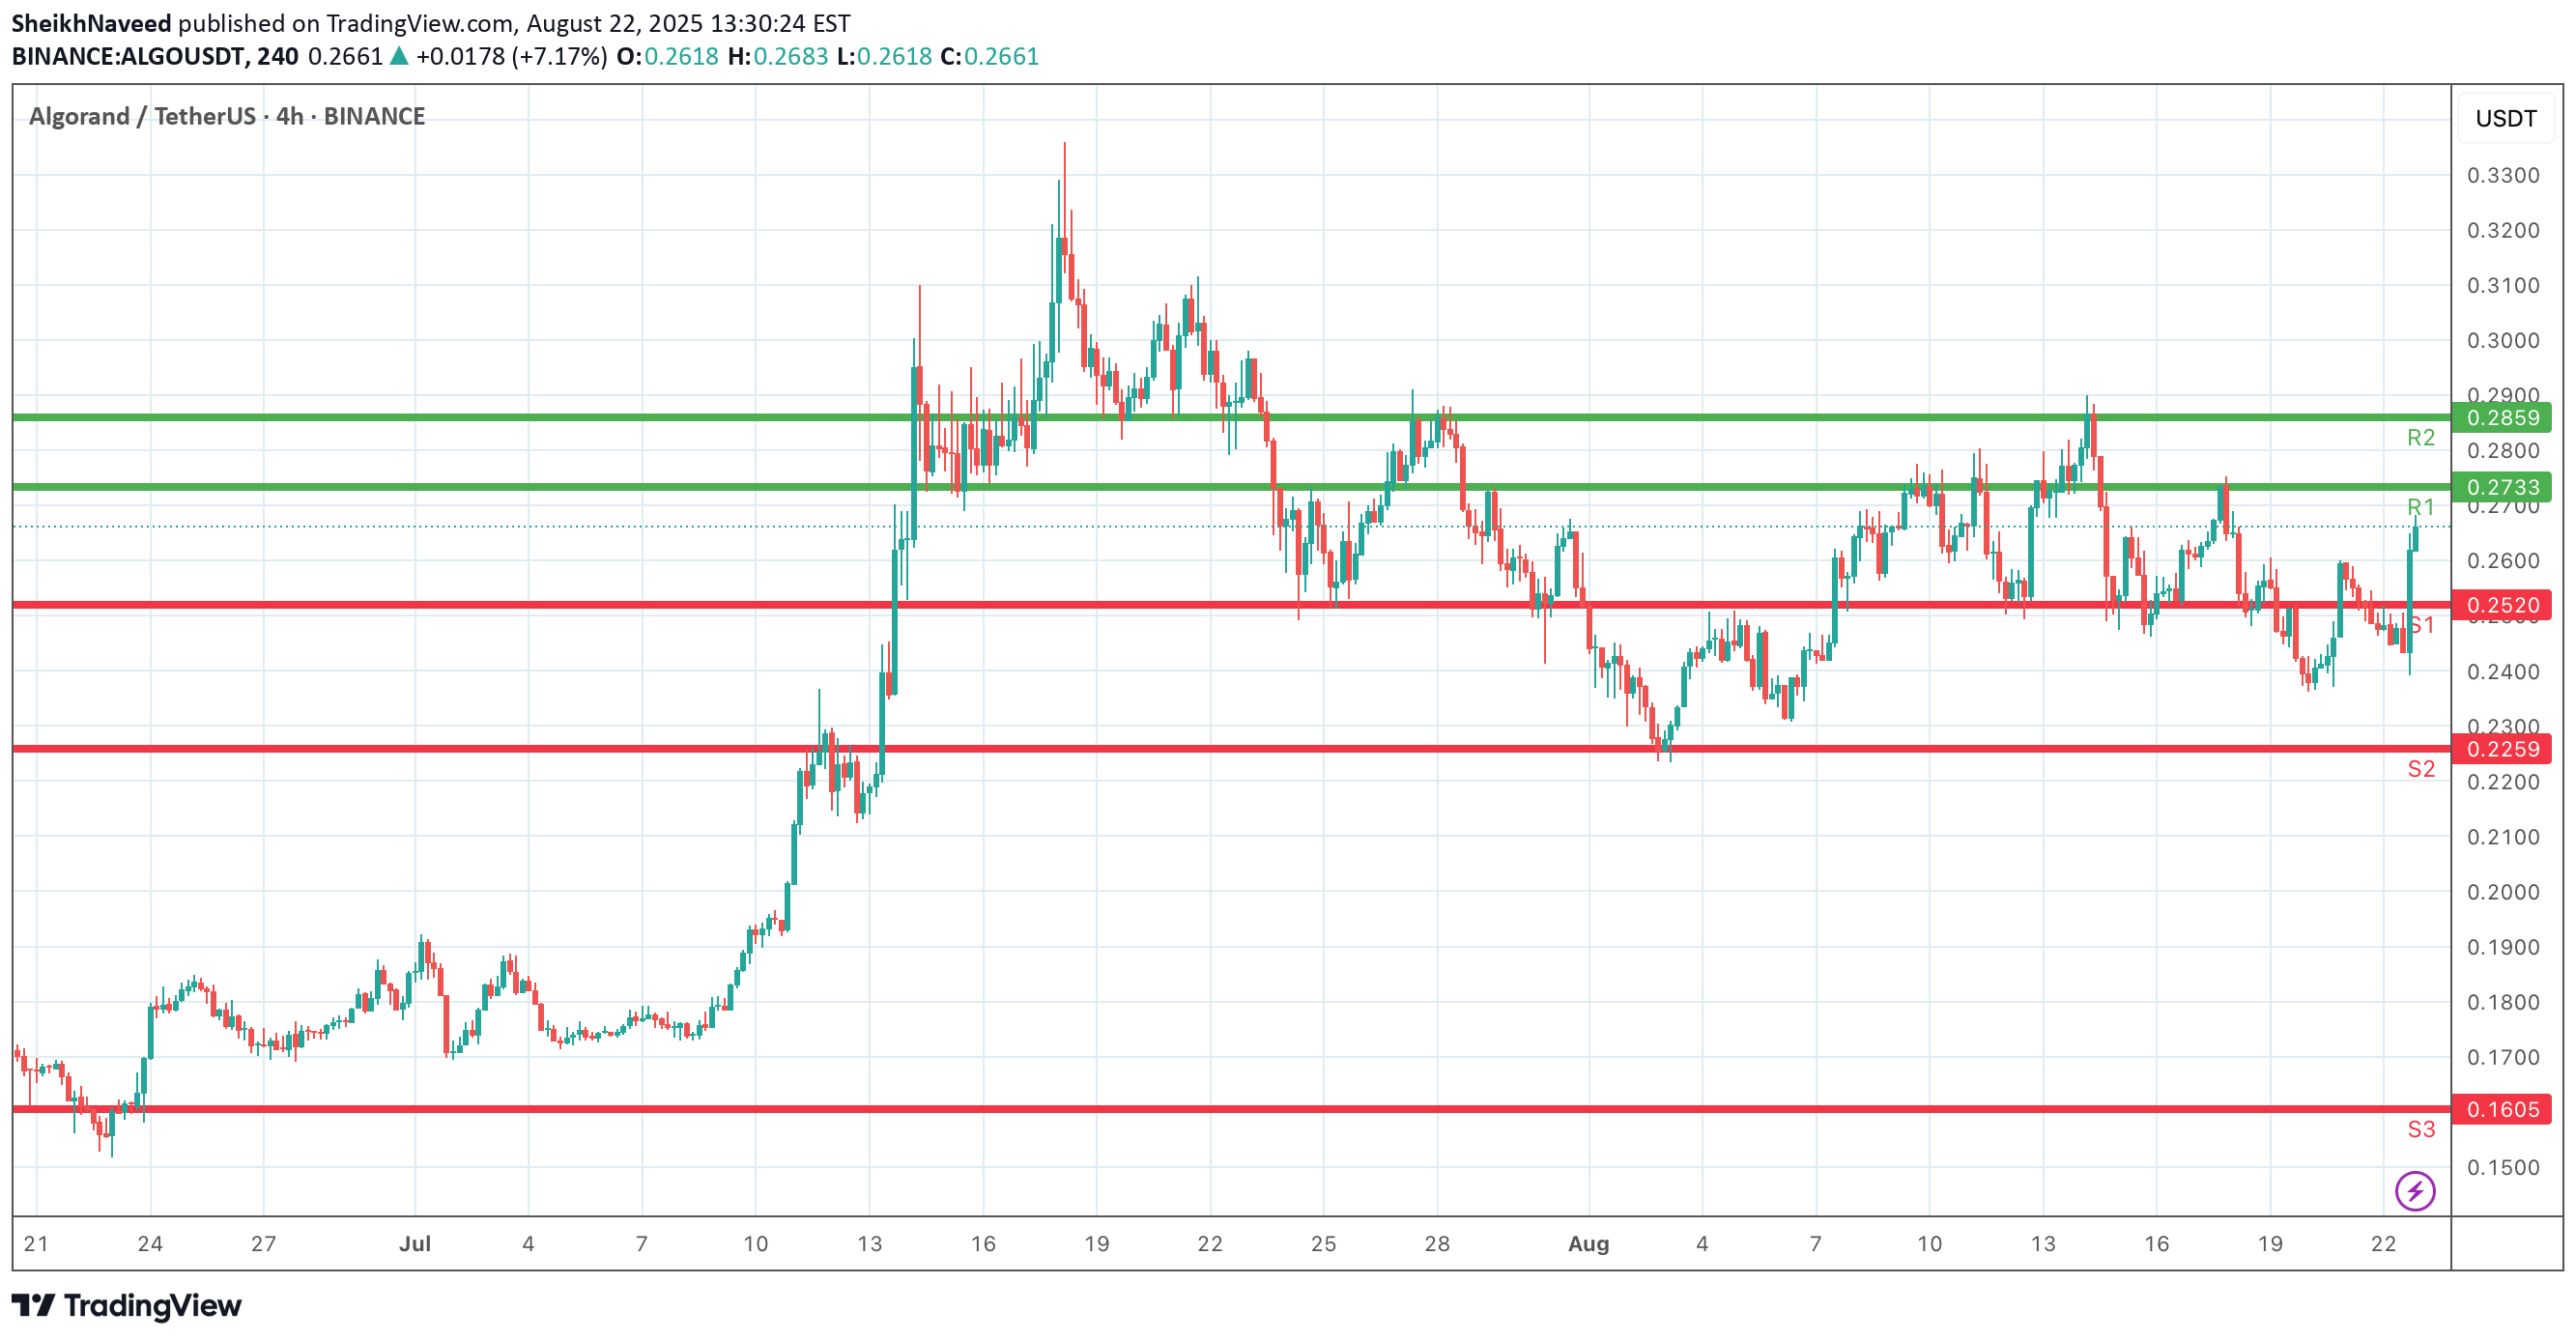
ALGO is trading around the mid-range, with S1 (50.37%) acting as immediate support. A deeper pullback may target S2 (34.77%) and S3 (-4.24%) if selling pressure increases. On the upside, R1 (63.08%) and R2 (70.58%) are the key resistance zones to watch. A confirmed breakout above R1 could strengthen bullish momentum toward R2, while a breakdown below S1 may expose the price to further downside. Monitoring volume and candle confirmations is recommended before entry.

SheikhNaveed
CTSI/USDT 4H chart
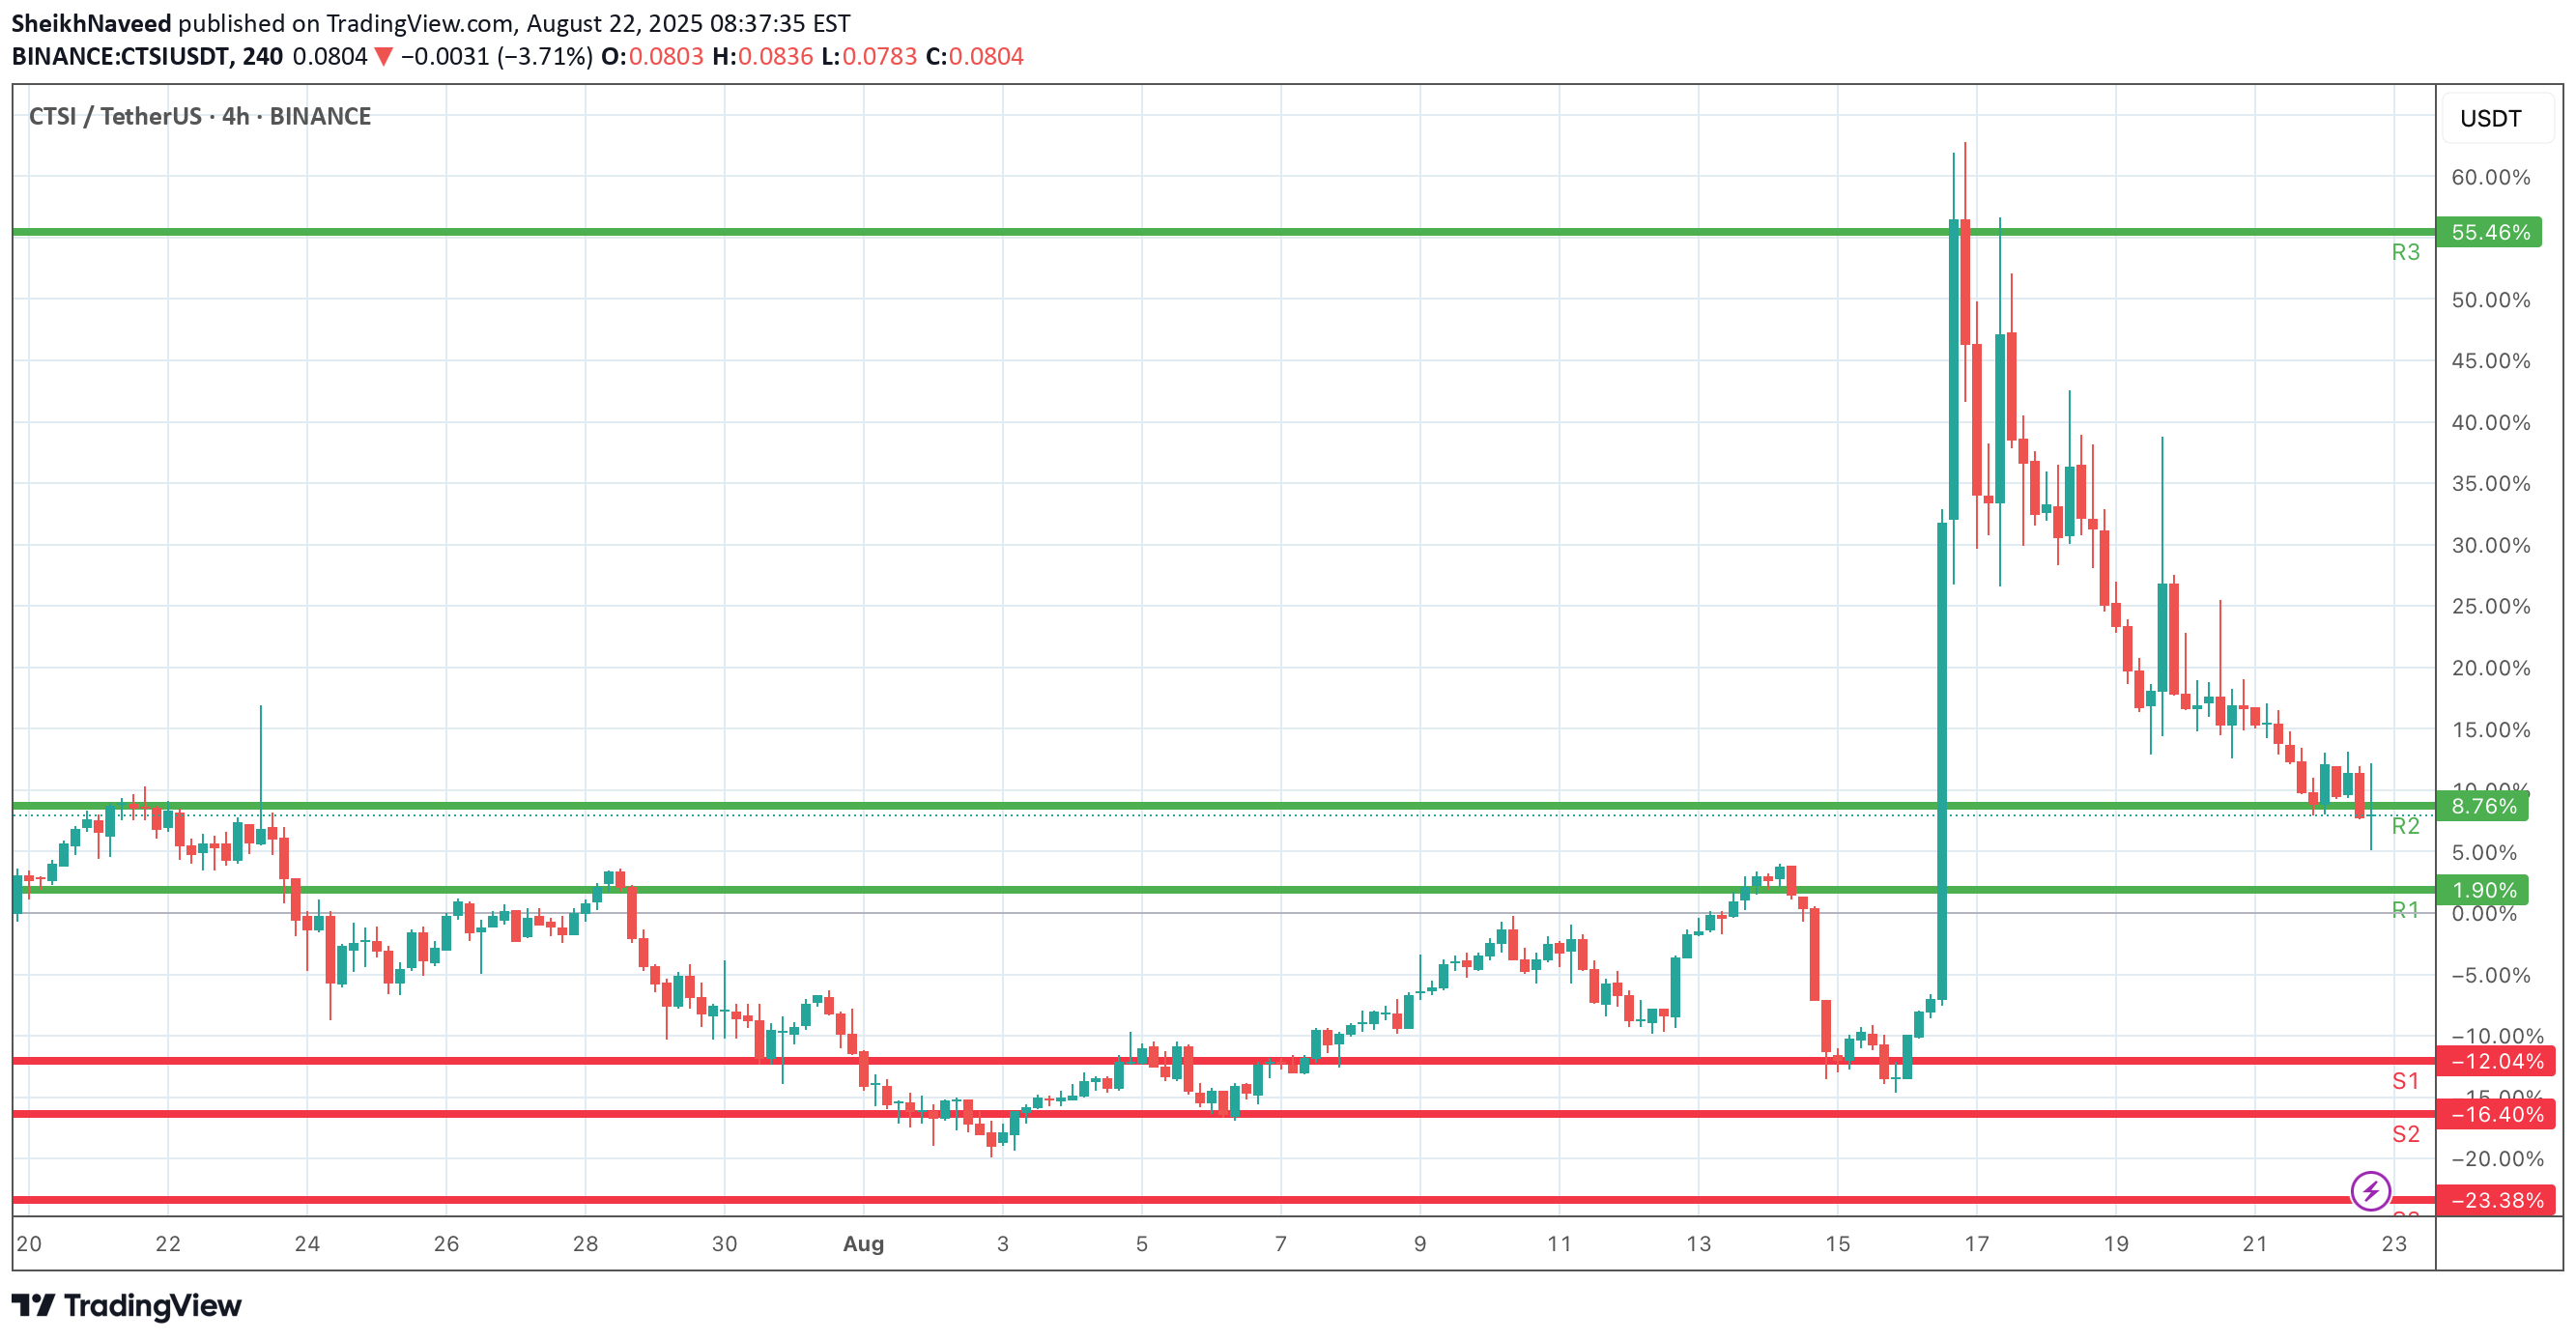
CTSI/USDT 4H chart Levels: • Resistance (R3): ~55.46% • Resistance (R2): ~8.76% • Resistance (R1): ~1.90% • Support (S1): ~-12.04% • Support (S2): ~-16.40% • Support Zone: extends toward ~-23.38% What the chart shows: 1. Price pumped hard to R3 (55.46%) but got rejected strongly. 2. Now it’s consolidating near R2 (8.76%), struggling to hold above it. 3. If it loses momentum, it may retest R1 (1.90%) or even dip into the support zone (S1–S2). 4. For a bullish move again, price must break and hold above R2 → R3, which seems like a tough resistance zone. Trading perspective: • Bullish case: If CTSI bounces above R2 and sustains, it could attempt another leg up. • Bearish case: If it fails to hold R2, we might see a drop toward S1/S2. At the moment, momentum looks weakened (lots of red candles after the big pump), so it may consolidate or retest support before any big move.

SheikhNaveed
SLP/USDT 4H Technical Outlook
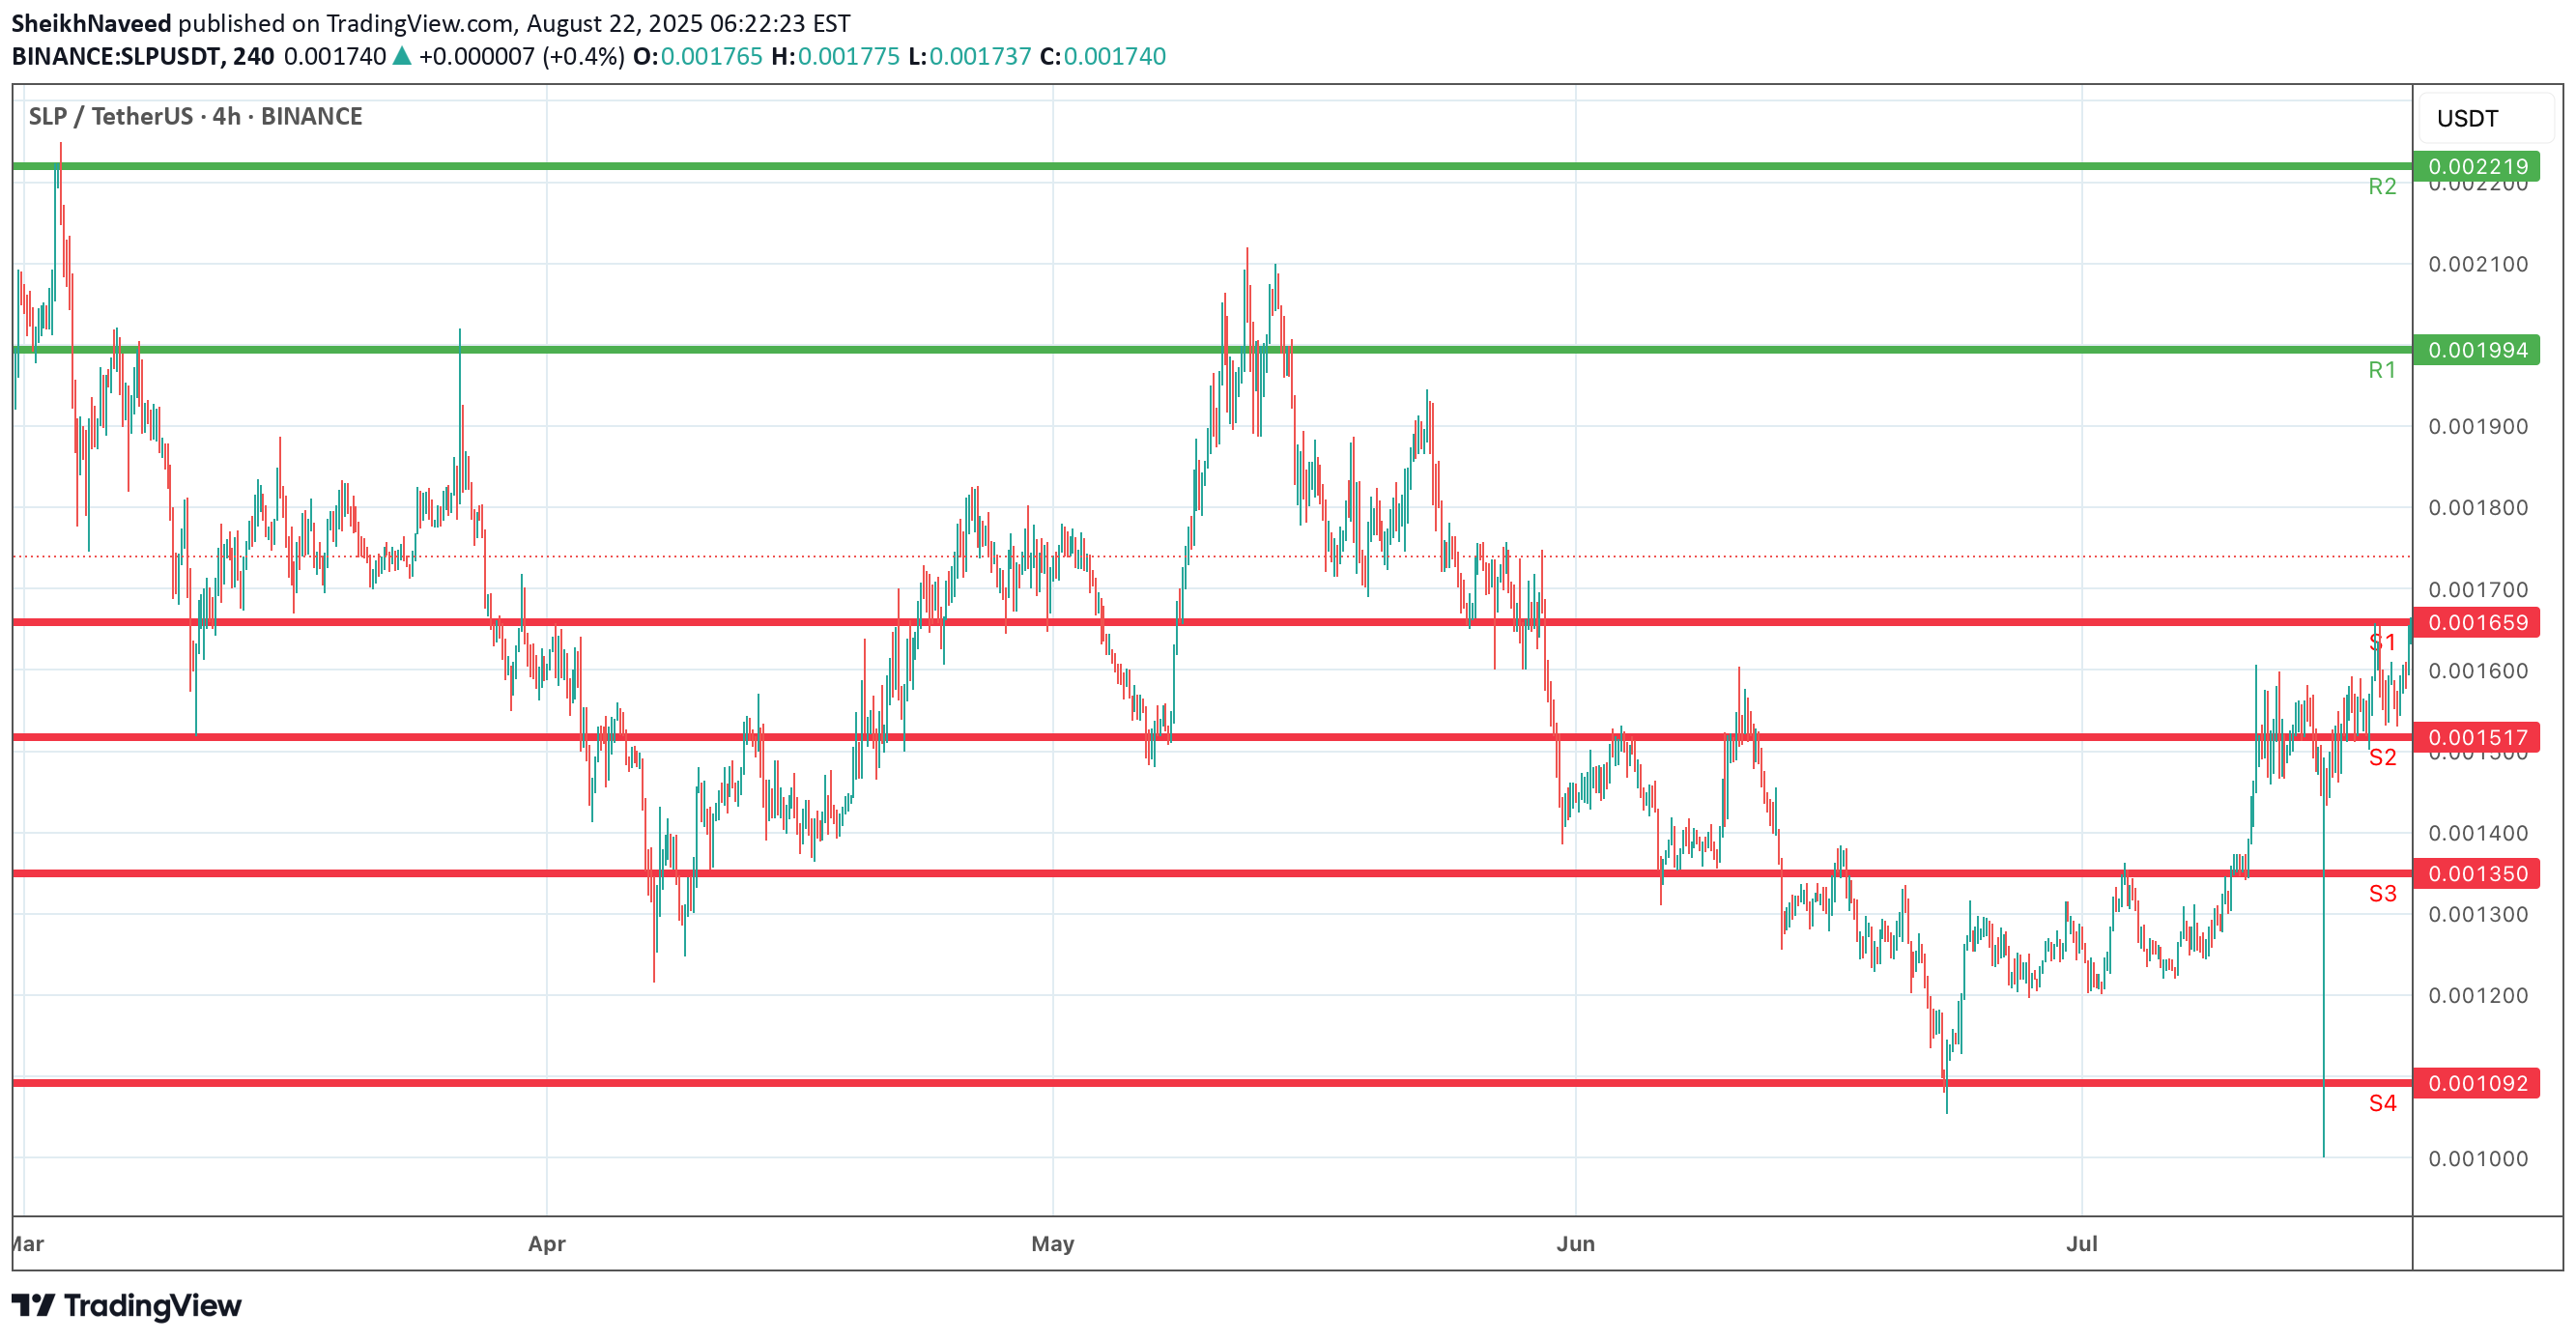
The chart highlights well-defined support and resistance levels. On the downside, S1 (0.001659) and S2 (0.001517) serve as near-term support zones where buyers may look to defend. Further downside risk could extend toward S3 (0.001350) and S4 (0.001092) if momentum weakens. On the upside, R1 (0.001994) and R2 (0.002219) act as resistance barriers, where selling pressure or profit-taking may emerge. Trading within this range, a breakout above R1 could open the path to bullish continuation, while a breakdown below S2 may trigger extended bearish pressure. Monitoring volume and candle closes around these key zones will provide stronger confirmation for directional bias.

SheikhNaveed
COTI/USDT 4H Technical Outlook
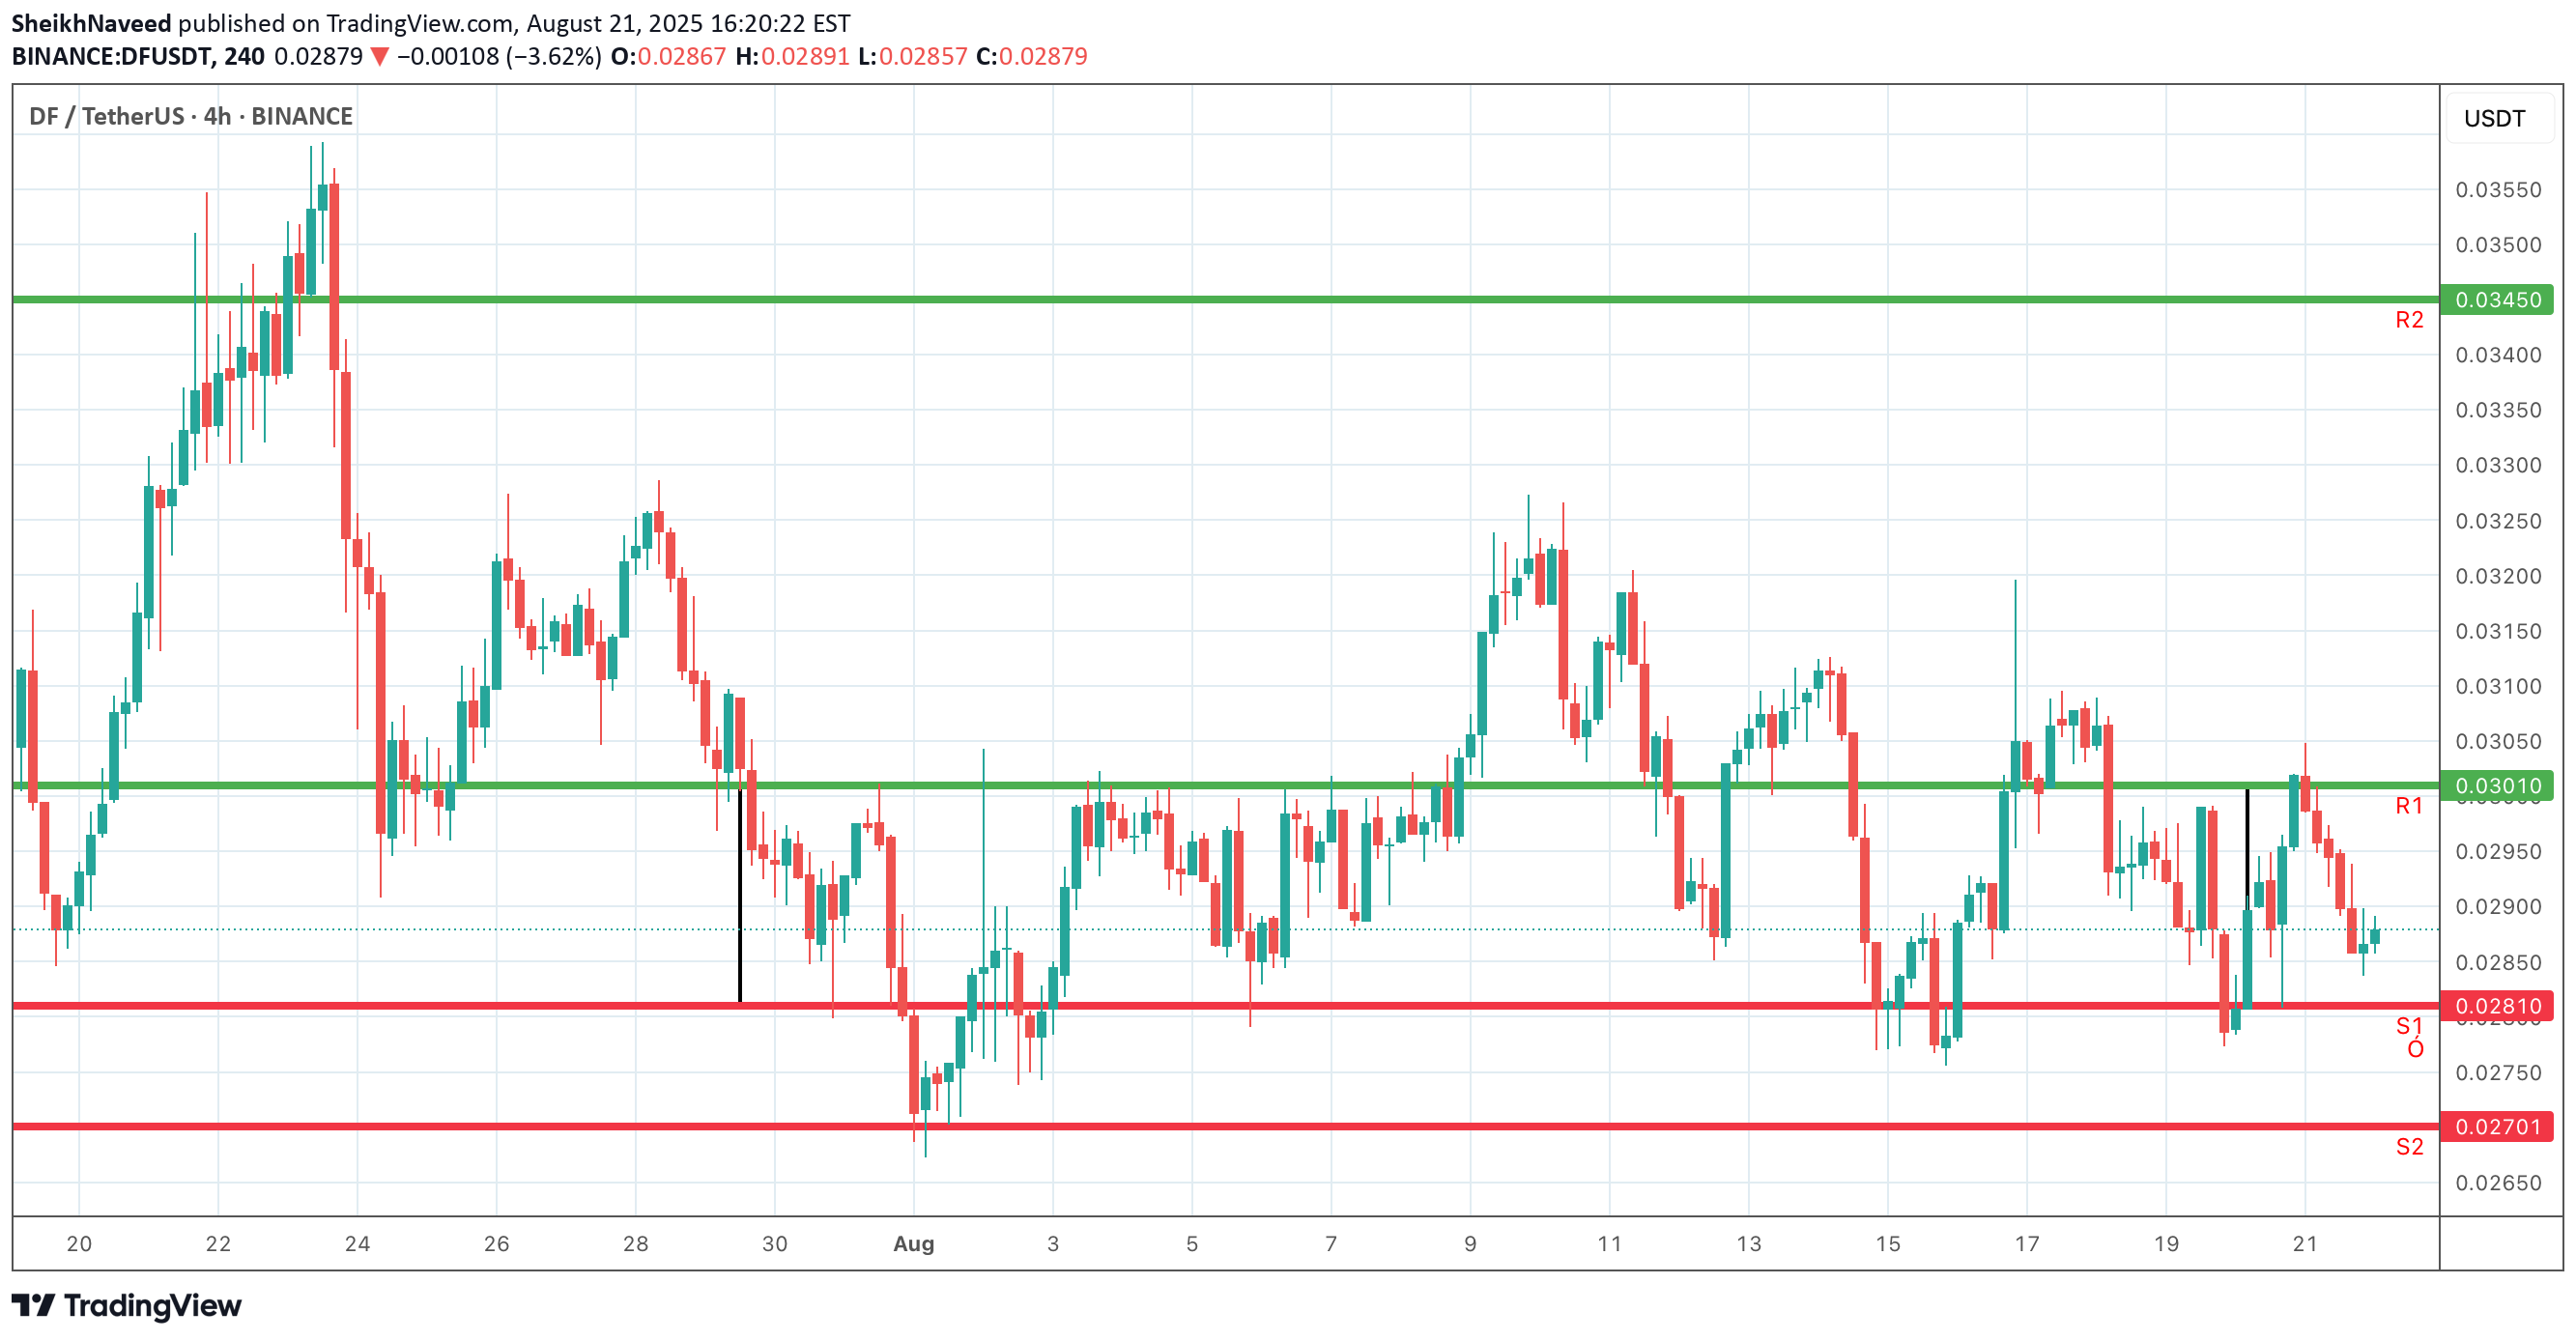
On the 4-hour chart, key support and resistance zones have been plotted. S1 and S2 represent the downside levels where demand could emerge, offering potential rebound points. R1 and R2 indicate resistance barriers on the upside, where selling pressure or profit-taking may appear. Monitoring price action around these levels is crucial: a breakout above resistance suggests bullish continuation, while a breakdown below support could signal further downside. Traders can align entries, exits, and stop-losses with these zones while confirming moves through trend and momentum indicators.

SheikhNaveed
COTI/USDT 4H Technical Outlook
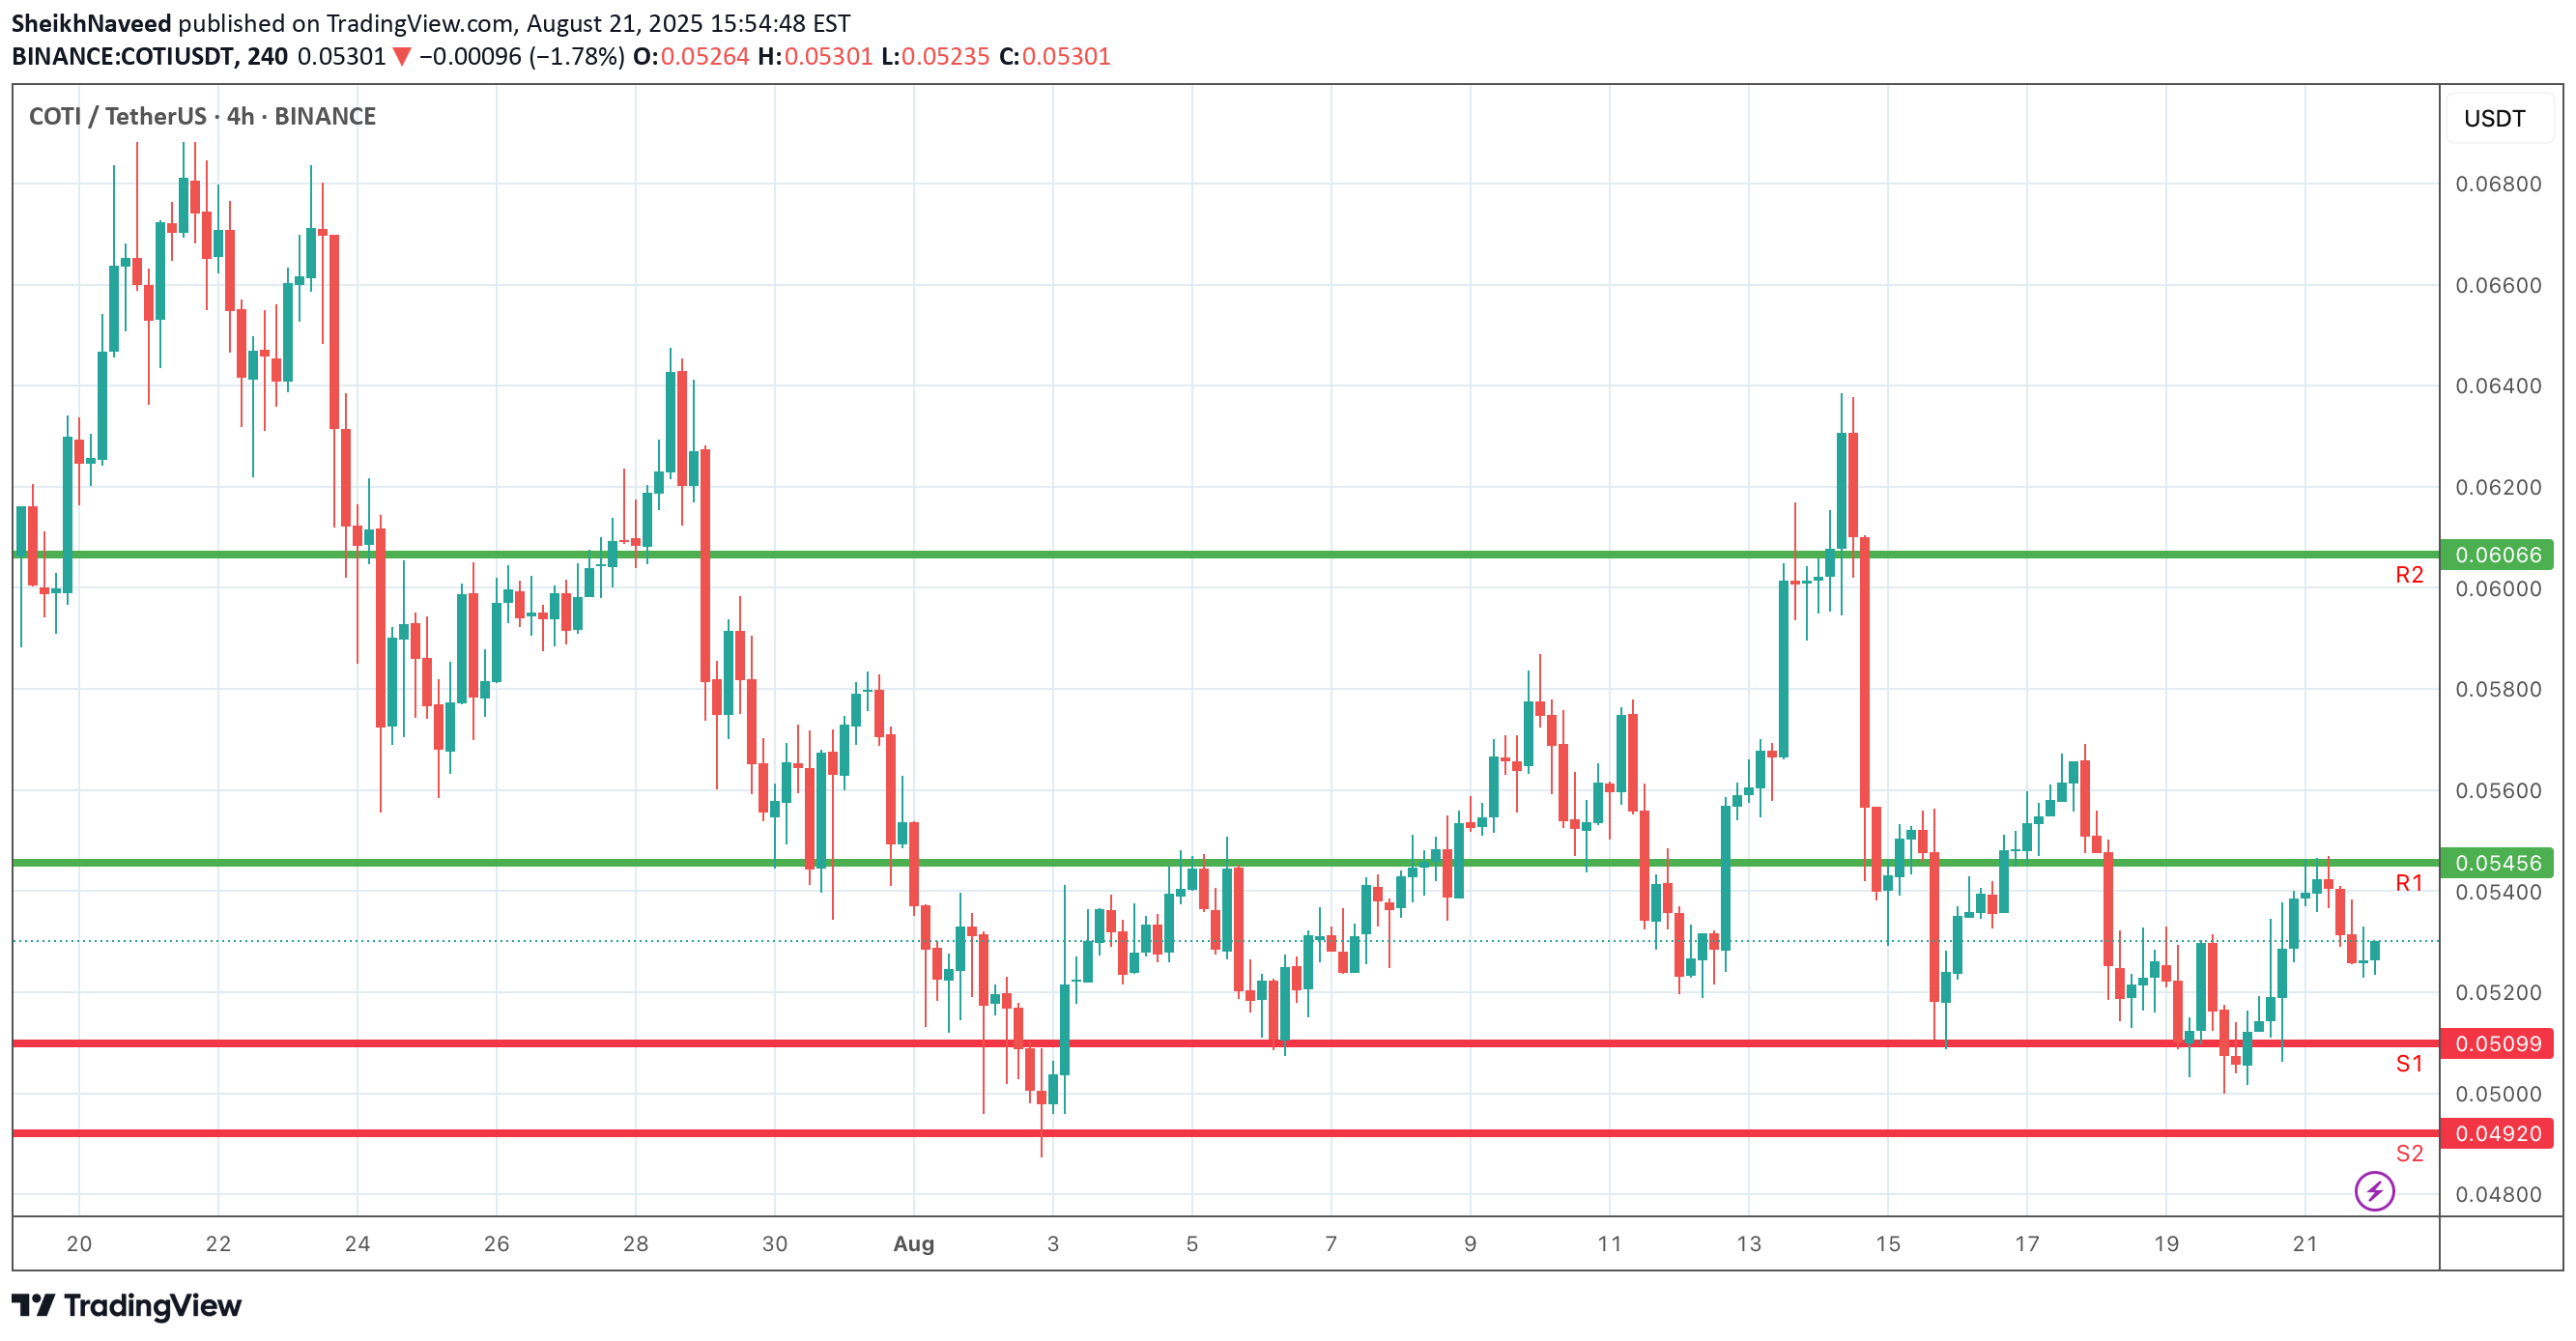
On the 4-hour chart, key support and resistance levels have been identified. S1 and S2 mark the downside areas where buyers may step in, providing potential rebound zones. R1 and R2 highlight the upside resistance barriers, where sellers could apply pressure or profit-taking may occur. These zones will guide short-term trading decisions: a break above resistance could indicate bullish momentum, while a drop below support may signal extended weakness. Traders can use these levels for setting entries, stop-losses, and profit targets, while also confirming signals with volume and trend indicators.
Disclaimer
Any content and materials included in Sahmeto's website and official communication channels are a compilation of personal opinions and analyses and are not binding. They do not constitute any recommendation for buying, selling, entering or exiting the stock market and cryptocurrency market. Also, all news and analyses included in the website and channels are merely republished information from official and unofficial domestic and foreign sources, and it is obvious that users of the said content are responsible for following up and ensuring the authenticity and accuracy of the materials. Therefore, while disclaiming responsibility, it is declared that the responsibility for any decision-making, action, and potential profit and loss in the capital market and cryptocurrency market lies with the trader.