Technical analysis by SheikhNaveed about Symbol DF on 8/21/2025
https://sahmeto.com/message/3728928

SheikhNaveed
Rank: 30908
Analytical Power:
1.3
COTI/USDT 4H Technical Outlook
Neutral
Price at Publish Time:
$0.028787

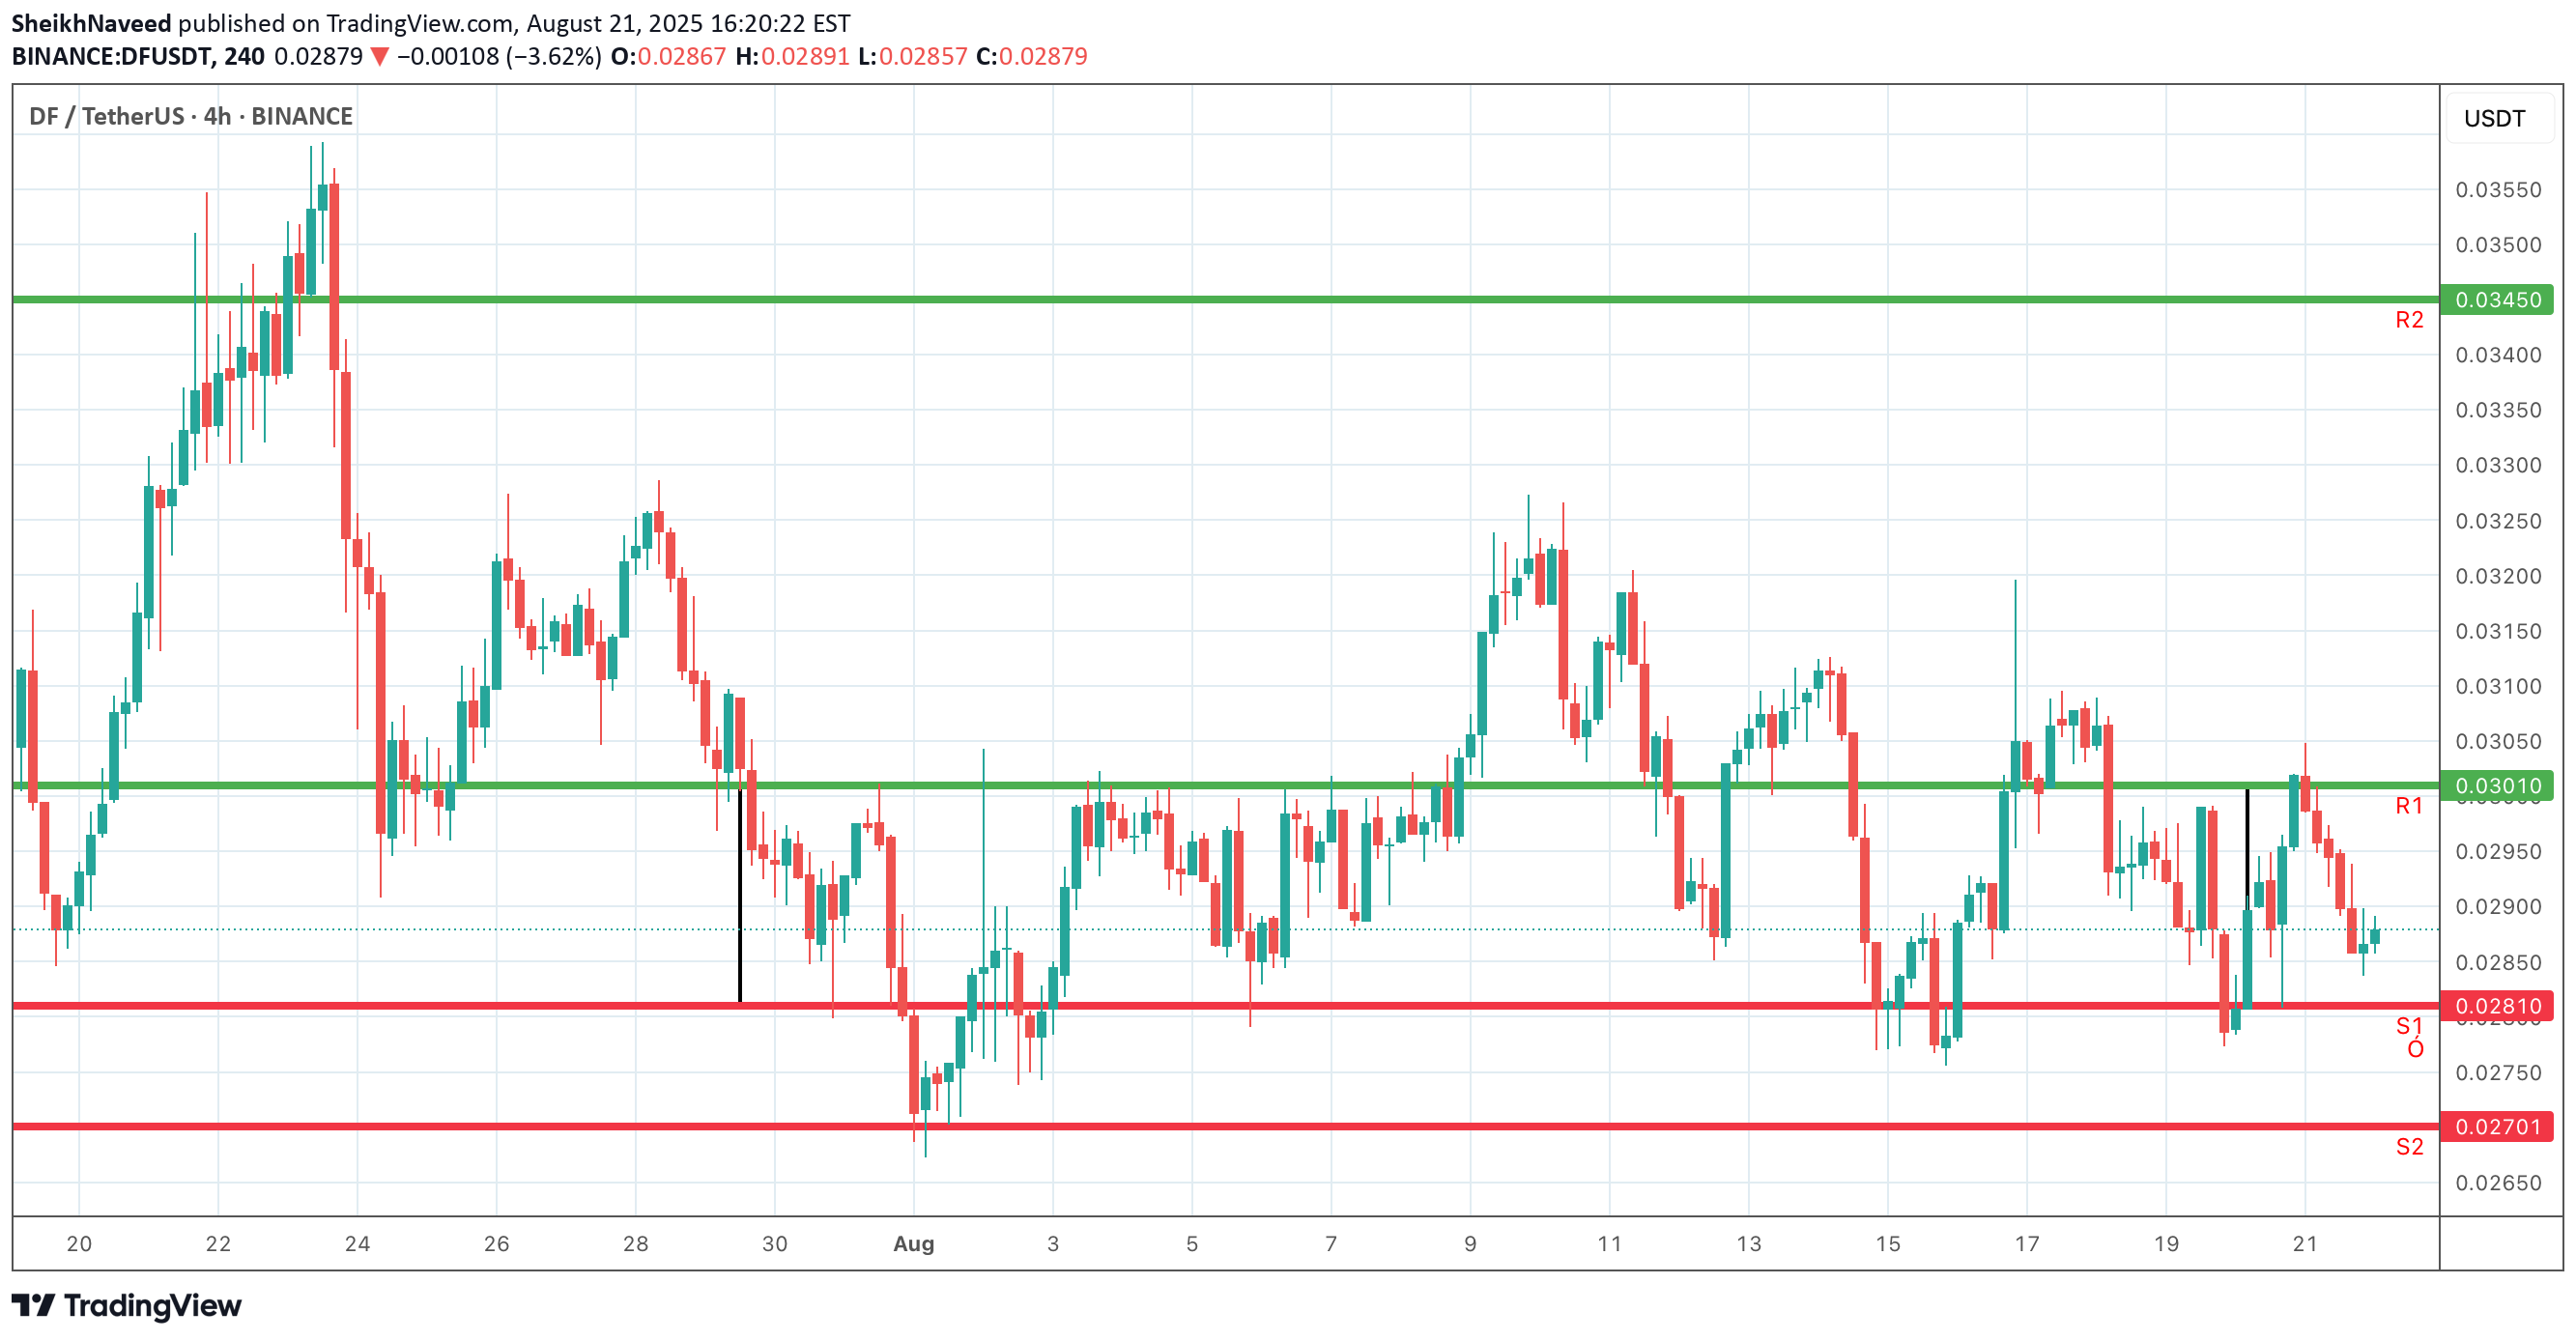
On the 4-hour chart, key support and resistance zones have been plotted. S1 and S2 represent the downside levels where demand could emerge, offering potential rebound points. R1 and R2 indicate resistance barriers on the upside, where selling pressure or profit-taking may appear. Monitoring price action around these levels is crucial: a breakout above resistance suggests bullish continuation, while a breakdown below support could signal further downside. Traders can align entries, exits, and stop-losses with these zones while confirming moves through trend and momentum indicators.
Source Message: TradingView