
Shayan_pay
@t_Shayan_pay

What symbols does the trader recommend buying?
Purchase History
پیام های تریدر
Filter
Shayan_pay
Is Ethereum dying?
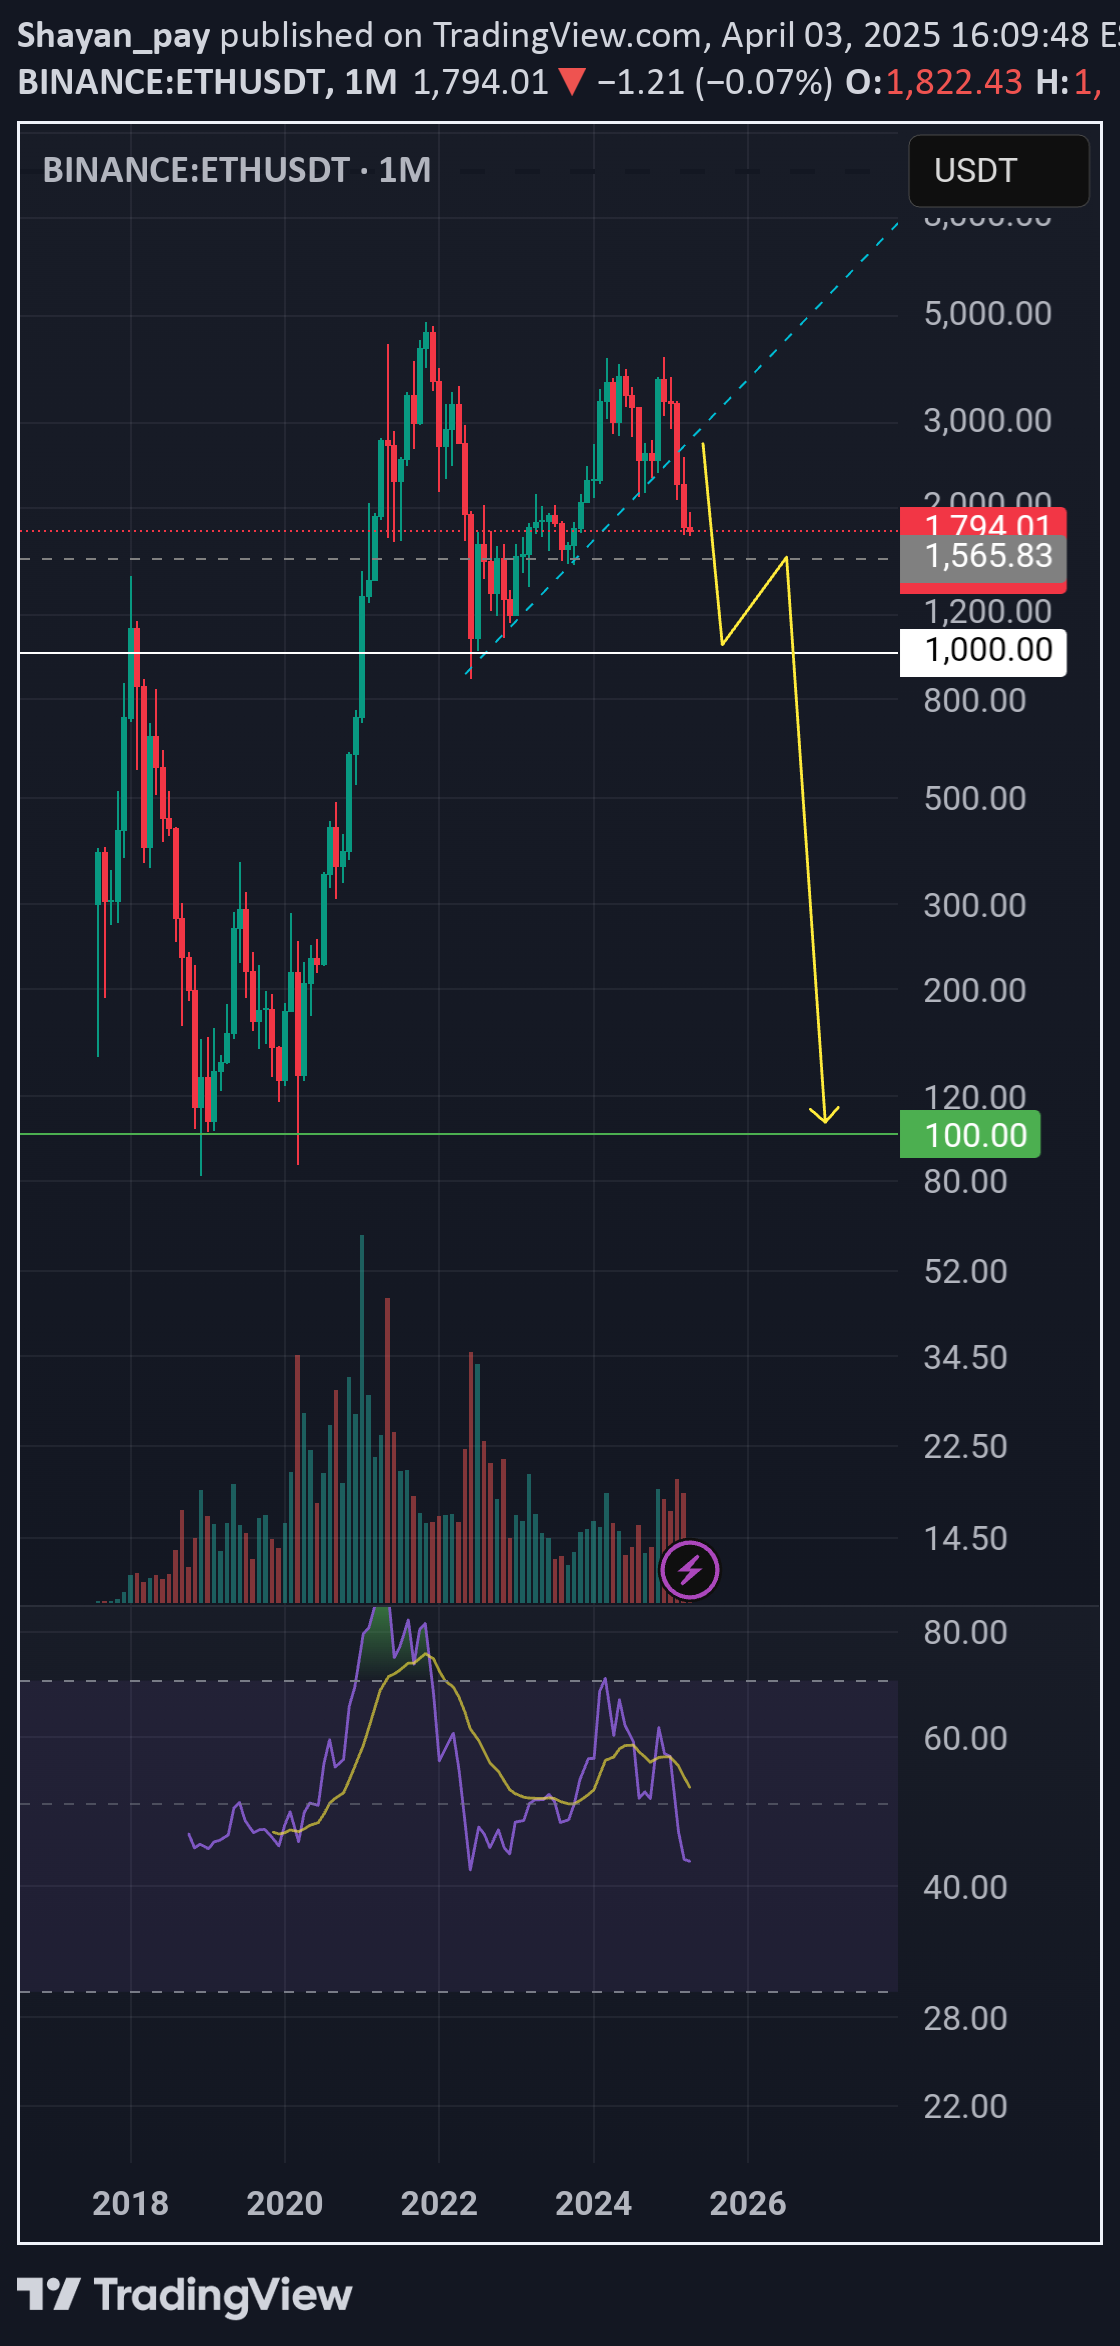
Ethereum is expected to fall to $1,000 support after breaking its dynamic support line and if there is no support at this price, it will drop to $100
Shayan_pay
Ethereum is dying !

Ethereum is expected to fall to $1,000 support after breaking its dynamic support line and if there is no support at this price, it will drop to $100
Shayan_pay
Bitcoin Head and shoulder
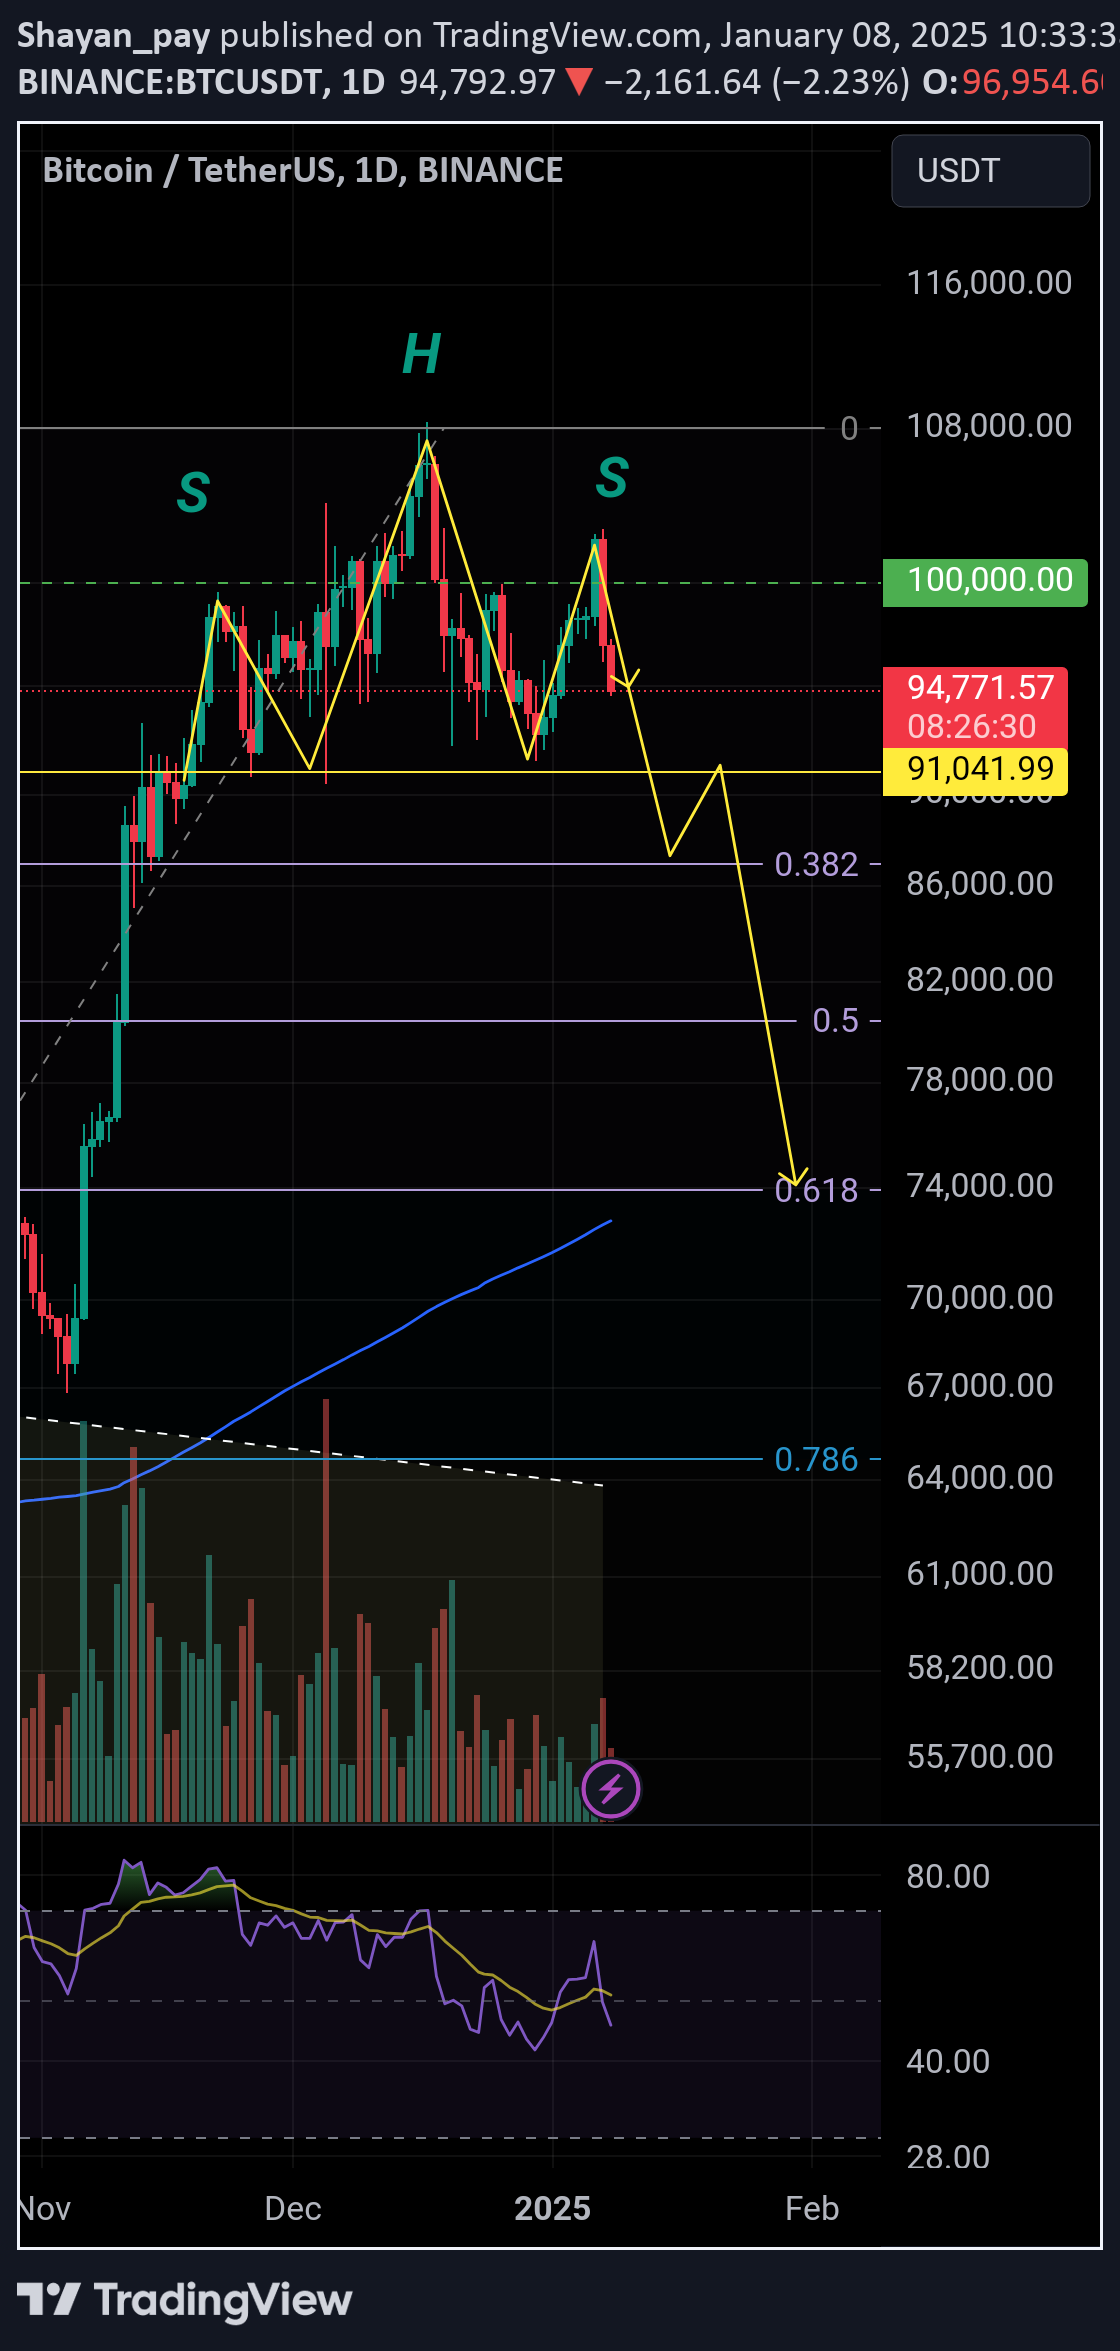
Bitcoin may form a head and shoulders pattern on the daily time frame. If the neckline is broken, the target will be $74,000, which is 61.8% of the Fibonacci retracement of the uptrend and MA 200
Shayan_pay
Shayan_pay
Not : falling wedge was broken
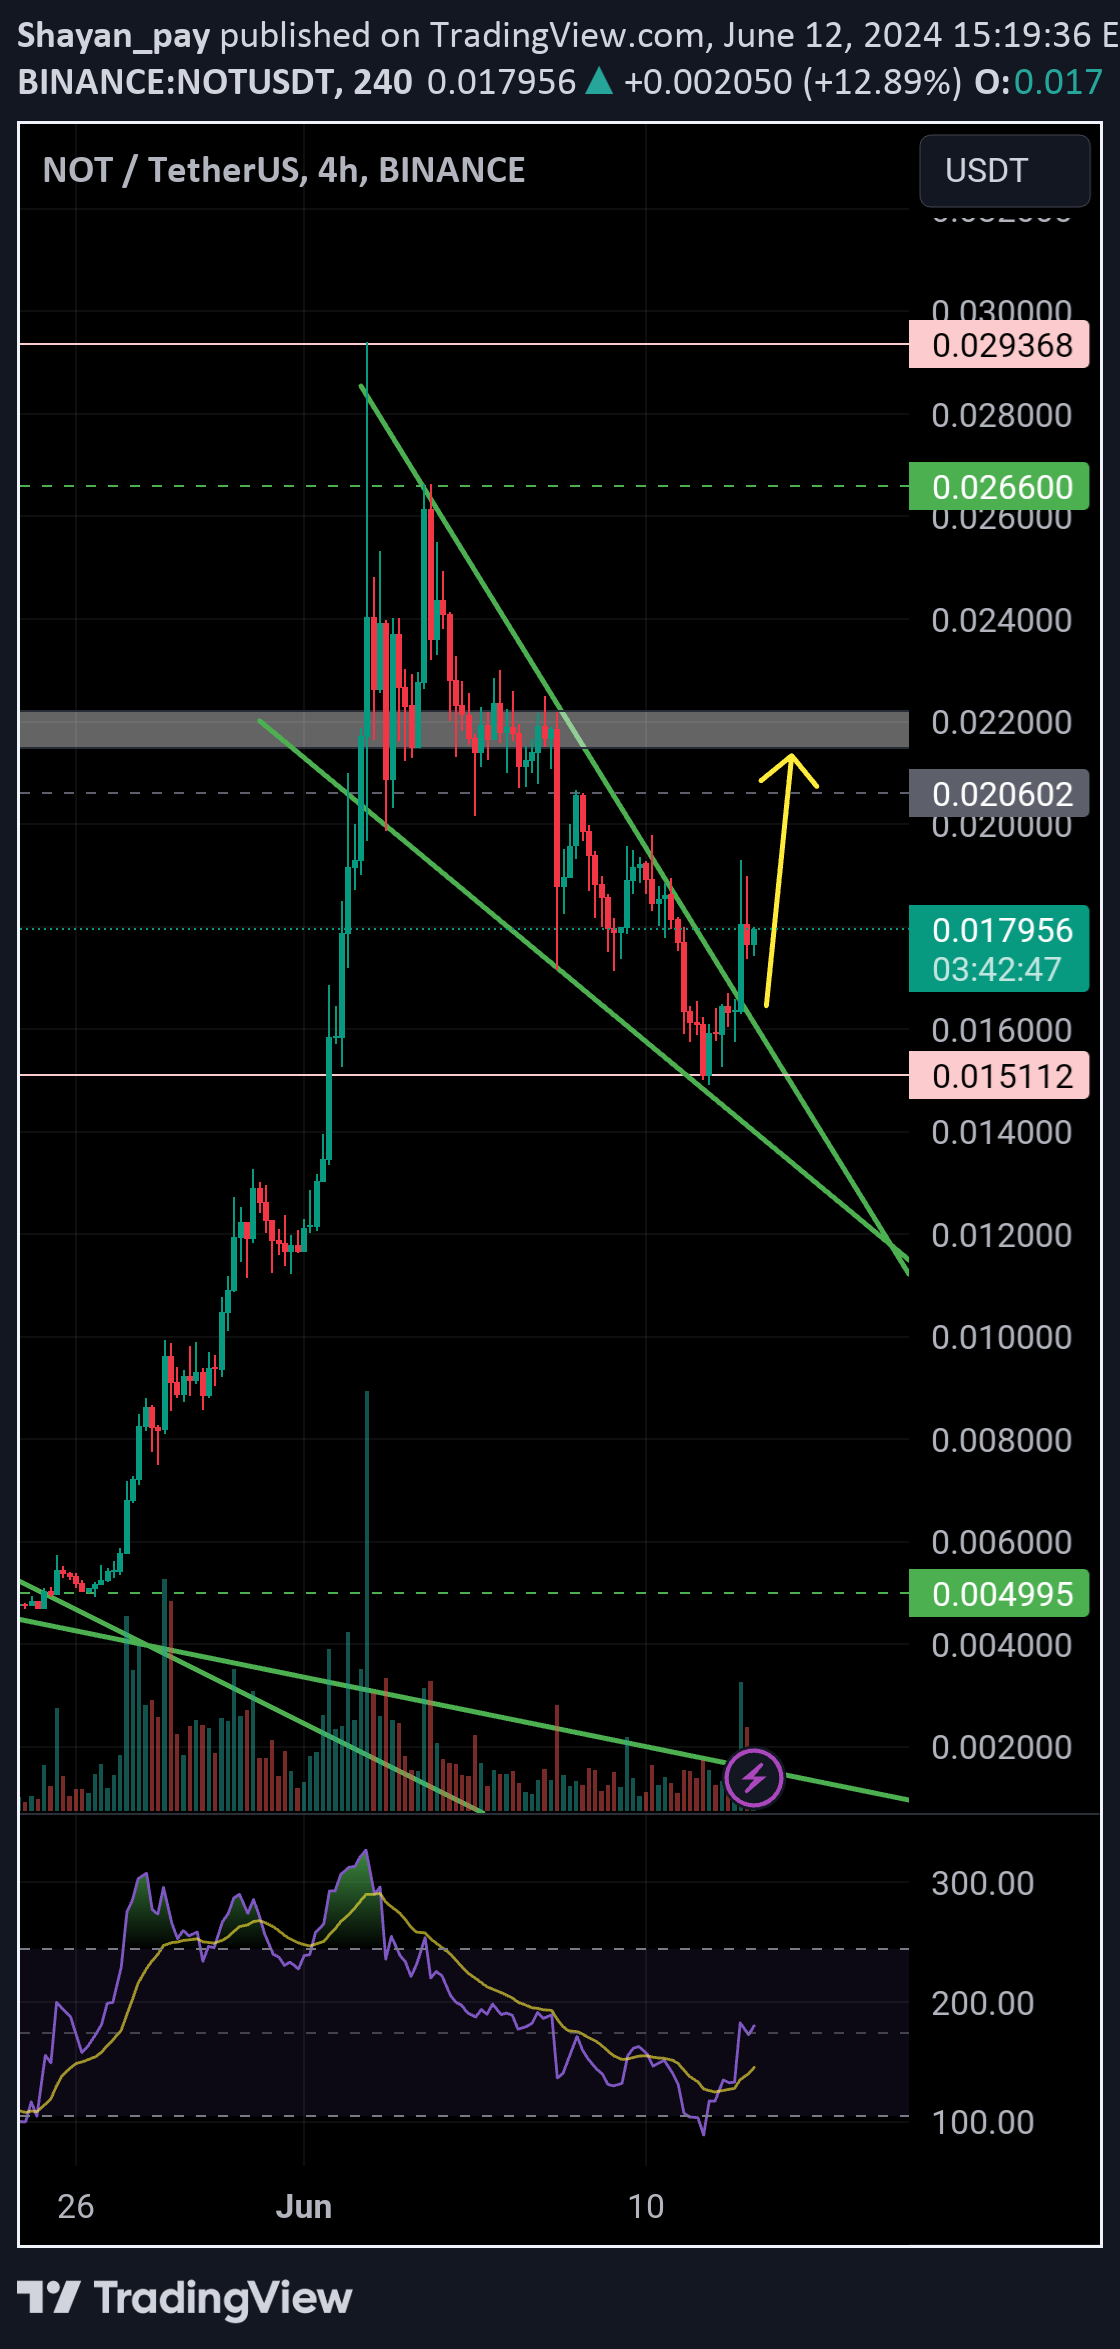
Not : H4 Falling wedge was broken with high volume First target: 0.02 Second target: 0.022
Shayan_pay
4 reasons why you should sell Near
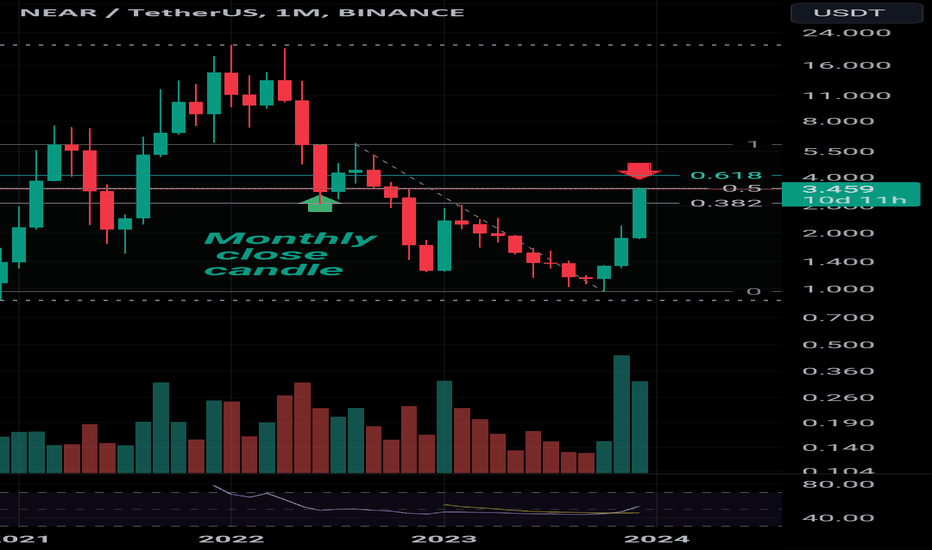
4 reasons why you should sell Near : 1.Dealing with monthly candle closes 2. Dealing with 50% Fibonacci of the previous weekly wave 3. Over bought 4. Hidden divergence in daily time Good luck 🍀
Shayan_pay
Gala's great potential to climb
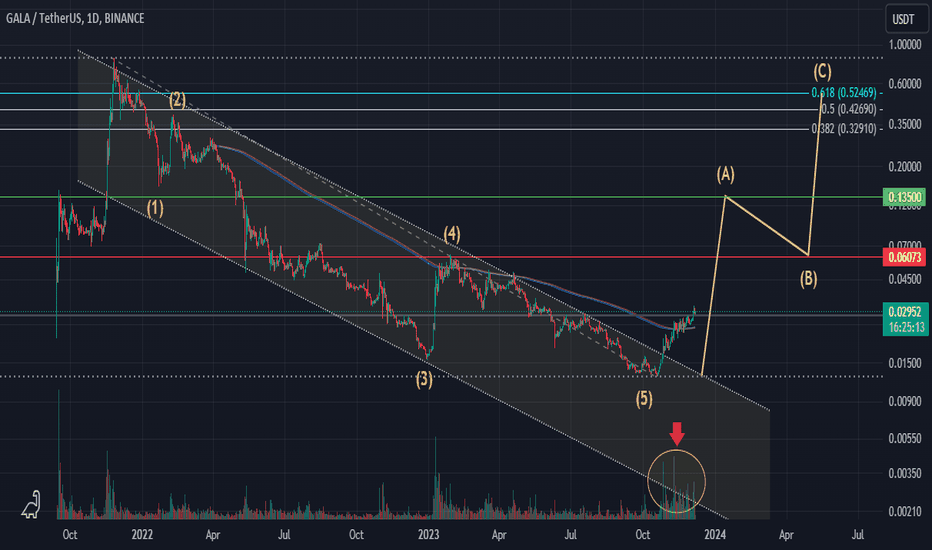
Gala currency has a lot of potential to rise, currently the downtrend channel has been broken and the price has crossed its moving 200 with a relatively high volume in daily timeframe and the resistance of 0.028 has been broken. After completing its 5 bearish waves, Gala has entered the upward correction wave ABC. I expect that in the first step to complete wave A, the price will rise to 161% of the previous small wave, around 0.135 . The ultimate target is the 61% Fibonachi of the previous big bearish wave (0.52$) Of course, the future of the market is in the hands of big buyers, and this prediction will come true if the dominance of altcoins (Others.D), increases and Bitcoin does not fall sharply.
Shayan_pay
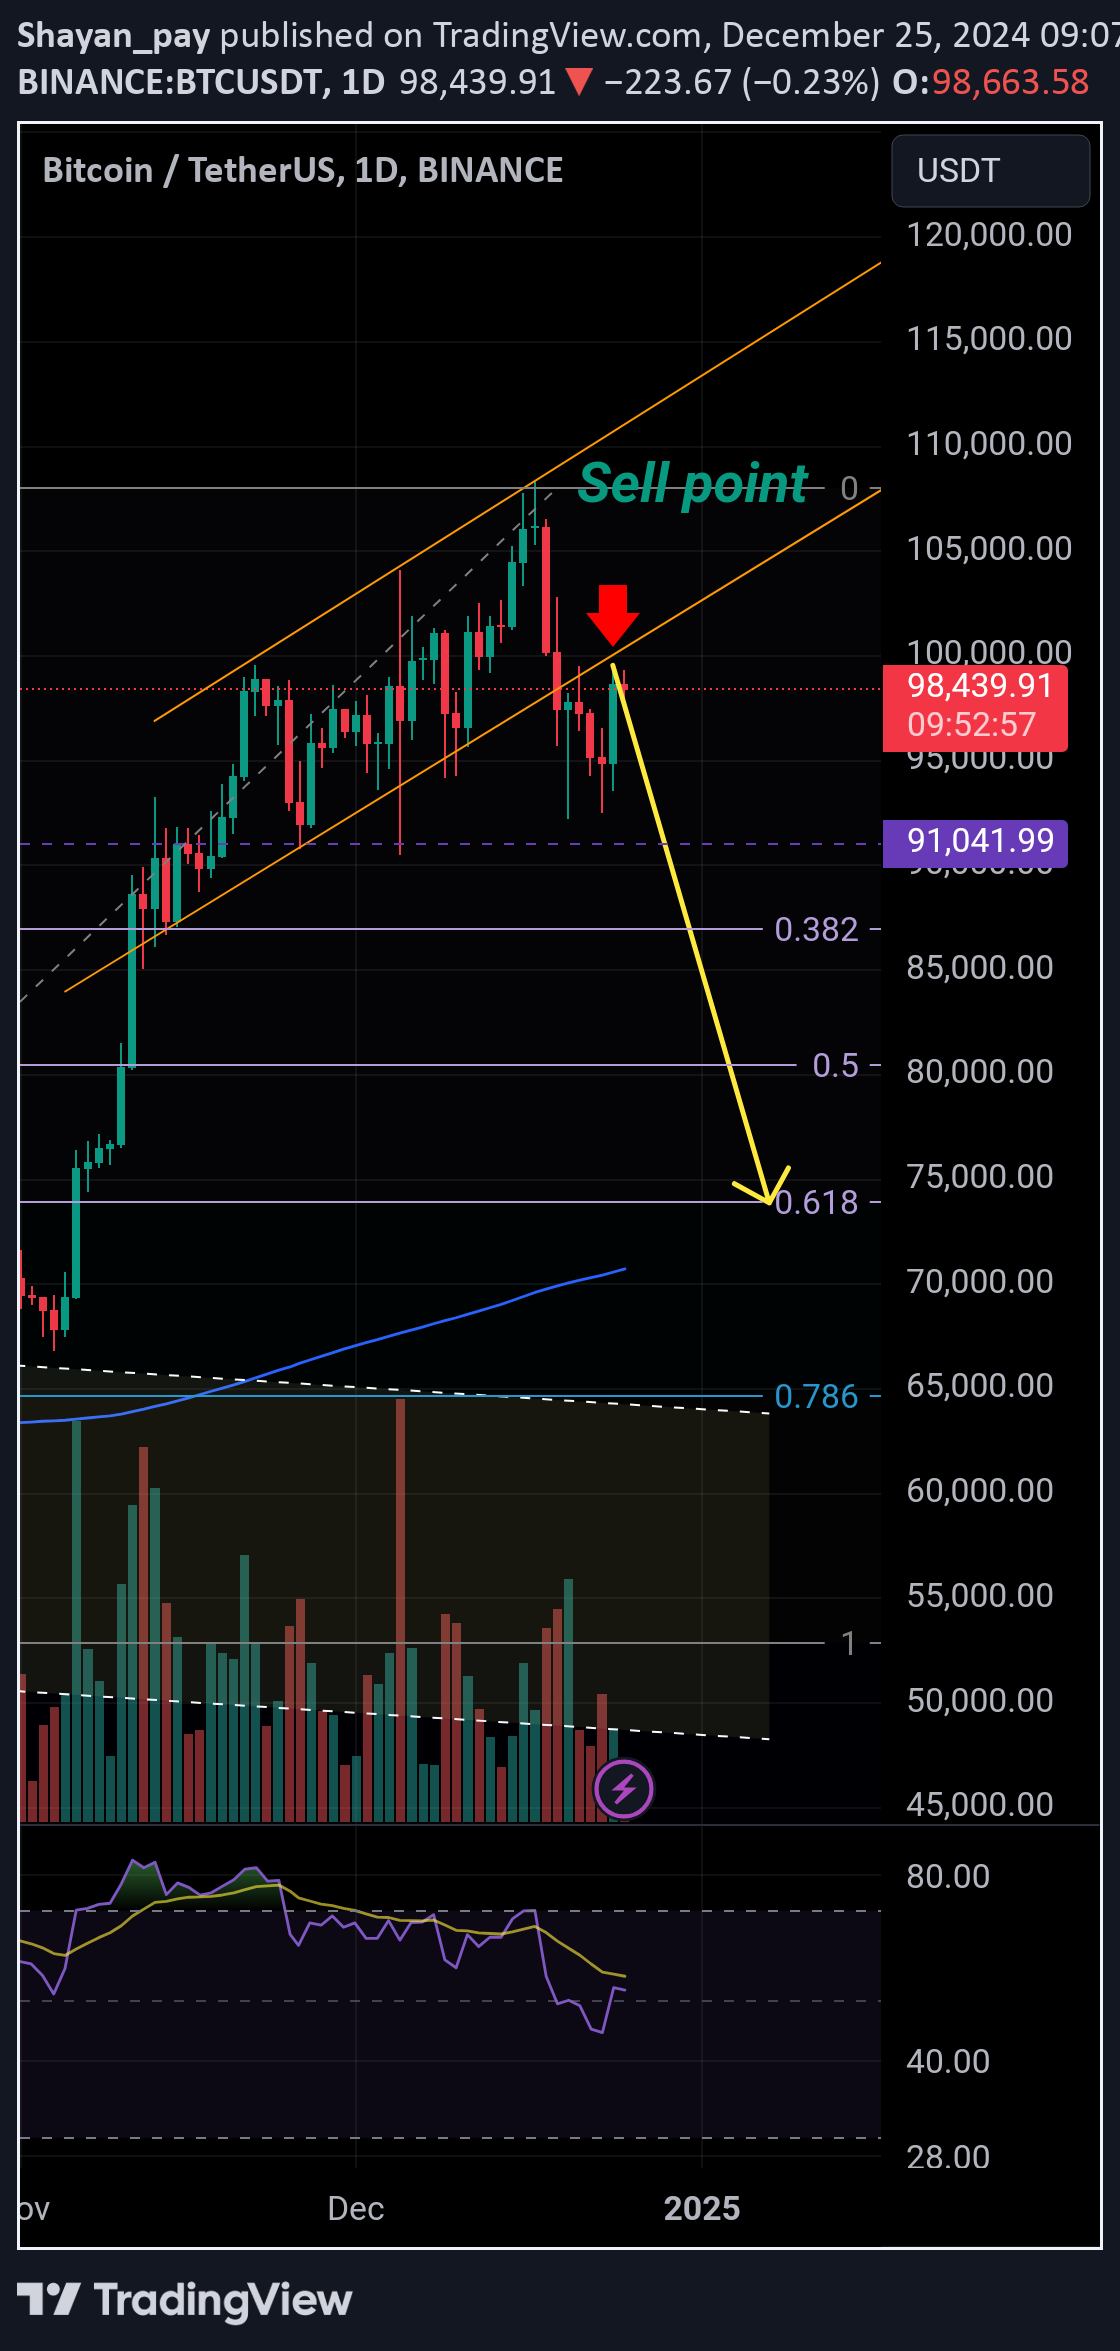
Five reasons why Bitcoin is approaching its sell zone
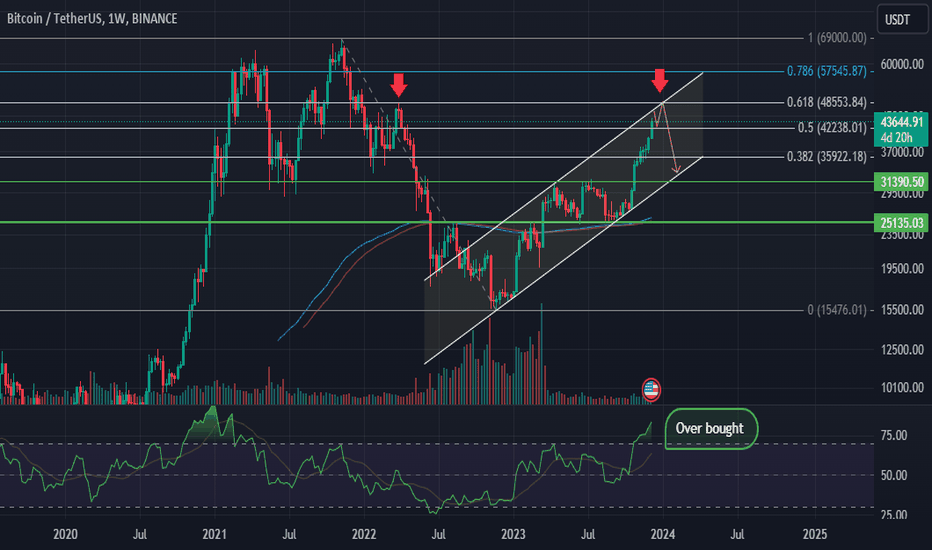
Five reasons why Bitcoin is approaching its sell zone: 1- Dealing with the upper edge of the ascending channel 2- Dealing with the 61.8% fibo of the previous big downtrend wave 3- The RSI indicator is overbought 4- We have hidden divergence in daily time. 5- The volume has decreased drastically. The best area for selling is around the price of 48,000. The target should be the lower edge of the channel. *** Please support me with likes and comments. I am waiting for your comments. You write the following reasons ...
Shayan_pay
ZRX : weekly dynamic trend line was broken
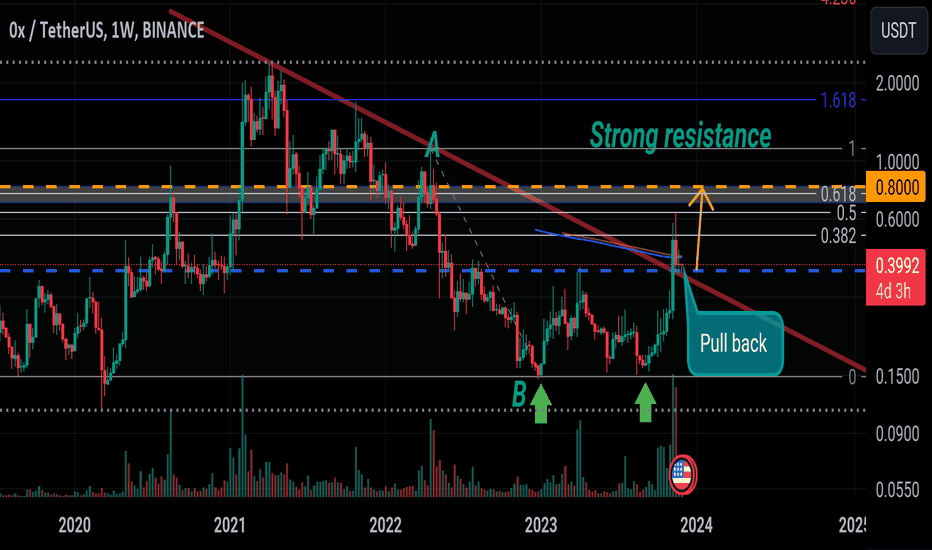
Hello friends zrx is moving up strongly and has broken its weekly dynamic trend line with high volume and has now pulled back into it and is a very good area to buy. If we draw a Fibonacci from the last previous bearish wave (top A to bottom B), our upside target will be the 61.8% Fibo, which overlaps with the support line that the price fell after breaking. This line has become a strong resistance.
Shayan_pay
Weekly dynamic trend line is broken
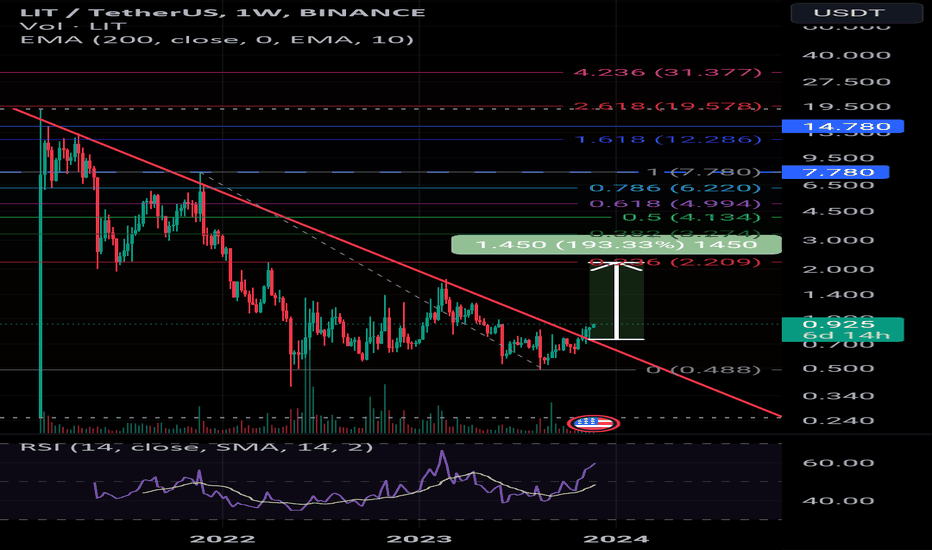
weekly dynamic trend line is broken First target: 23% fibo (2.2 $ | 138% profit) Best point to buy
Disclaimer
Any content and materials included in Sahmeto's website and official communication channels are a compilation of personal opinions and analyses and are not binding. They do not constitute any recommendation for buying, selling, entering or exiting the stock market and cryptocurrency market. Also, all news and analyses included in the website and channels are merely republished information from official and unofficial domestic and foreign sources, and it is obvious that users of the said content are responsible for following up and ensuring the authenticity and accuracy of the materials. Therefore, while disclaiming responsibility, it is declared that the responsibility for any decision-making, action, and potential profit and loss in the capital market and cryptocurrency market lies with the trader.