
Shavyfxhub
@t_Shavyfxhub

What symbols does the trader recommend buying?
Purchase History
پیام های تریدر
Filter
Shavyfxhub
GOLD XAUUSD 15MIN CHART
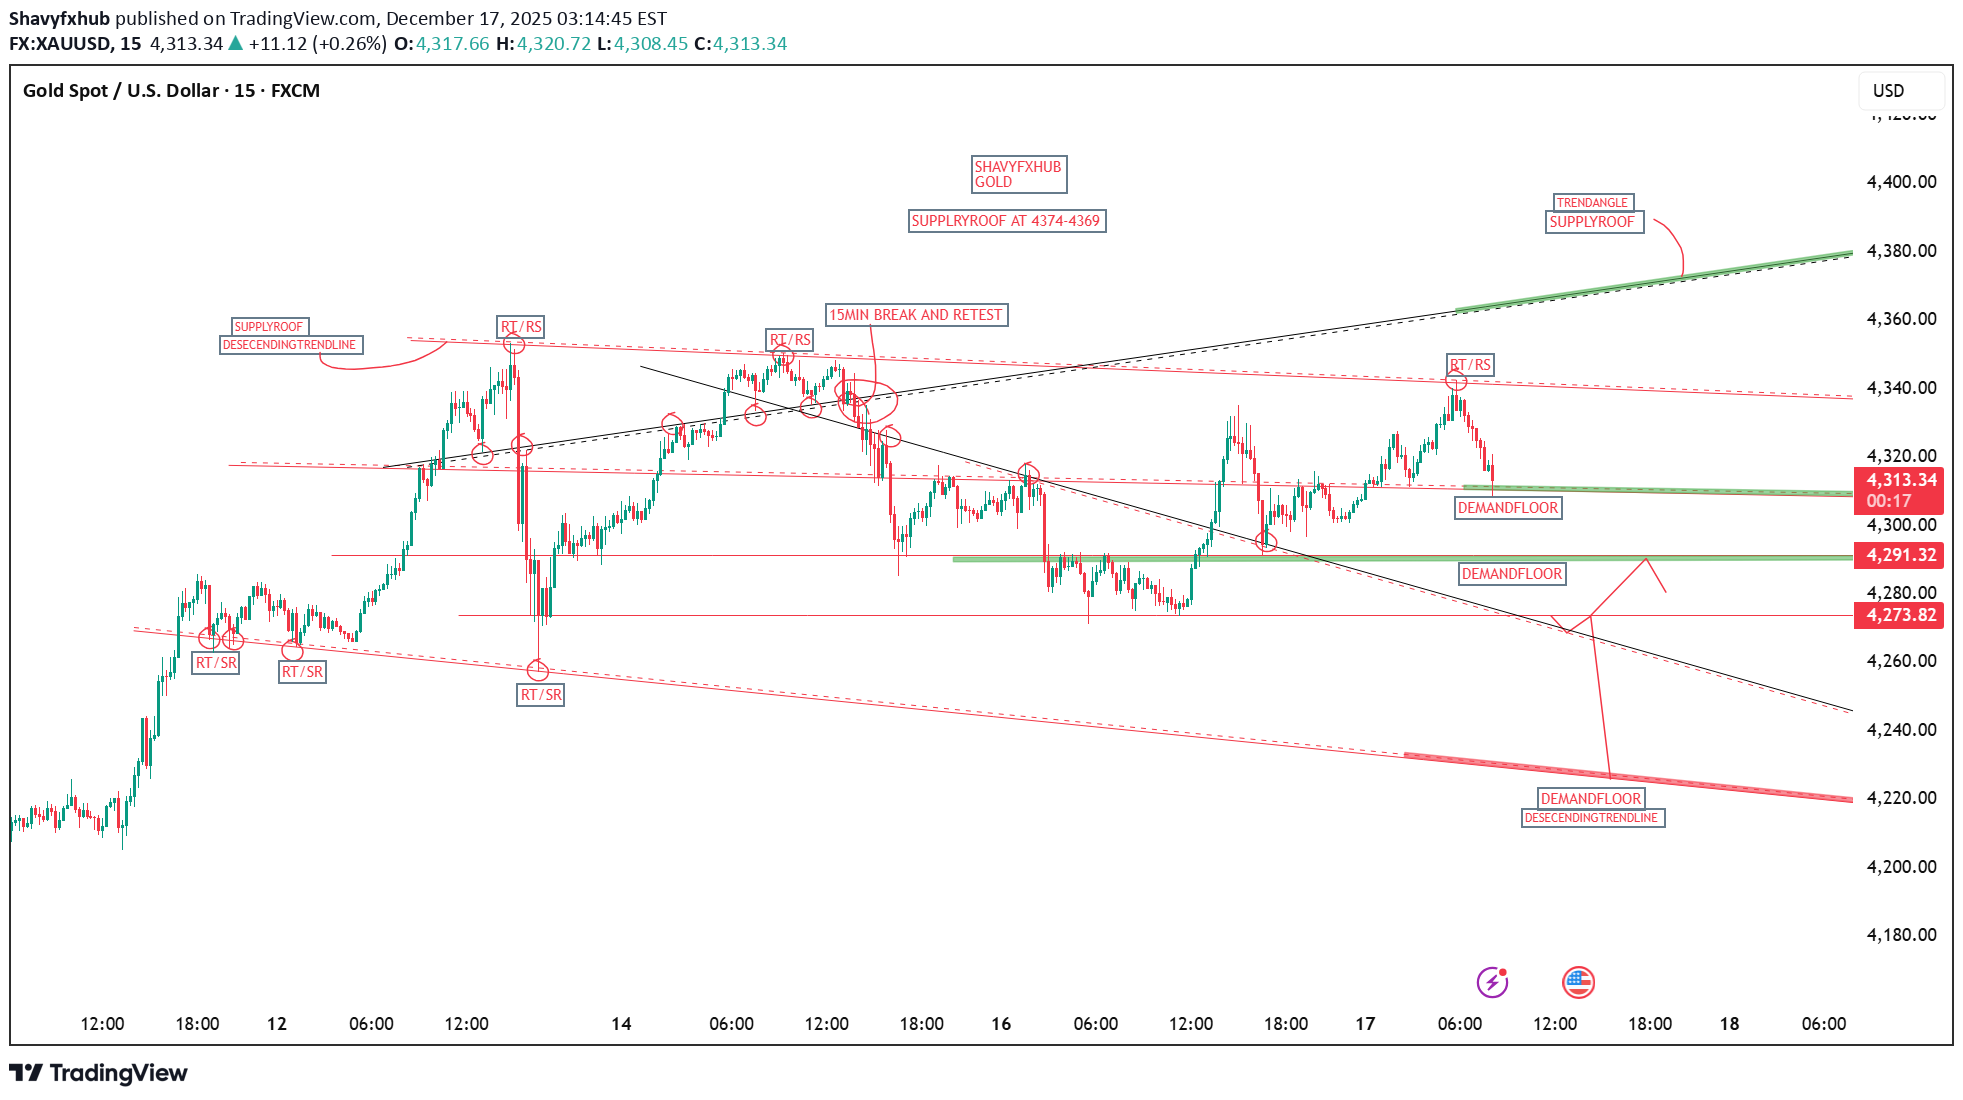
GOLD ,as the year comes to an end ,buyers are cautious ,and we might be watching and scalping positions based on price action. key demand floor will be 4311-4309 key demand floor 4291-4285 key demand floor 4271-4265 key demand floor 4226-4220 KEY SUPPLY ROOF 4374-4368 trading is probability manage your risk. GOODLUCK
Shavyfxhub
GOLD XAUUSD
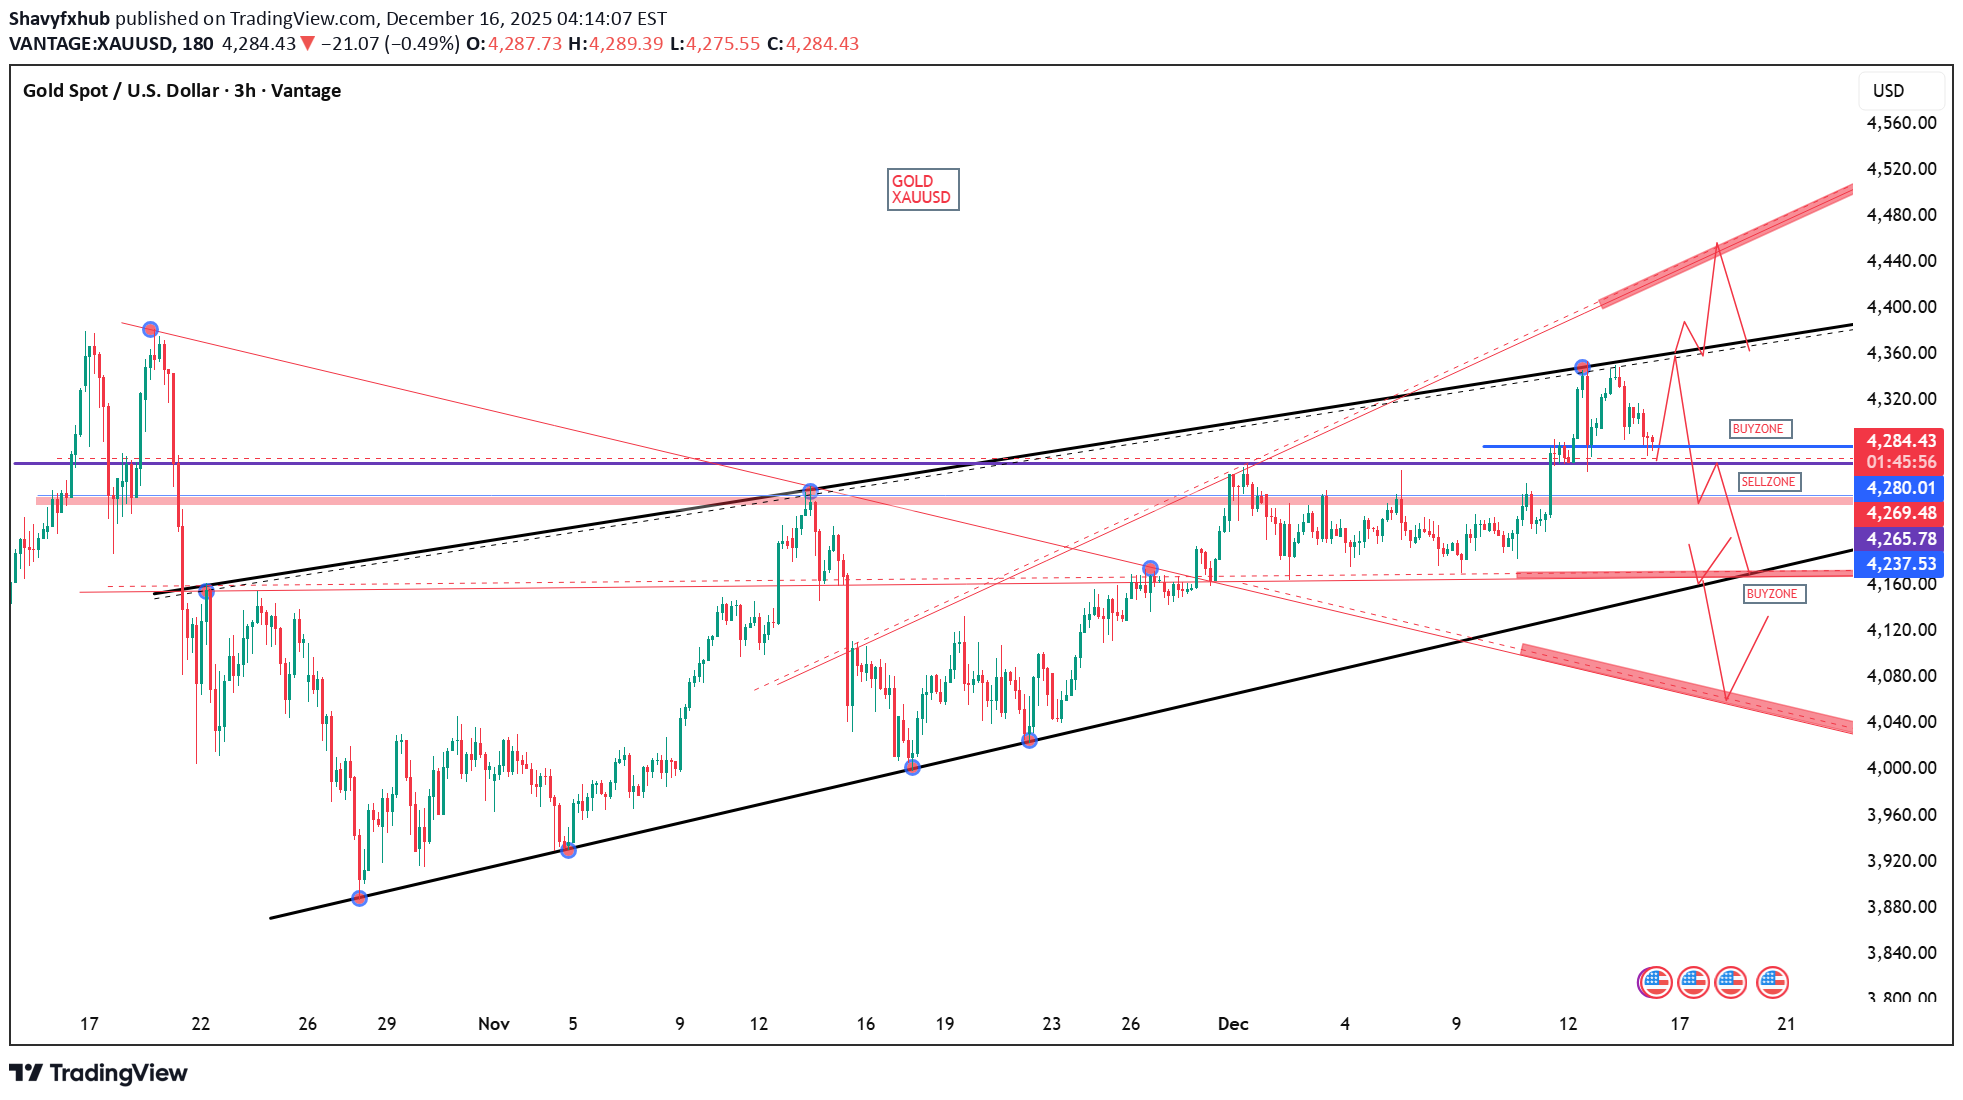
DIFFERENT CHART ON PRICE ACTION. We are watching 4280-4285 demand floor ,if we have any 3hr/4hr close below this level, then the next floor will be a retest of 4265-4255 zone and the break and close of this zone will be 4174-4178 zone as possible demand floor based on price movement and structure. my goal is to see the demand floor of the bullish channel updated at 4150-4155 just like we updated the supply roof of the bullish channel this week in the zone 4360-4350 zone and sold off respectively . GOODLUCK.
Shavyfxhub
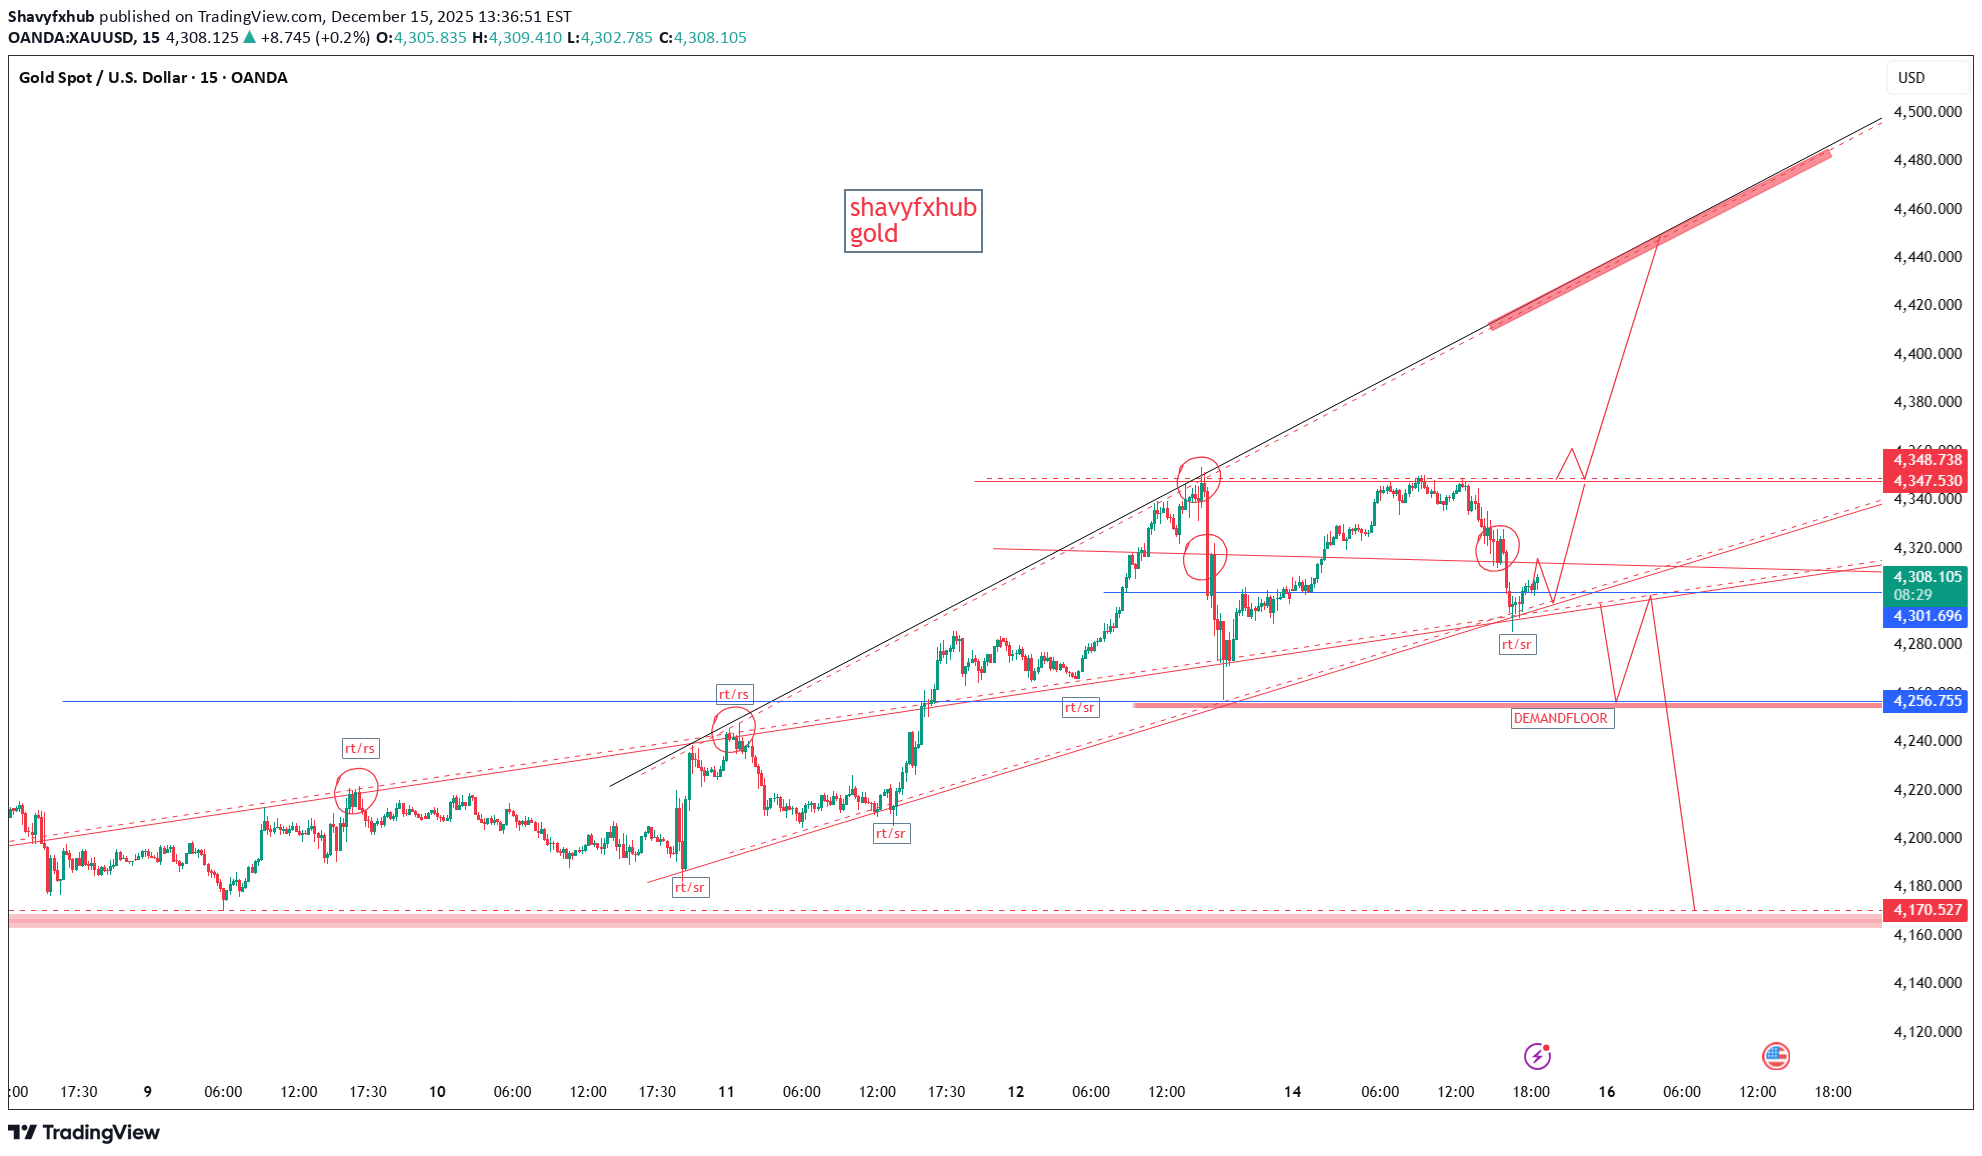
GOLD XAUUSD
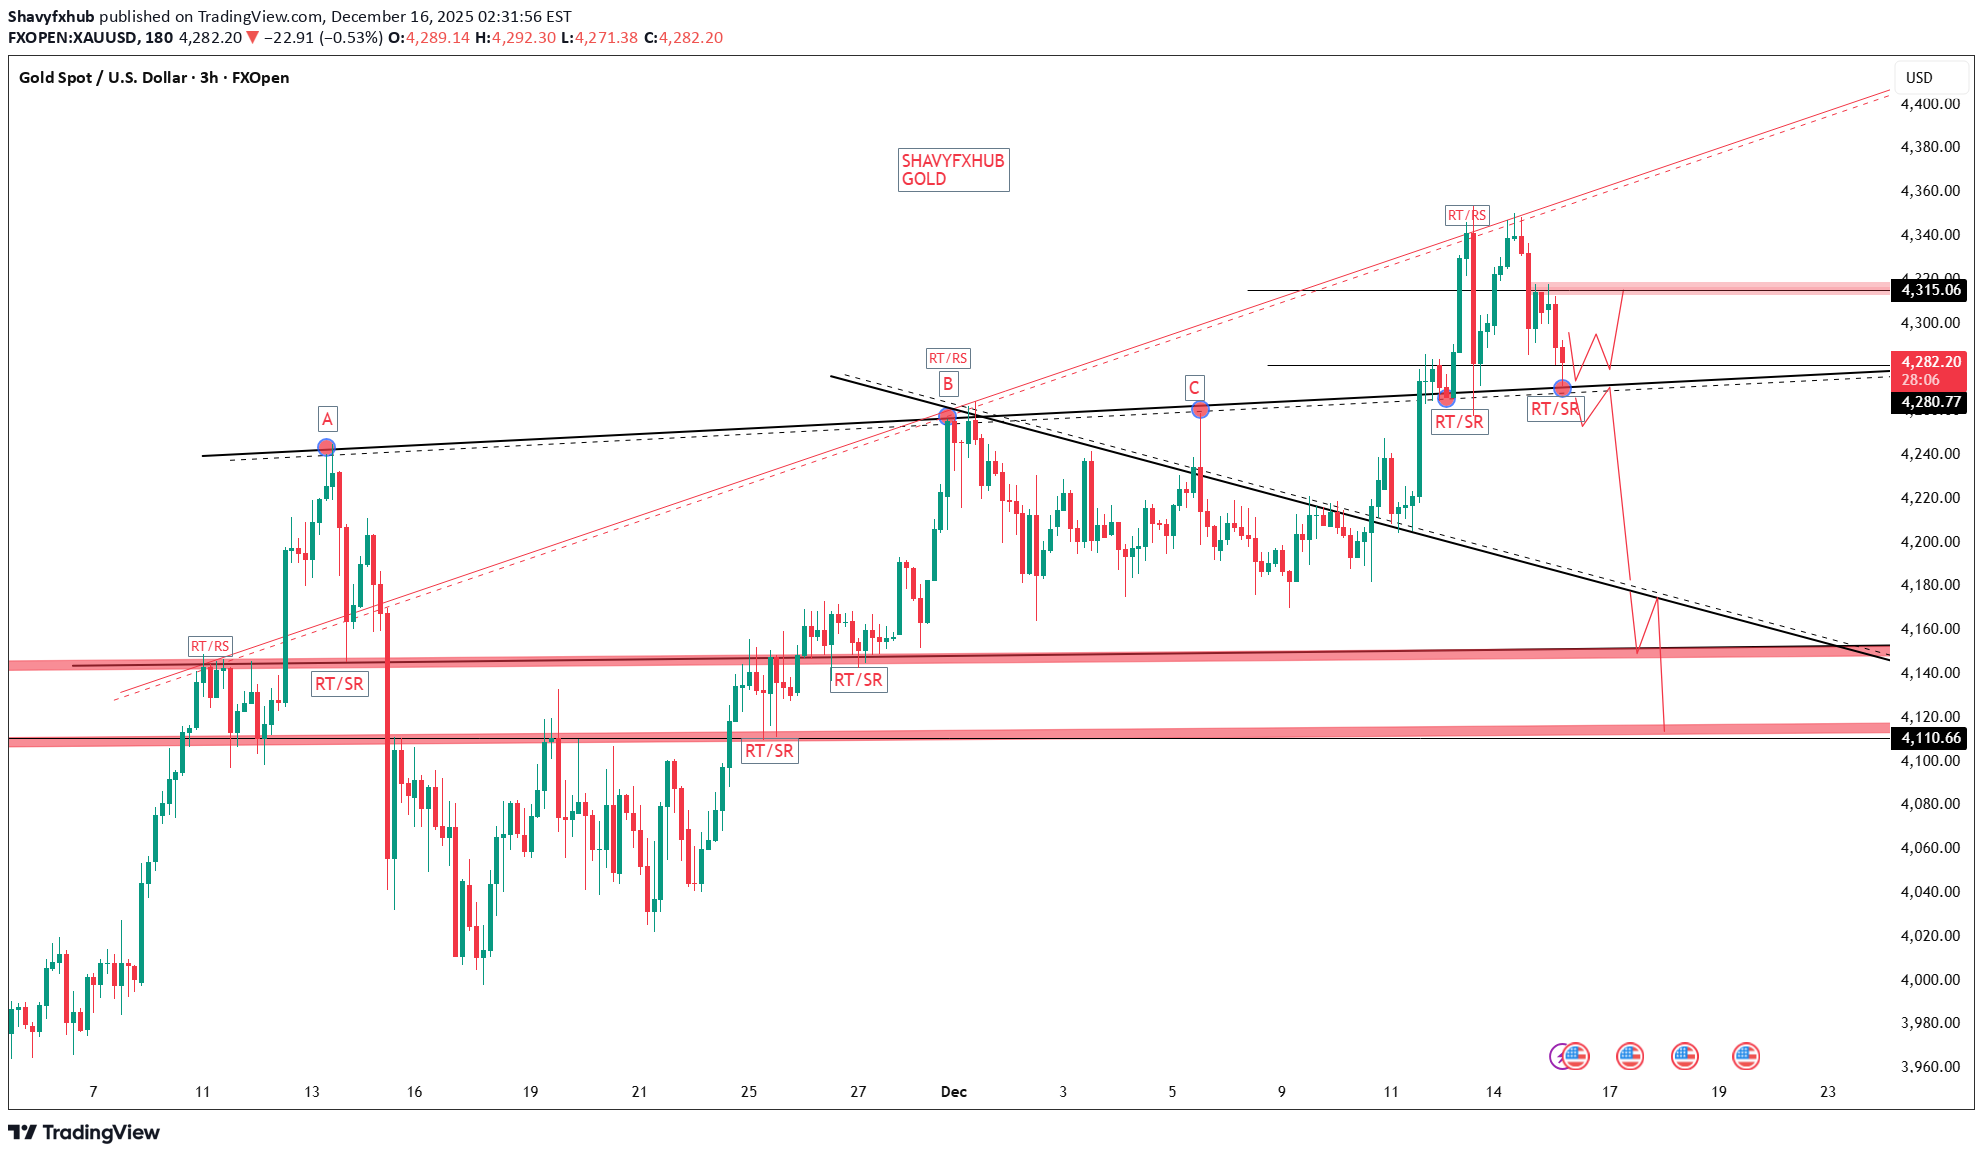
GOLD ,the London market is watched for potential reaction, if we fail to bridge 4300 and keep attempting below 4300, then the demand floor at 4266-4258 will be watched on 4hr/3hr break and close using my line chart close perspective as litmus test. . the reason is that on intraday day my litmus test for break of structure is on 3r/4hrs.if we break below 4266-4258 on 4hr/3rs then i will consider it a clear break out of the trendline ABC as illustrated on the chart , i will look for sell on the retest of a broken support structure and target 4180-4185 zone ,more aggressive sell profit will be around 4100 zone . i trade zone to zone ,layer to layer. if the current structure breaks out of buy zone, am looking for sell ,this strategy works over 80% of the times. GOODLUCK. #GOLD #XAUUSD4280-4285 is a buy watch zone .
Shavyfxhub
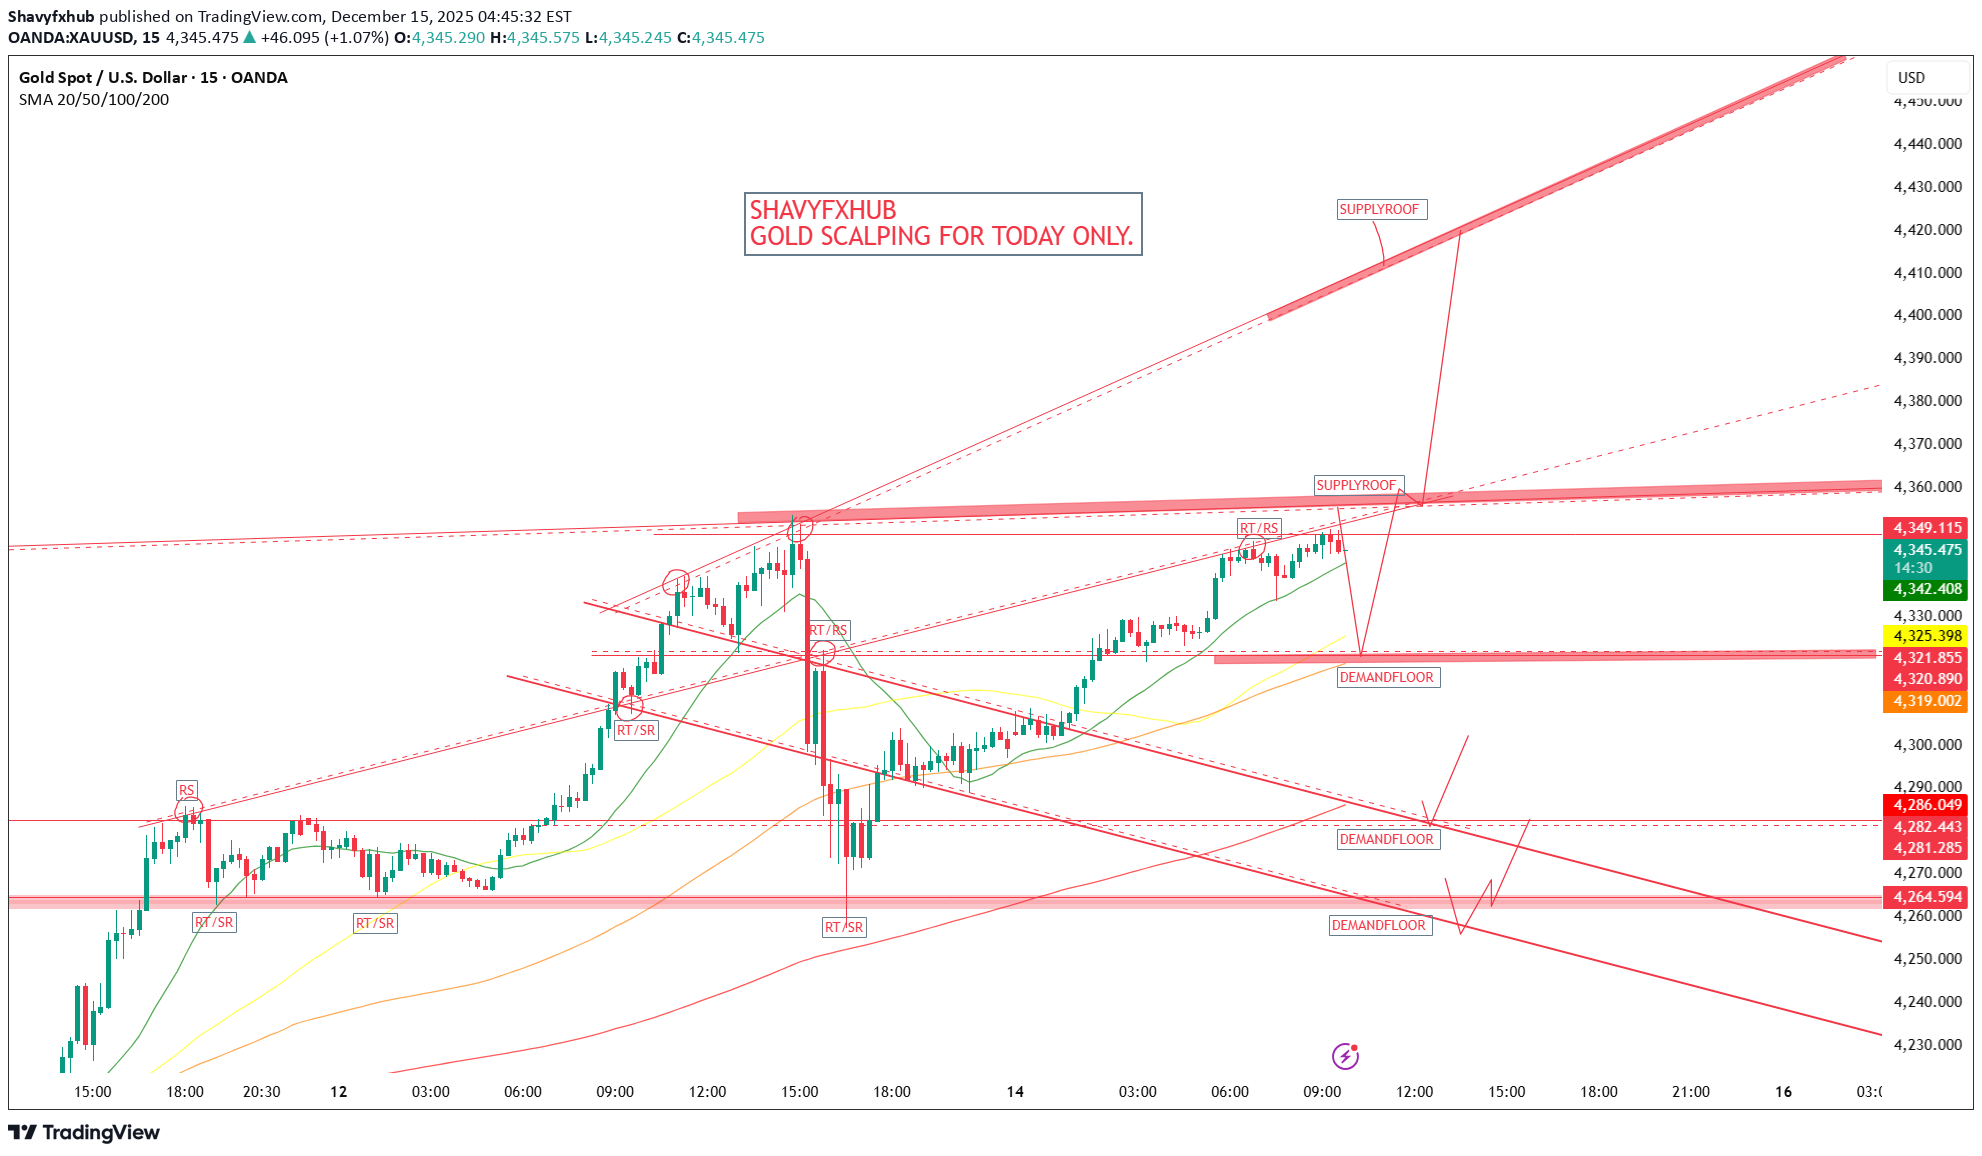
GOLD XAUUSD
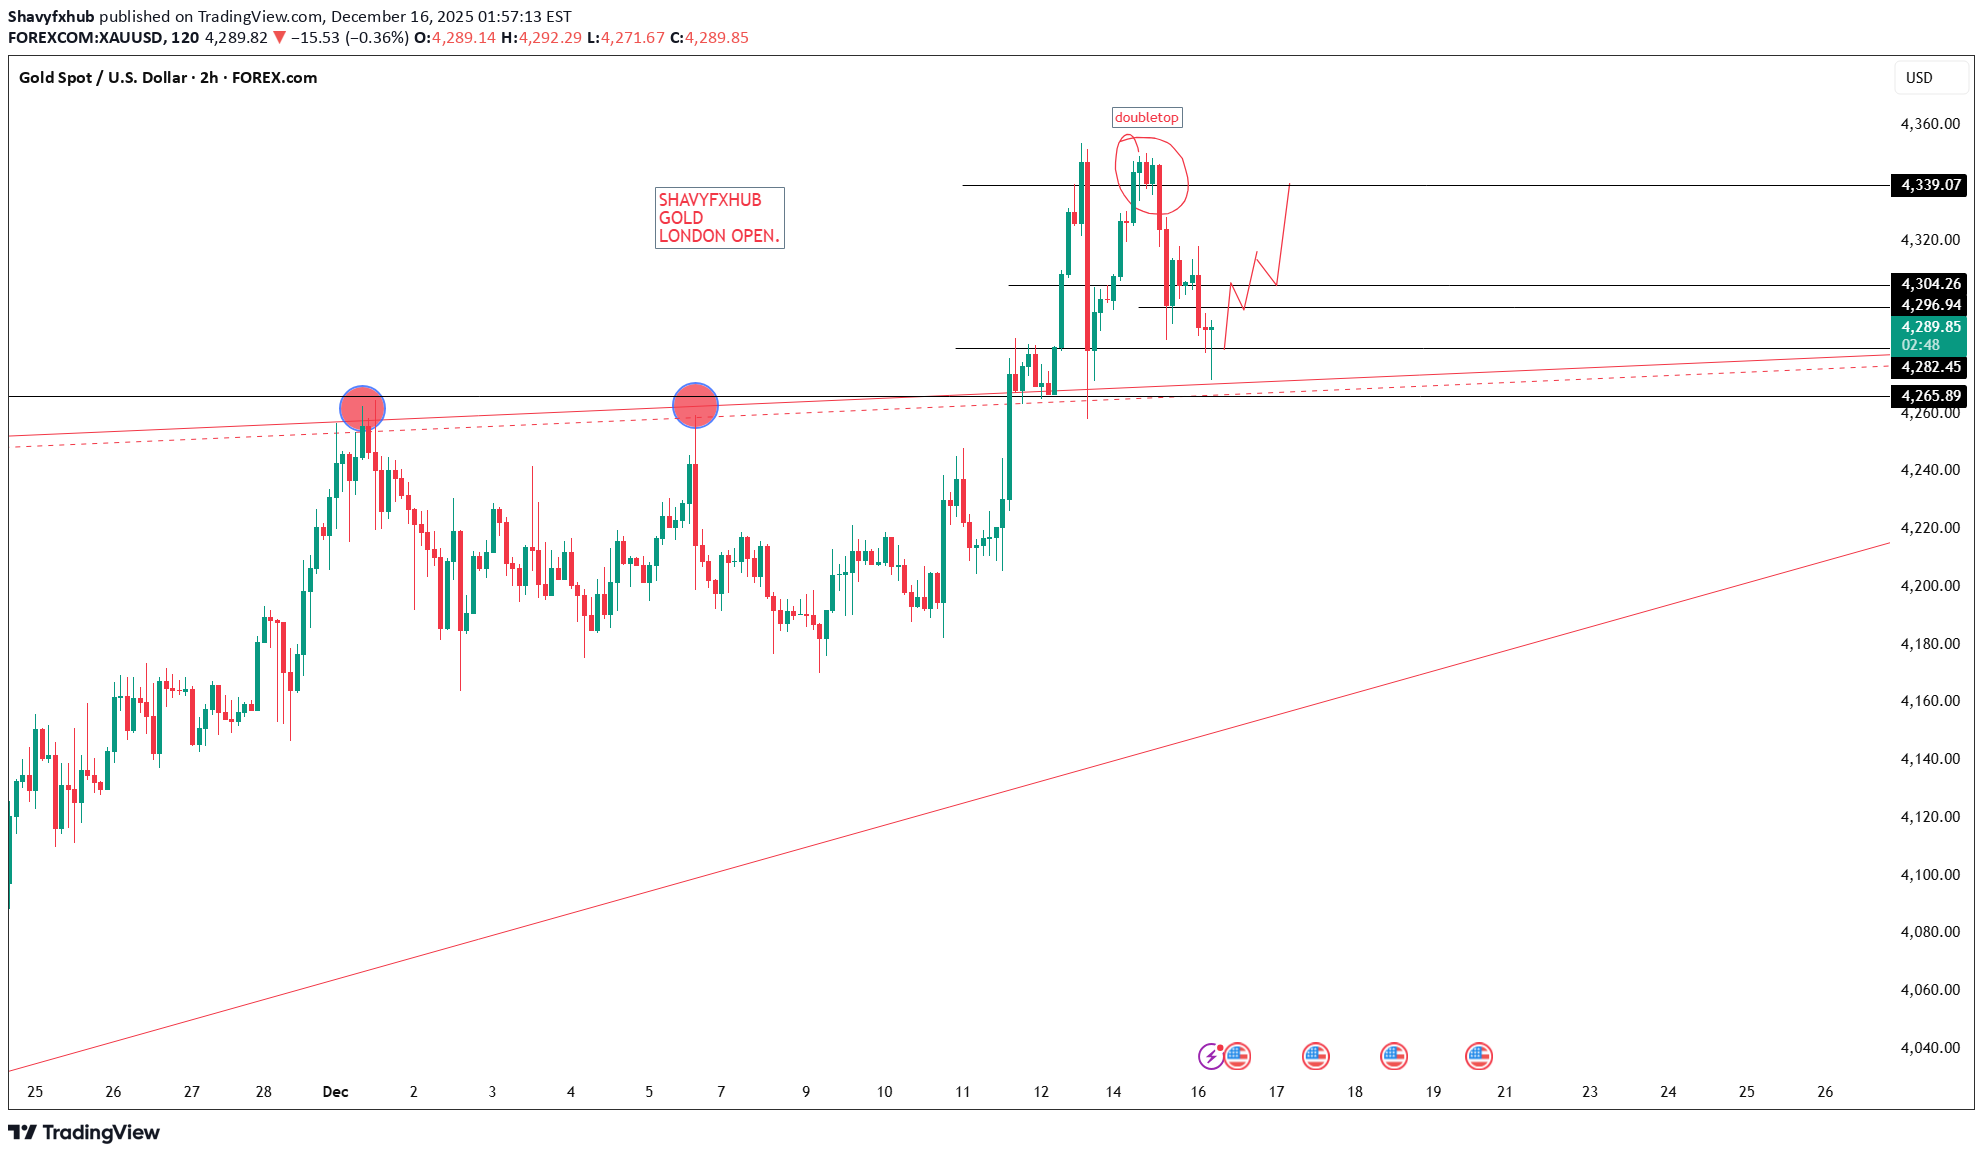
GOLD ,the structure is still bullish but a break out of the current support structure will call for sell. am watching demandfloor at 4265-4255.break and close below this level switch to 15min and follow the pattern of of buy and sell . if we update above 4300 then i will hold buy position ,below 4300 i stay cautious of possible selloff. GOODLUCK
Shavyfxhub
GOLD XAUUSD
GOLD 4285-4283 aggressive buy zone activated and the price is still in up trend ,NEWYORK rejected buy today at 4349 on 15min close from our line chart structure as illustrated . if buyers break out of today supply roof 4349-4350 ,then we will retest the current all time high and might top a new high. GOODLUCK
Shavyfxhub
پیشبینی طلا (XAUUSD): آیا سقف تاریخی جدیدی در راه است؟ (تحلیل تکنیکال روزانه)
GOLD opens on massive buy after the retest of a broken supply roof and 4350-4348 looks like a resistance but my aim is to see the retest of Friday high 4360-4358 and sell down into 4320-4315 intraday support floor ,a more aggressive correction will be 4280-4277.overall bias remains bullish till we break out of 4255-4260 on 4HR chart and line chart close strategy. GOLD WILL TOP A NEW ALL TIME HIGH 4444-4500,if we keep to trend. GOODLUCK
Shavyfxhub
تحلیل تکنیکال بیت کوین: آیا سقوط به زیر 70 هزار دلار در راه است؟
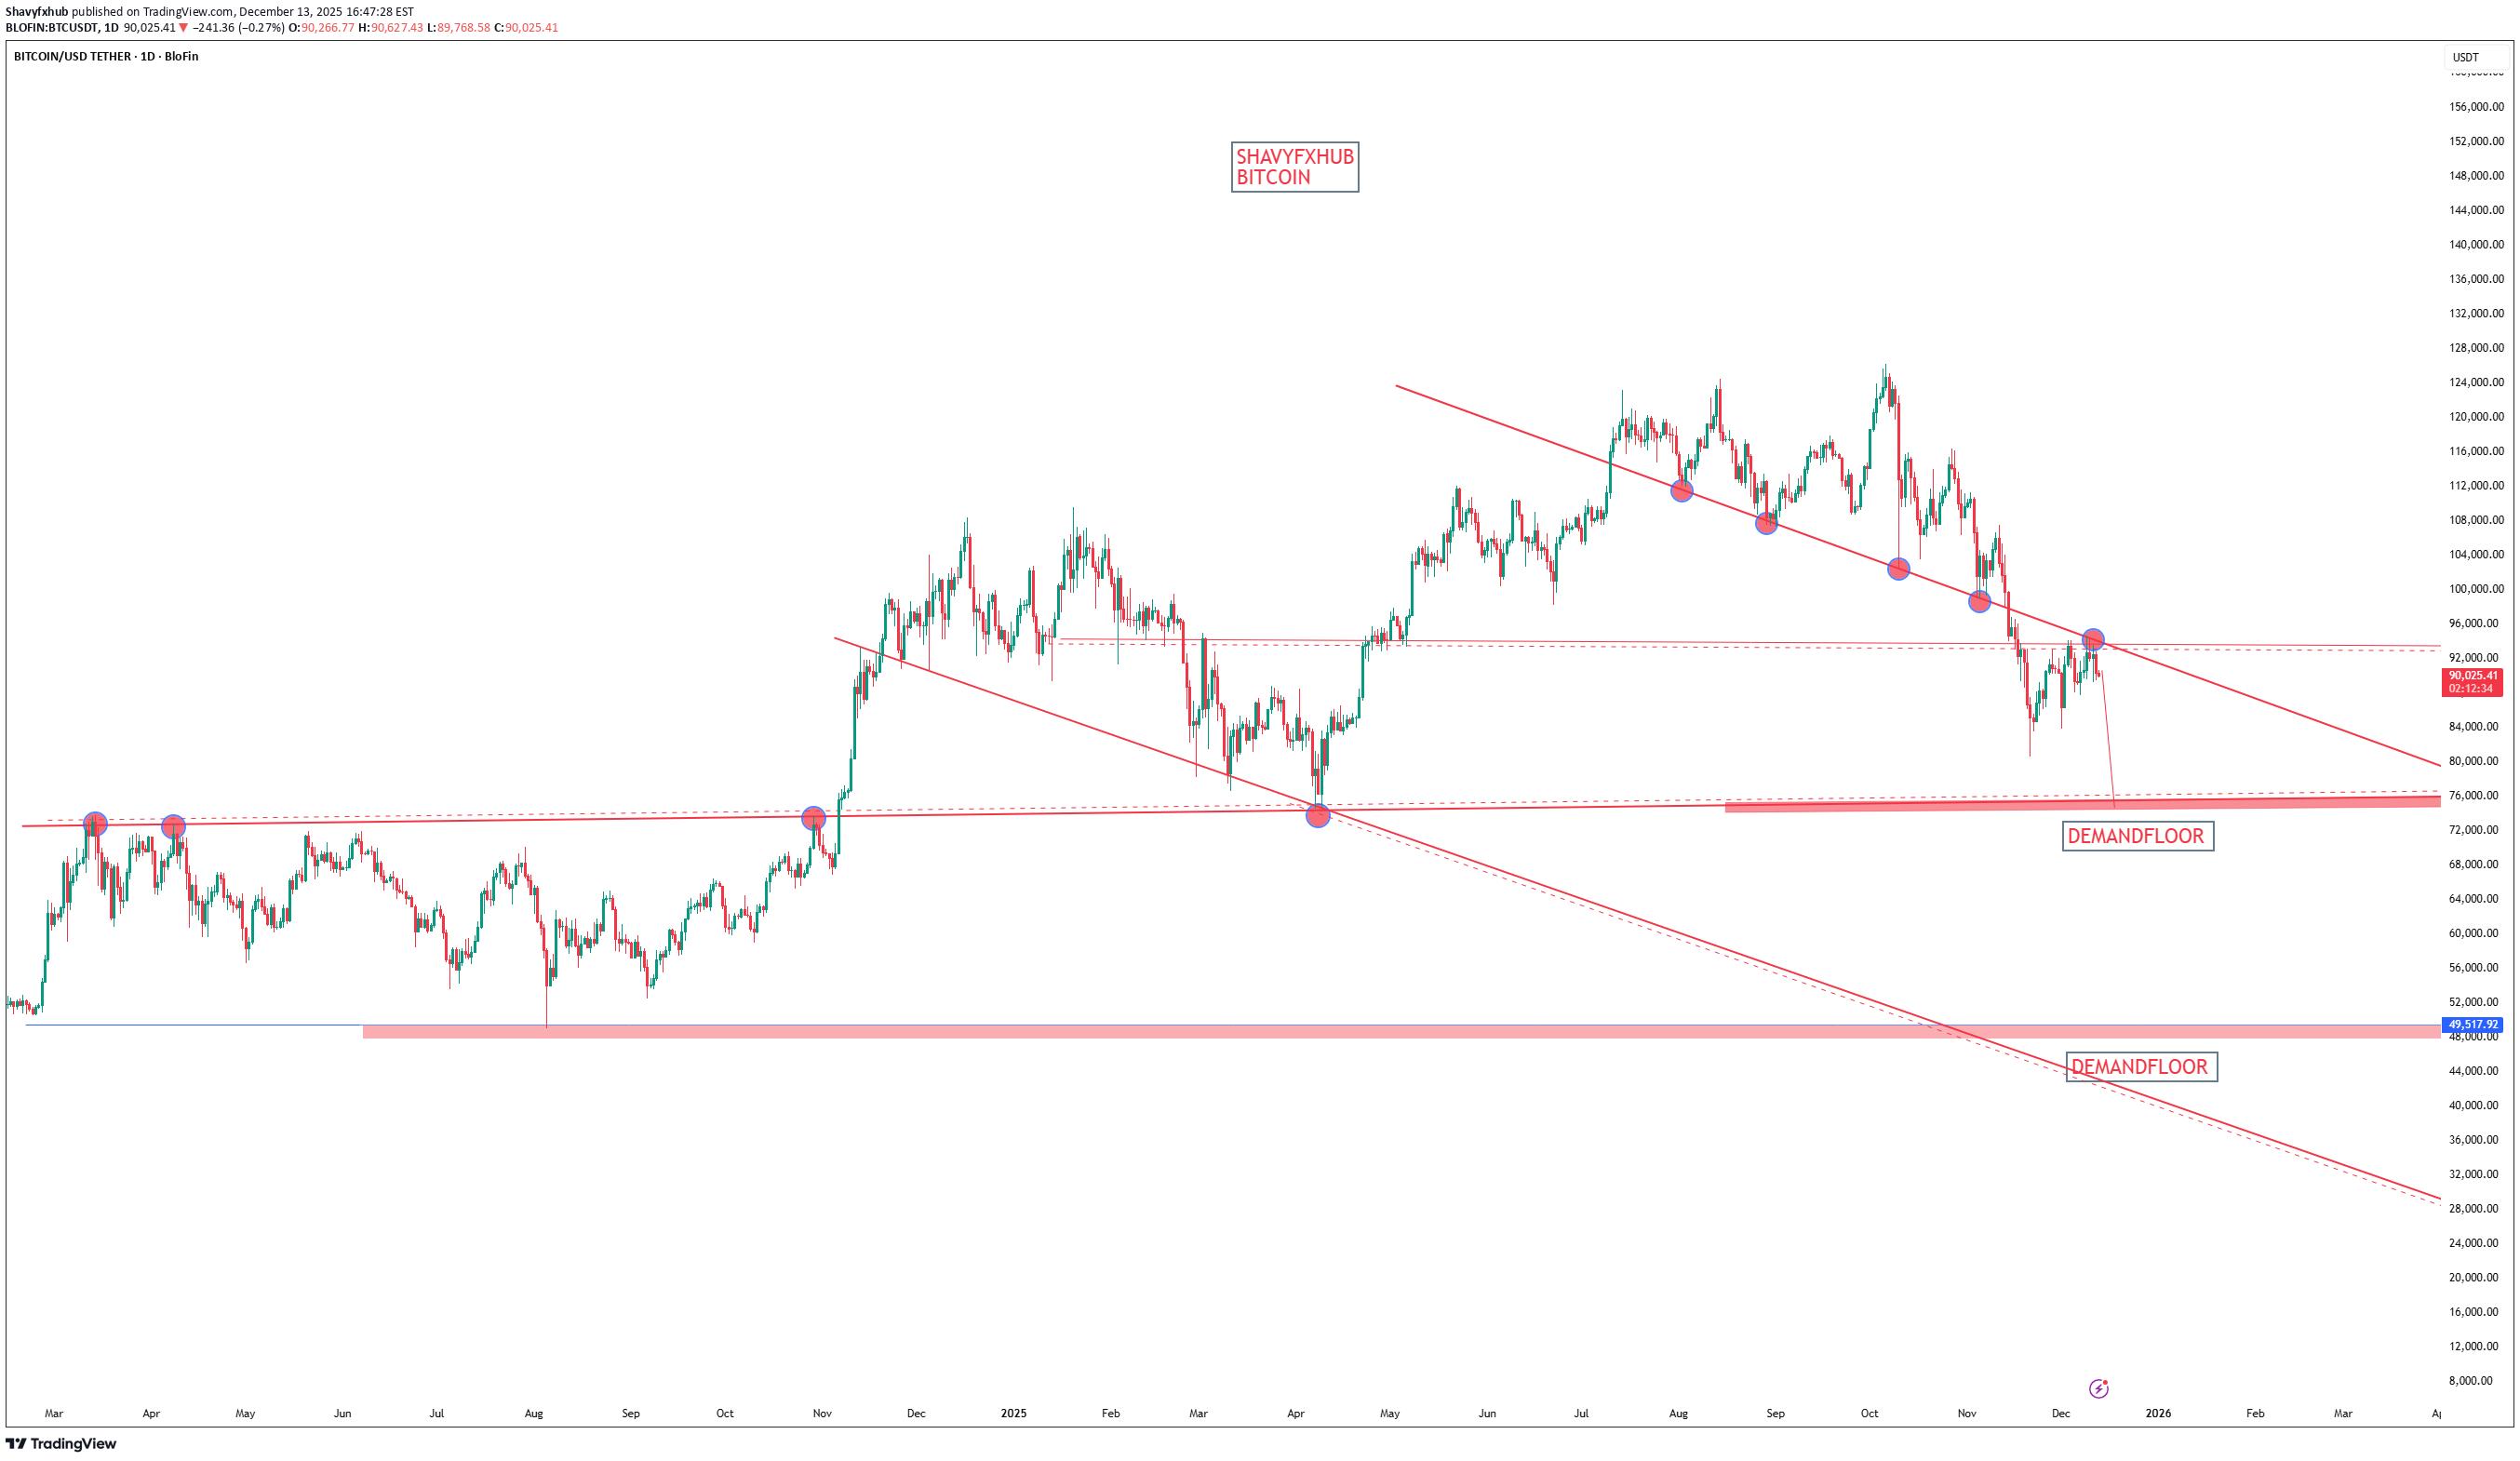
THE crypto market is looking for more selloff,the structure indicates more sell. buyers have failed to cross a key weekly resistance which will call for the next demand floor 75k-70k zone . tomorrow will validate the analysis ,as i expect the weekly candle to close in massive selloff. GOODLUCK.sell analysis correct and running as illustrated on the chart.
Shavyfxhub
پیشبینی هفتگی سولانا (SOL): ریزش احتمالی یا جهش بزرگ؟ تحلیل ساختار بازار

SOLONA current price =142.50$ Solona is about to experience a drop in price based on structure of the market ,the price rejection of 295.95 in January on weekly time frame was a classic reaction on the the weekly ascending trendline that doubles as the neckline of the head and shoulder pattern and it wont go down without a significant sell off to reset the market after the at all time high rejection at 295.95 .the weekly candle came back on a psychological horizontal trendline and rejected again at 251.800$ zone on weekly time frame and trigger sell order which break above will be a buy confirmation with target exceeding 350$ is possible . buyers will have show that they have the much needed liquidity to keep price at the current support zone ,otherwise break and close 131.94$ as illustrated on the chart on weekly TF will find support at 78.47-72.9$ zone FOMO, this habit makes a lot traders close position or open position, if we retest the 78.47-72.95 zone ,many traders might shot into discount liquidity traps which could likely be in the zone of 28.81-15.83$ zone . the trade directional bias remains bullish but i believe that if we respect the current demand floor and buy into 189.04 supply roof which double as a broken demand floor to become our current supply roof ,i will look for sell opportunity from that zone and hold till 78.47-72.8$ zone and aggressive sell off could extend into 28.81-15.83 zone . SOLANA FUNDAMENTAL . Solana (SOL) is a high-performance blockchain platform known for its scalability, fast transactional speeds, and low fees, making it popular for decentralized applications (dApps), DeFi, NFTs, and Web3 projects. It uses a unique Proof of History (PoH) consensus mechanism combined with Proof of Stake (PoS) to achieve high throughput, often exceeding thousands of transactions per second. solana High scalability and low latency enable extensive adoption in gaming, decentralized finance, and NFT marketplaces. the active developer community with a growing adoption of layer 1 and layer 2 solution the planed network upgrades will double its space and boot the capacity and ecosytem growth Major Shareholders Pushing for Solana ETF: Several institutional investors and asset managers hold significant shares in Solana ETFs, including: Heck Capital Advisors LLC Tactive Advisors LLC Militia Capital Partners LP Brighton Jones LLC These firms actively support Solana exposure through ETFs, boosting institutional interest and liquidity. Solana ETF Approval Outlook: The U.S. Securities and Exchange Commission (SEC) is in the final stages of reviewing multiple spot Solana ETF applications. Approval is widely expected imminently before the close of 2025 .if this happens it will become a major catalyst for growth Summary Solana is a fast, scalable blockchain driving innovation in DeFi, NFTs, and dApps, backed by a growing institutional investor base pushing for ETF adoption. Approval for spot Solana ETFs in the U.S. is highly likely by late 2025, which would be a significant growth driver. GOODLUCK.
Shavyfxhub
تحلیل تکنیکال و بنیادی بیت کوین: سطوح حیاتی حمایت و مقاومت BTC

BITCOIN ,the supply roof is around 101.7k-102k-103k.on daily time frame we had a strong daily break of demand floor and on technical ,we are calling for retest and the expected retest zone is likely to be around 101k-103k and bearish confirmation on 15min will be needed for sell order. the direction of BITCOIN price action has changed from our trading pattern. the next support could be around 74k-70k zone based on the structure . BITCOIN FUNDAMENTAL. Bitcoin is the world's first decentralized cryptocurrency, launched in 2009 by an unknown person or group using the pseudonym Satoshi Nakamoto. It allows peer-to-peer transactions without relying on banks or central authorities. Bitcoin transactions are recorded on a public ledger called the blockchain, which is maintained by a network of computers (miners) that validate and secure transactions through cryptographic proofs. What is Bitcoin? Bitcoin is a digital currency that enables secure and transparent transfers over the internet. Not owned or controlled by any single entity—it operates on a decentralized network. Uses blockchain technology to maintain a permanent, public transaction record. Supply is capped at 21 million coins, making it a scarce, deflationary asset. Network Security and Hash Rate: The computing power devoted to mining, indicating network strength and resilience. Transaction Volume and Adoption: Growth in users, wallets, and real-world usage reflect demand. Supply Schedule: Bitcoin’s issuance halves roughly every four years, reducing new supply and potentially driving scarcity. Institutional Interest: Investment flows from funds, corporations, and ETFs show confidence and liquidity. Regulatory Environment: Legal clarity or restrictions impact market sentiment. Macro Factors: Inflation trends, fiat currency strength, and geopolitical uncertainties influence Bitcoin as a store of value or risk asset. Summary Bitcoin is a decentralized digital currency secured by cryptography and maintained on a blockchain network. Its fundamentals include the network’s security, supply scarcity, adoption rates, institutional interest, and macroeconomic influences, all of which shape its price and long-term value proposition. GOODLUCK.
Shavyfxhub
تحلیل امروز طلا (XAUUSD): ساختار بازار دروغ نمیگوید، حرکت بعدی کجاست؟

the market structure never lies, every reaction is detailed and well calibrated, during newyork session we found support at 4038-4040 zone after the impact as a result of the retest of the neckline of the daily double top price action, double top is clearly a bearish price action and it never fails once's the neckline is broken ,expect a retest. gold is still bullish and can swing at anytime. GOODLUCK
Disclaimer
Any content and materials included in Sahmeto's website and official communication channels are a compilation of personal opinions and analyses and are not binding. They do not constitute any recommendation for buying, selling, entering or exiting the stock market and cryptocurrency market. Also, all news and analyses included in the website and channels are merely republished information from official and unofficial domestic and foreign sources, and it is obvious that users of the said content are responsible for following up and ensuring the authenticity and accuracy of the materials. Therefore, while disclaiming responsibility, it is declared that the responsibility for any decision-making, action, and potential profit and loss in the capital market and cryptocurrency market lies with the trader.