
SerdarTunc
@t_SerdarTunc

What symbols does the trader recommend buying?
Purchase History
پیام های تریدر
Filter
SerdarTunc
ETH OLASI DÜZELTME HAREKETİ
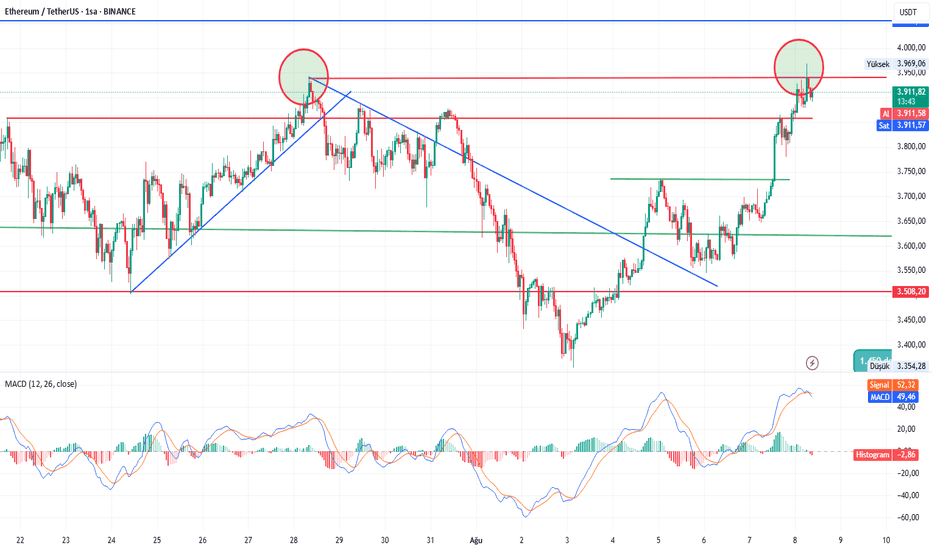
ETH As seen in the time period of the 2 -hill (areas with spaces in the circle) seems to have made. For the cancellation of the background of $ 3.950 upper level up to the upward level and permanent. Note: The graph is completely intellectual and does not include investment advice .. !!
SerdarTunc
BTC AVLANMA MODUNDA
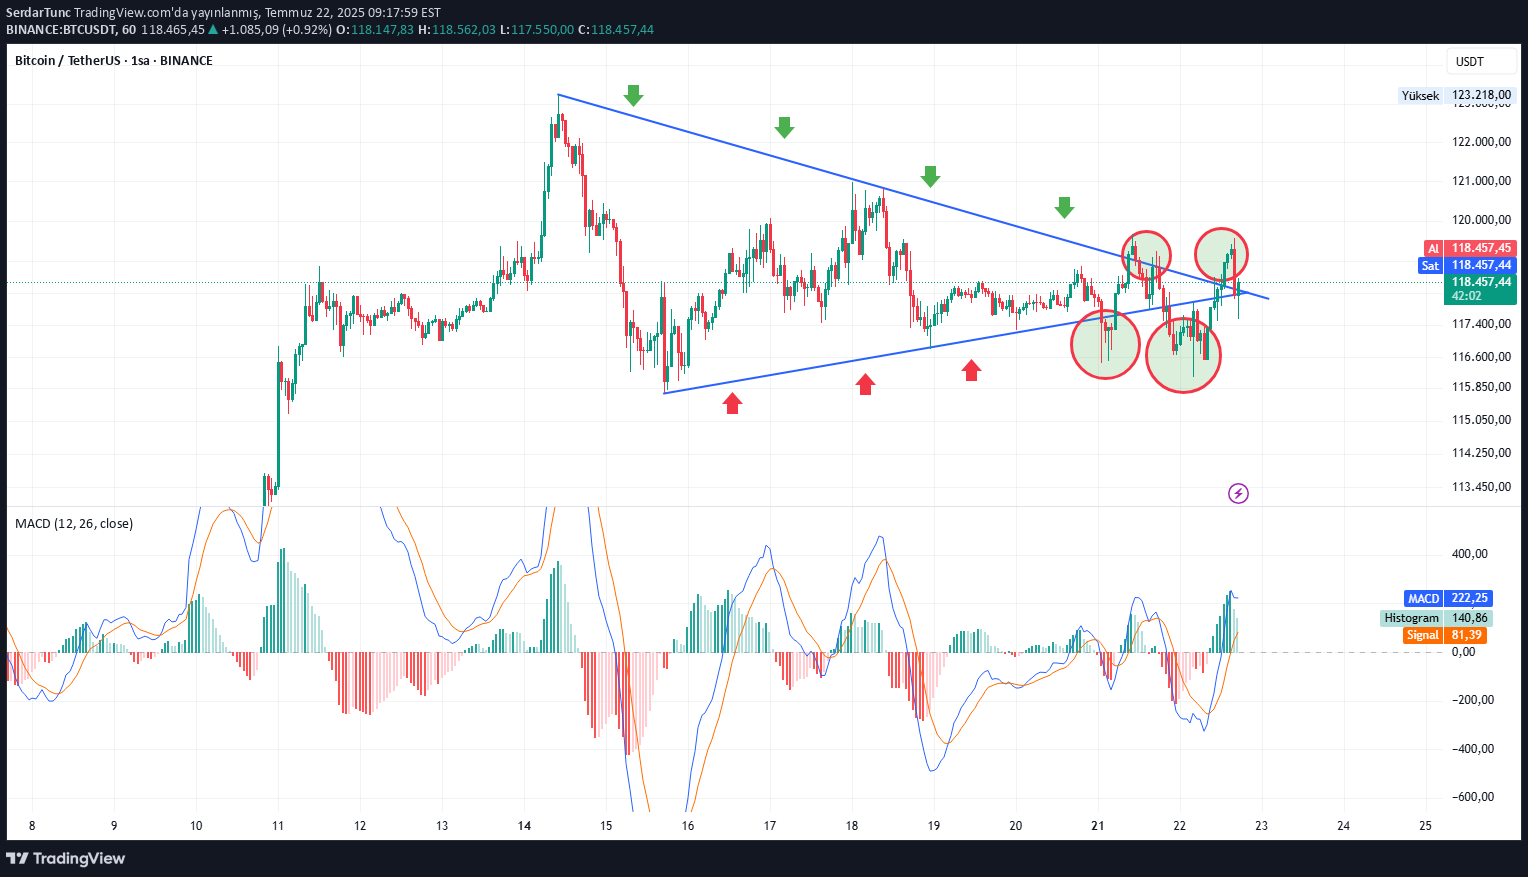
BTC hourly symmetrical triangle with apartments shown twice up 2 times down and down the appearance of the long-love break for those who broke the short-love for those looking for hunting mode.
SerdarTunc
ETH-RSI-MACD UYUŞMAZLIĞI
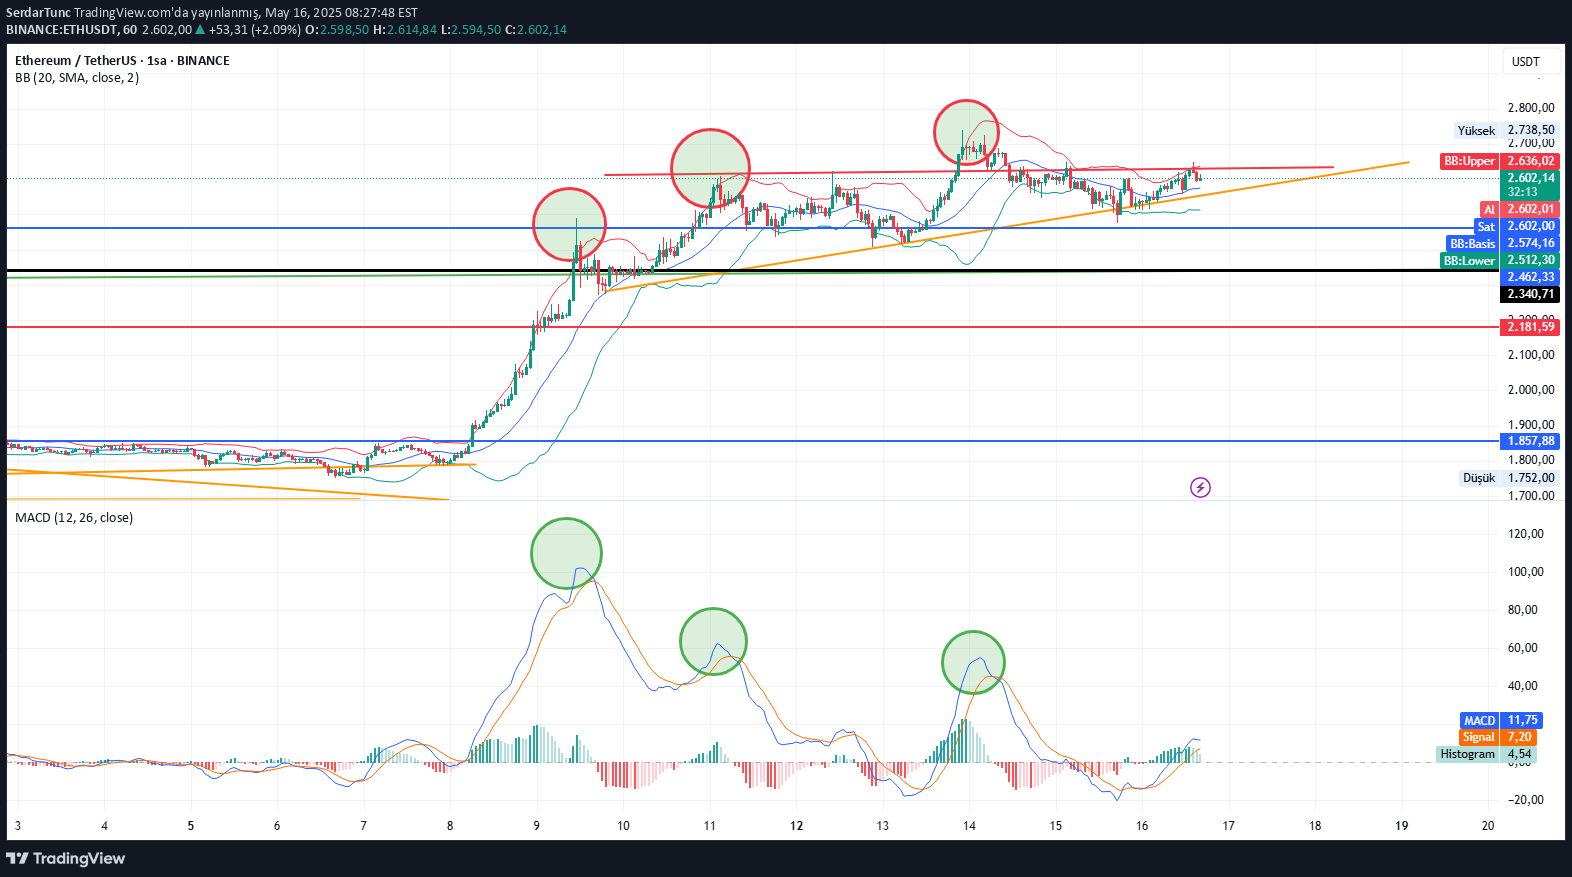
در تایم فریم ساعتی، با وجود اینکه ETH قلههای صعودی را نشان میدهد (مشخص شده با دایرههای قرمز)، اندیکاتور MACD-RSI قلههای نزولی را نشان میدهد (مشخص شده با دایرههای سبز). احتیاط لازم است. احتمالاً با یک اصلاح شدید مواجه شد. توجه: این نمودار صرفاً جنبهی ایدهپردازی دارد و به منزلهی توصیهی سرمایهگذاری نیست!!!
SerdarTunc
ETH USDT

در تایم فریم ۴ ساعته، روند نزولی که از ۴۱۰۰ دلار شروع شده، در نقاط مشخص شده با پیکانهای سبز سعی کرده شکسته شود، اما موفق نبوده است. اکنون دوباره به همین مقاومت رسیدهایم. در نمودار ساعتی، رد شدن قیمت (Red) مشاهده میشود. در صورت شکستن این ناحیه به سمت بالا، اولین هدف سطح ۲۰۰۰ دلار بود. اگر این شکست رخ ندهد، ممکن است دوباره سطح ۱۶۵۰ دلار را تست کند. پیگیری مرحله شکستن این ناحیه مفید است. همچنین، نمودار USDT روزانه (D) نیز باید همزمان پیگیری شود. در حال حاضر، به نظر میرسد از حمایت ۵.۰ واکنش نشان داده است. توجه: این نمودار صرفاً برای اهداف ایدهپردازی است و هیچ توصیهای برای سرمایهگذاری نیست!!
SerdarTunc
BSW-BİR KIRARSA PİR KIRACAK GİBİ

BSW Although the coin increased its popularity in the name of DEX in the days it was released, it experienced a tremendous decline due to the bear season. The big downtrend from 2022 is accumulating in the area shown by the green circle. If the market remains in favorable conditions, I think it can reach good places after the breakout. It is likely that the real rise will come with the upward breakout of the 0.070 trend. It is useful to follow the breakout. NOTE: The chart is purely for idea purposes and DOES NOT CONTAIN INVESTMENT ADVICE..!
SerdarTunc
GALAUSDT Çıkış arıyor
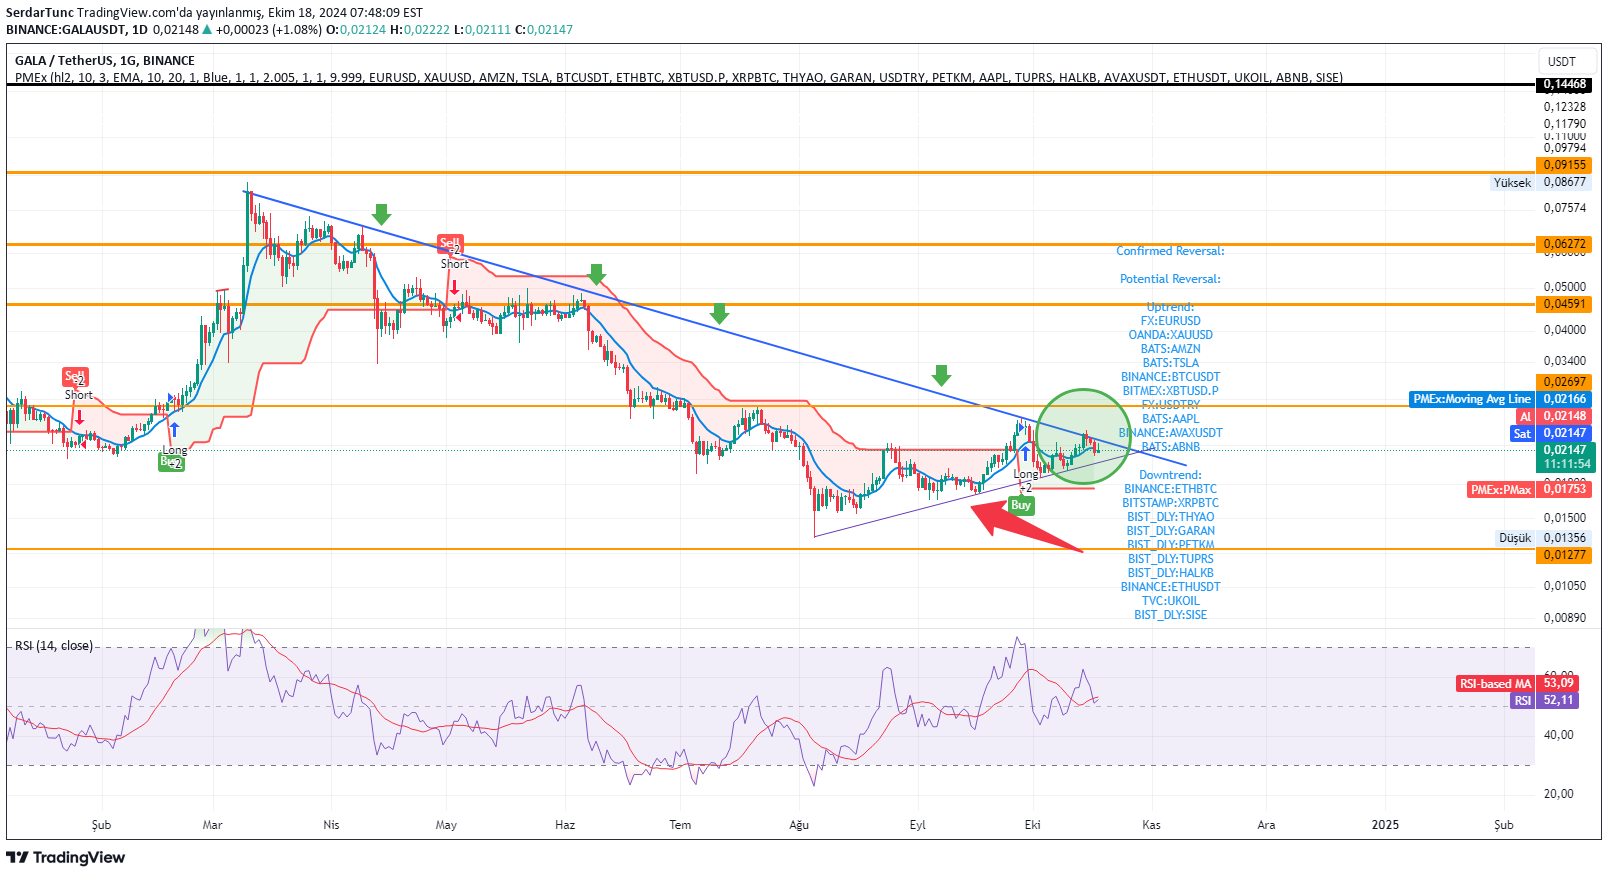
Gala The coin has not been able to show its performance since the March 10 peak. Although it tried to break the downtrend indicated by the green arrows, it was unsuccessful. It is currently holding on to the support trend indicated by the big red arrow and making its move. It is approaching the intersection I indicated with the green circle. If it breaks this point upwards, the market may start its rise if suitable conditions are provided. In the downward break, it may want to retreat to the 0.015 support again. It is useful to follow the breakout and open a transaction. NOTE: The chart is for idea purposes only and DOES NOT CONTAIN INVESTMENT ADVICE.
SerdarTunc
POLYXUSDT
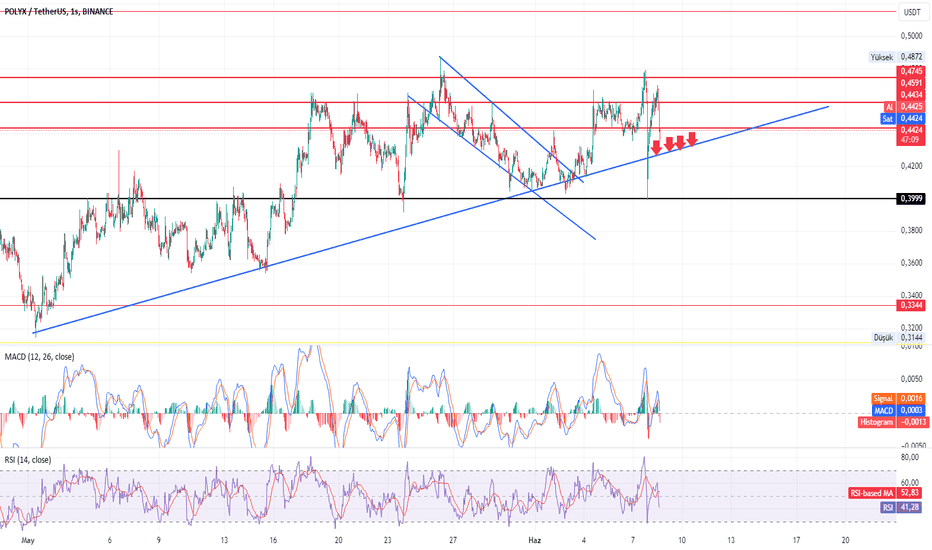
It had risen to 0.48 with the downtrend break from 0.41. As I mentioned in my previous comment, BTC, which was under heavy pressure for margin liquidation, did not allow the rise. I expect a pullback to the Blue line (rearward trend) that I indicated with the red arrow. If it gets a reaction from there and BTC stays calm, it may continue to rise again. NOTE: The chart is purely for idea purposes and does not contain investment advice. A nice reaction rise came from where we said and we made a good profit.
SerdarTunc
POLYXUSDT
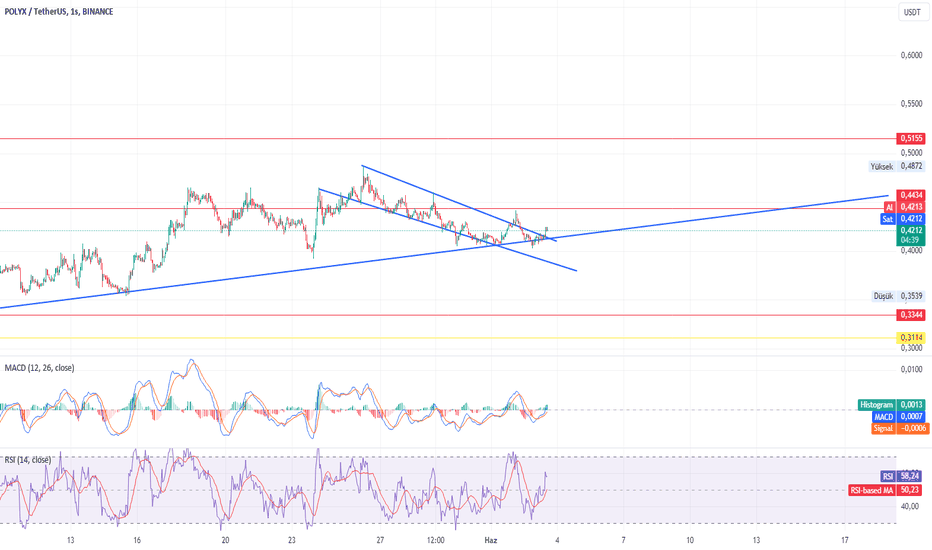
A nice and important RWA project. It seems to have broken the horizontal falling channel as 2 candles on the hourly chart. If our Btc brother allows, an increase up to 0.45 can be seen. NOTE: The chart is purely for idea purposes and does not contain investment advice. I think the movement has started. If it stays above 0.45, the increase can continue up to the 0.52 band. We made a nice profit in the futures section from the transaction we entered at 0.41 and closed at 0.52. It's time for a break. If it completes its correction around 0.44, the transaction can be opened again according to market conditions.
SerdarTunc

SerdarTunc
BTCUSDT

I predict that the decline will deepen with the downward break of the area indicated by the arrow sign on the chart. NOTE: The chart is for idea purposes only and does not contain investment advice.
Disclaimer
Any content and materials included in Sahmeto's website and official communication channels are a compilation of personal opinions and analyses and are not binding. They do not constitute any recommendation for buying, selling, entering or exiting the stock market and cryptocurrency market. Also, all news and analyses included in the website and channels are merely republished information from official and unofficial domestic and foreign sources, and it is obvious that users of the said content are responsible for following up and ensuring the authenticity and accuracy of the materials. Therefore, while disclaiming responsibility, it is declared that the responsibility for any decision-making, action, and potential profit and loss in the capital market and cryptocurrency market lies with the trader.