SepidehArjmand
@t_SepidehArjmand
What symbols does the trader recommend buying?
Purchase History
پیام های تریدر
Filter
Signal Type

SepidehArjmand

📊 PEPE/USDT Technical Analysis – August 10, 2025 On the weekly timeframe, PEPE has successfully bounced from its long-term ascending trendline, showing a notable bullish reaction. Currently, the price is approaching the key resistance at 0.00001213. 🔹 Bullish Scenario: If this resistance is broken and confirmed with a valid candlestick close on lower timeframes, the next target will be the descending trendline and resistance at 0.00001404. A breakout above this level could open the way toward 0.00001601 and then 0.00001774. 🔹 Bearish Scenario: If the price falls below the ascending trendline, the first major support will be around 0.00000906, which could play a crucial role in determining the next move. 📌 Conclusion: Traders should closely watch the reaction at the 0.00001213 resistance and the ascending trendline, as a breakout in either direction could set the next trend for PEPE.

SepidehArjmand

📊 Gold (XAU/USD) Technical Analysis | August 8, 2025 Gold price has reached the midline of the channel in the 4H timeframe and reacted to it, forming a descending trendline afterward. 🔻 Bearish Scenario: If the price rejects from this area, the next downside targets will be: 3382.71 3375 3370 🔺 Bullish Scenario: If the descending trendline and the channel’s midline are broken decisively with confirmation, the next upside targets will be: 3413 3423 📌 Conclusion: The reaction to the channel midline and whether this zone holds or breaks will determine gold’s next move. Traders should closely watch these key levels for potential opportunities.

SepidehArjmand

📊 Ethereum Technical Analysis | August 8, 2025 Ethereum has shown a strong bullish reaction after bouncing from the key $3,893 support zone, confirming the move with a solid bullish candle. If this support holds and further bullish signals appear, the next upside targets will be: $4,088 $4,140 And potentially $4,291. 🔻 However, if the $3,893 support fails and price closes below it, the next important support to watch is around $3,757, which could act as a barrier against deeper declines. 📌 Summary: Holding above $3,893 keeps the bullish scenario alive for Ethereum, while losing this level may increase selling pressure. Mark these key levels on your chart to make more precise trading decisions.

SepidehArjmand

Bitcoin Technical Analysis | August 7, 2025 After a corrective move to the $112,000 support zone, Bitcoin bounced back and is now moving along a rising trendline (highlighted in pink). As long as the price holds above this line, the bullish structure remains intact. 🔸 Currently, BTC is approaching a key resistance zone between $117,500 and $118,600, which aligns with the descending orange trendline on the chart. If this zone is broken with confirmation, the next potential targets will be: $122,400 and $129,500 🔻 However, if the price gets rejected from this resistance: The first support lies at $115,570 Breaking below that, the next support will be the purple trendline A confirmed break of the bullish structure could push BTC down to $110,524 📌 Conclusion: Bitcoin is nearing the apex of a symmetrical triangle pattern. A breakout in either direction could define the next major move. Make sure to mark these critical levels on your chart and adjust your trading strategy accordingly.

SepidehArjmand

📊 Ethereum Analysis – July 30, 2025 Ethereum is currently testing a key descending trendline (blue line). If the price breaks above this resistance and confirms with strong candlestick closures, there's a high probability that ETH will rally toward the ascending red trendline, acting as the next dynamic resistance. 🚀 A confirmed breakout could trigger a bullish continuation, opening the door for higher targets in the short term. However, failure to hold above this level may result in a pullback or range-bound movement. 📌 Keep both the blue and red trendlines on your chart — they’re currently the most critical zones to watch for potential entries or exits.

SepidehArjmand

📈 ETH Update – Eyes on the $3,820 Zone Ethereum is showing bullish momentum, and there’s a strong chance it could rally toward the orange resistance line around $3,820. If price breaks above this level, the next target will be the blue trendline, marking the next key resistance. 🚀 Stay ready — momentum is building. 🔔 Follow for more clean setups and real-time analysis!

SepidehArjmand

📊 Bitcoin Technical Analysis – Bullish Flag or Symmetrical Triangle? 📅 Analysis Date: July 29, 2025 As shown in the chart, Bitcoin appears to be forming a bullish flag or symmetrical triangle pattern—often seen after strong upward moves. 🔹 Bullish Scenario: If the price breaks above the triangle, the first target is around $122,480, followed by a potential second target near $129,500, based on the length of the flagpole. 🔹 Bearish Scenario: If the triangle breaks to the downside, the first support to watch is $115,230. 🧭 These key levels act as critical zones of supply and demand, so be sure to keep them on your chart! 🔥 Follow me for real-time setups, clear signals, and expert technical analysis!

SepidehArjmand

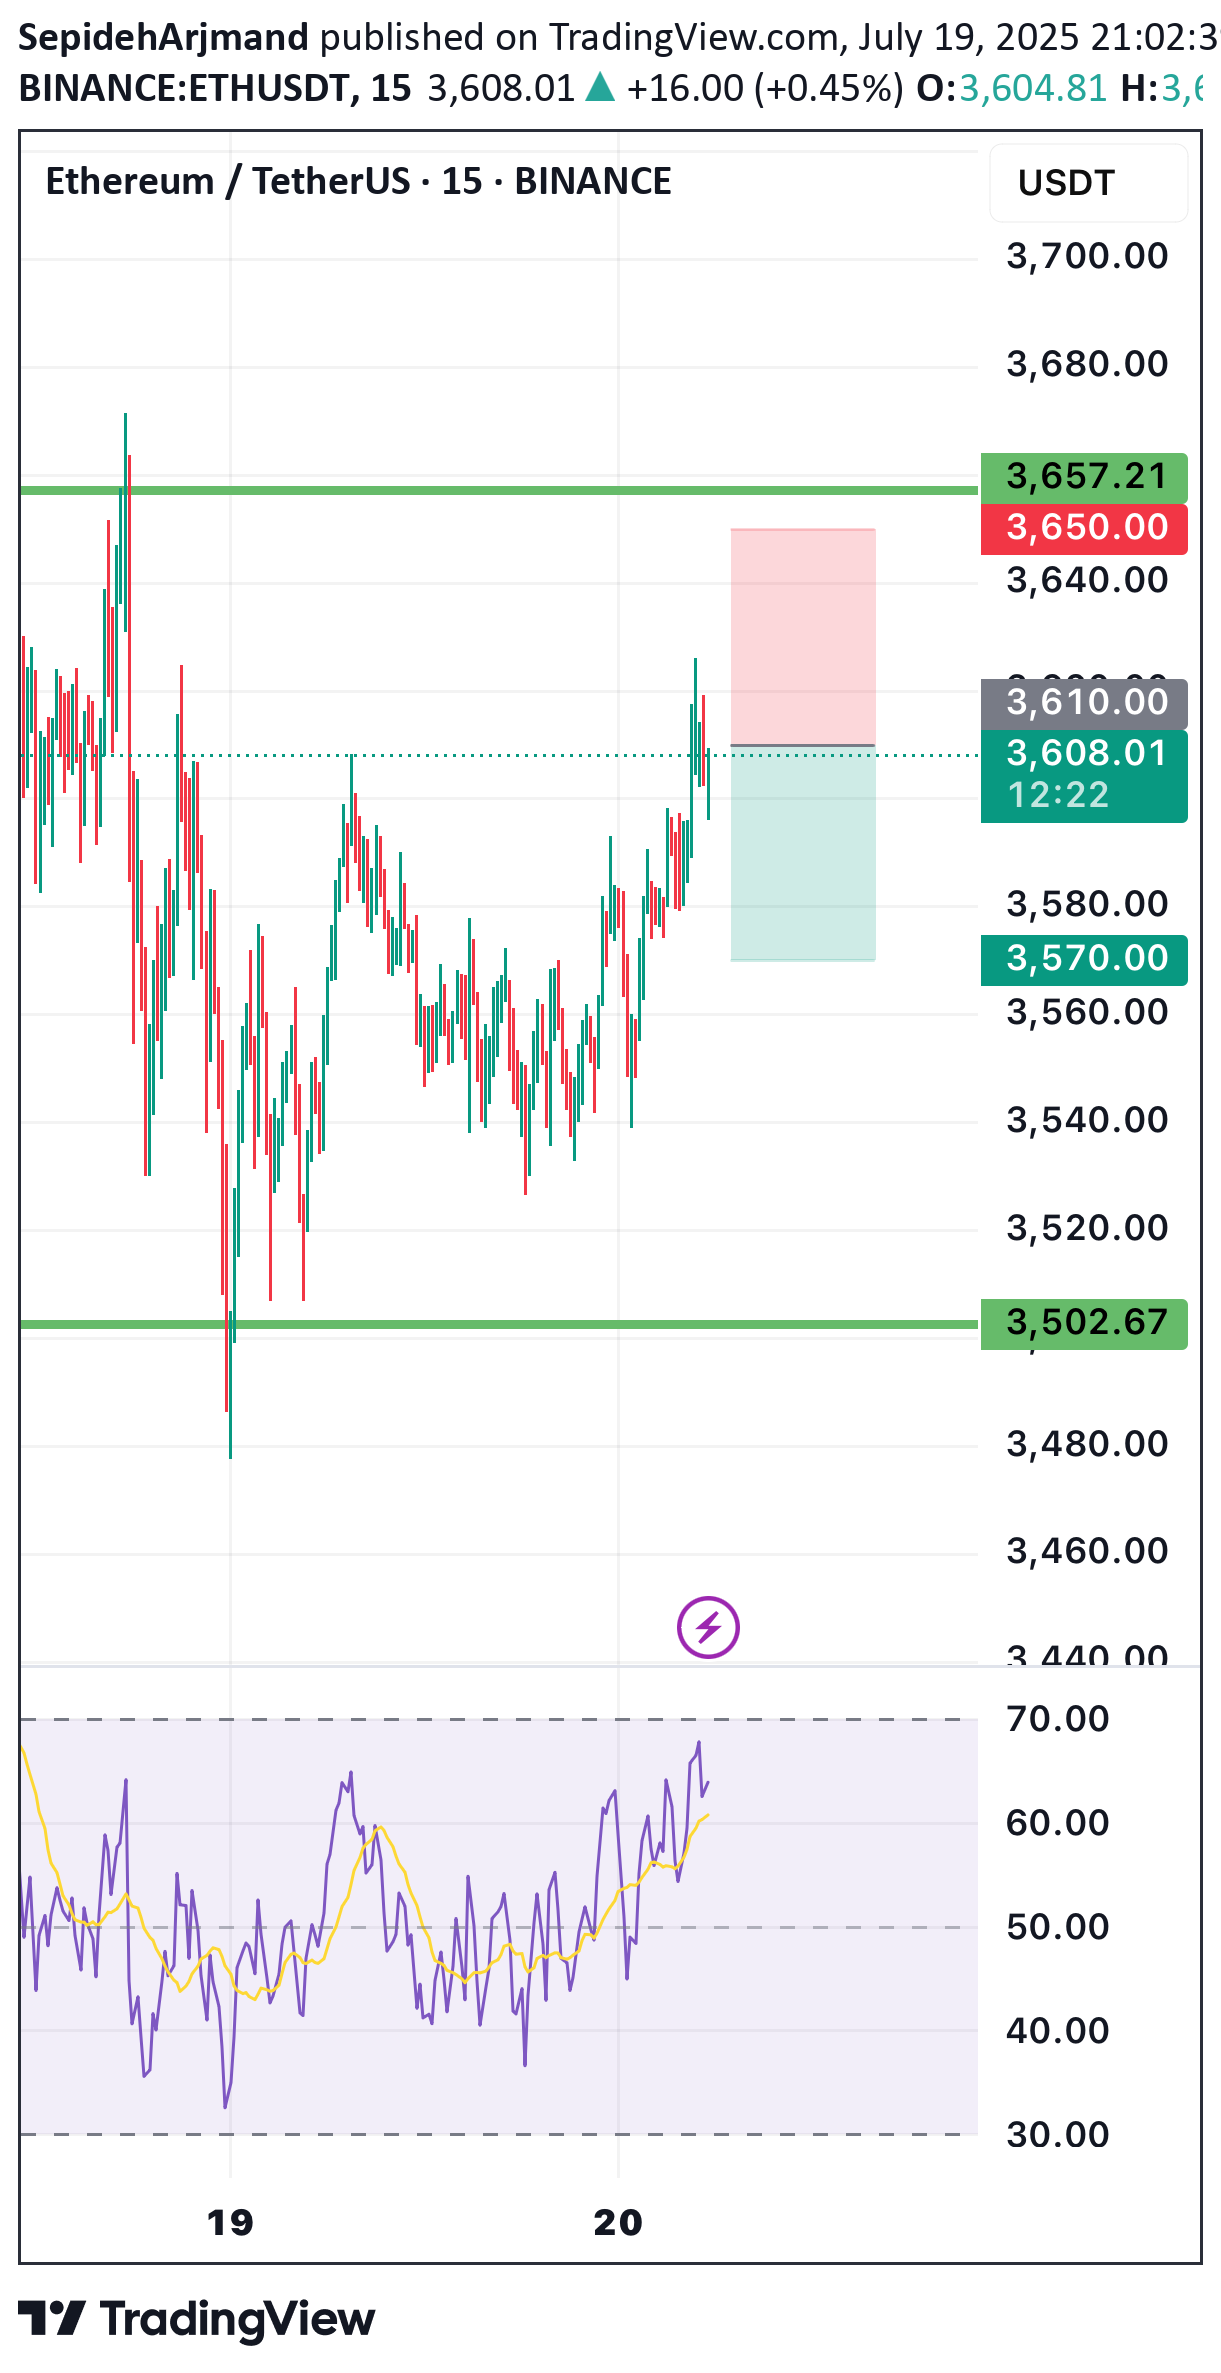
📉 ETH/USDT 30m Signal Pair: ETH/USDT Timeframe: 30-minute Trade: SELL 📍 📊 Level Pips R:R 💵 Entry 3,610 USDT 🚫 Stop-Loss 3,650 USDT 🎯 Target 1 3,570 USDT 1:1 🎯 Target 2 3,530 USDT 2:1 🎯 Target 3 3,490 USDT 3:1

SepidehArjmand

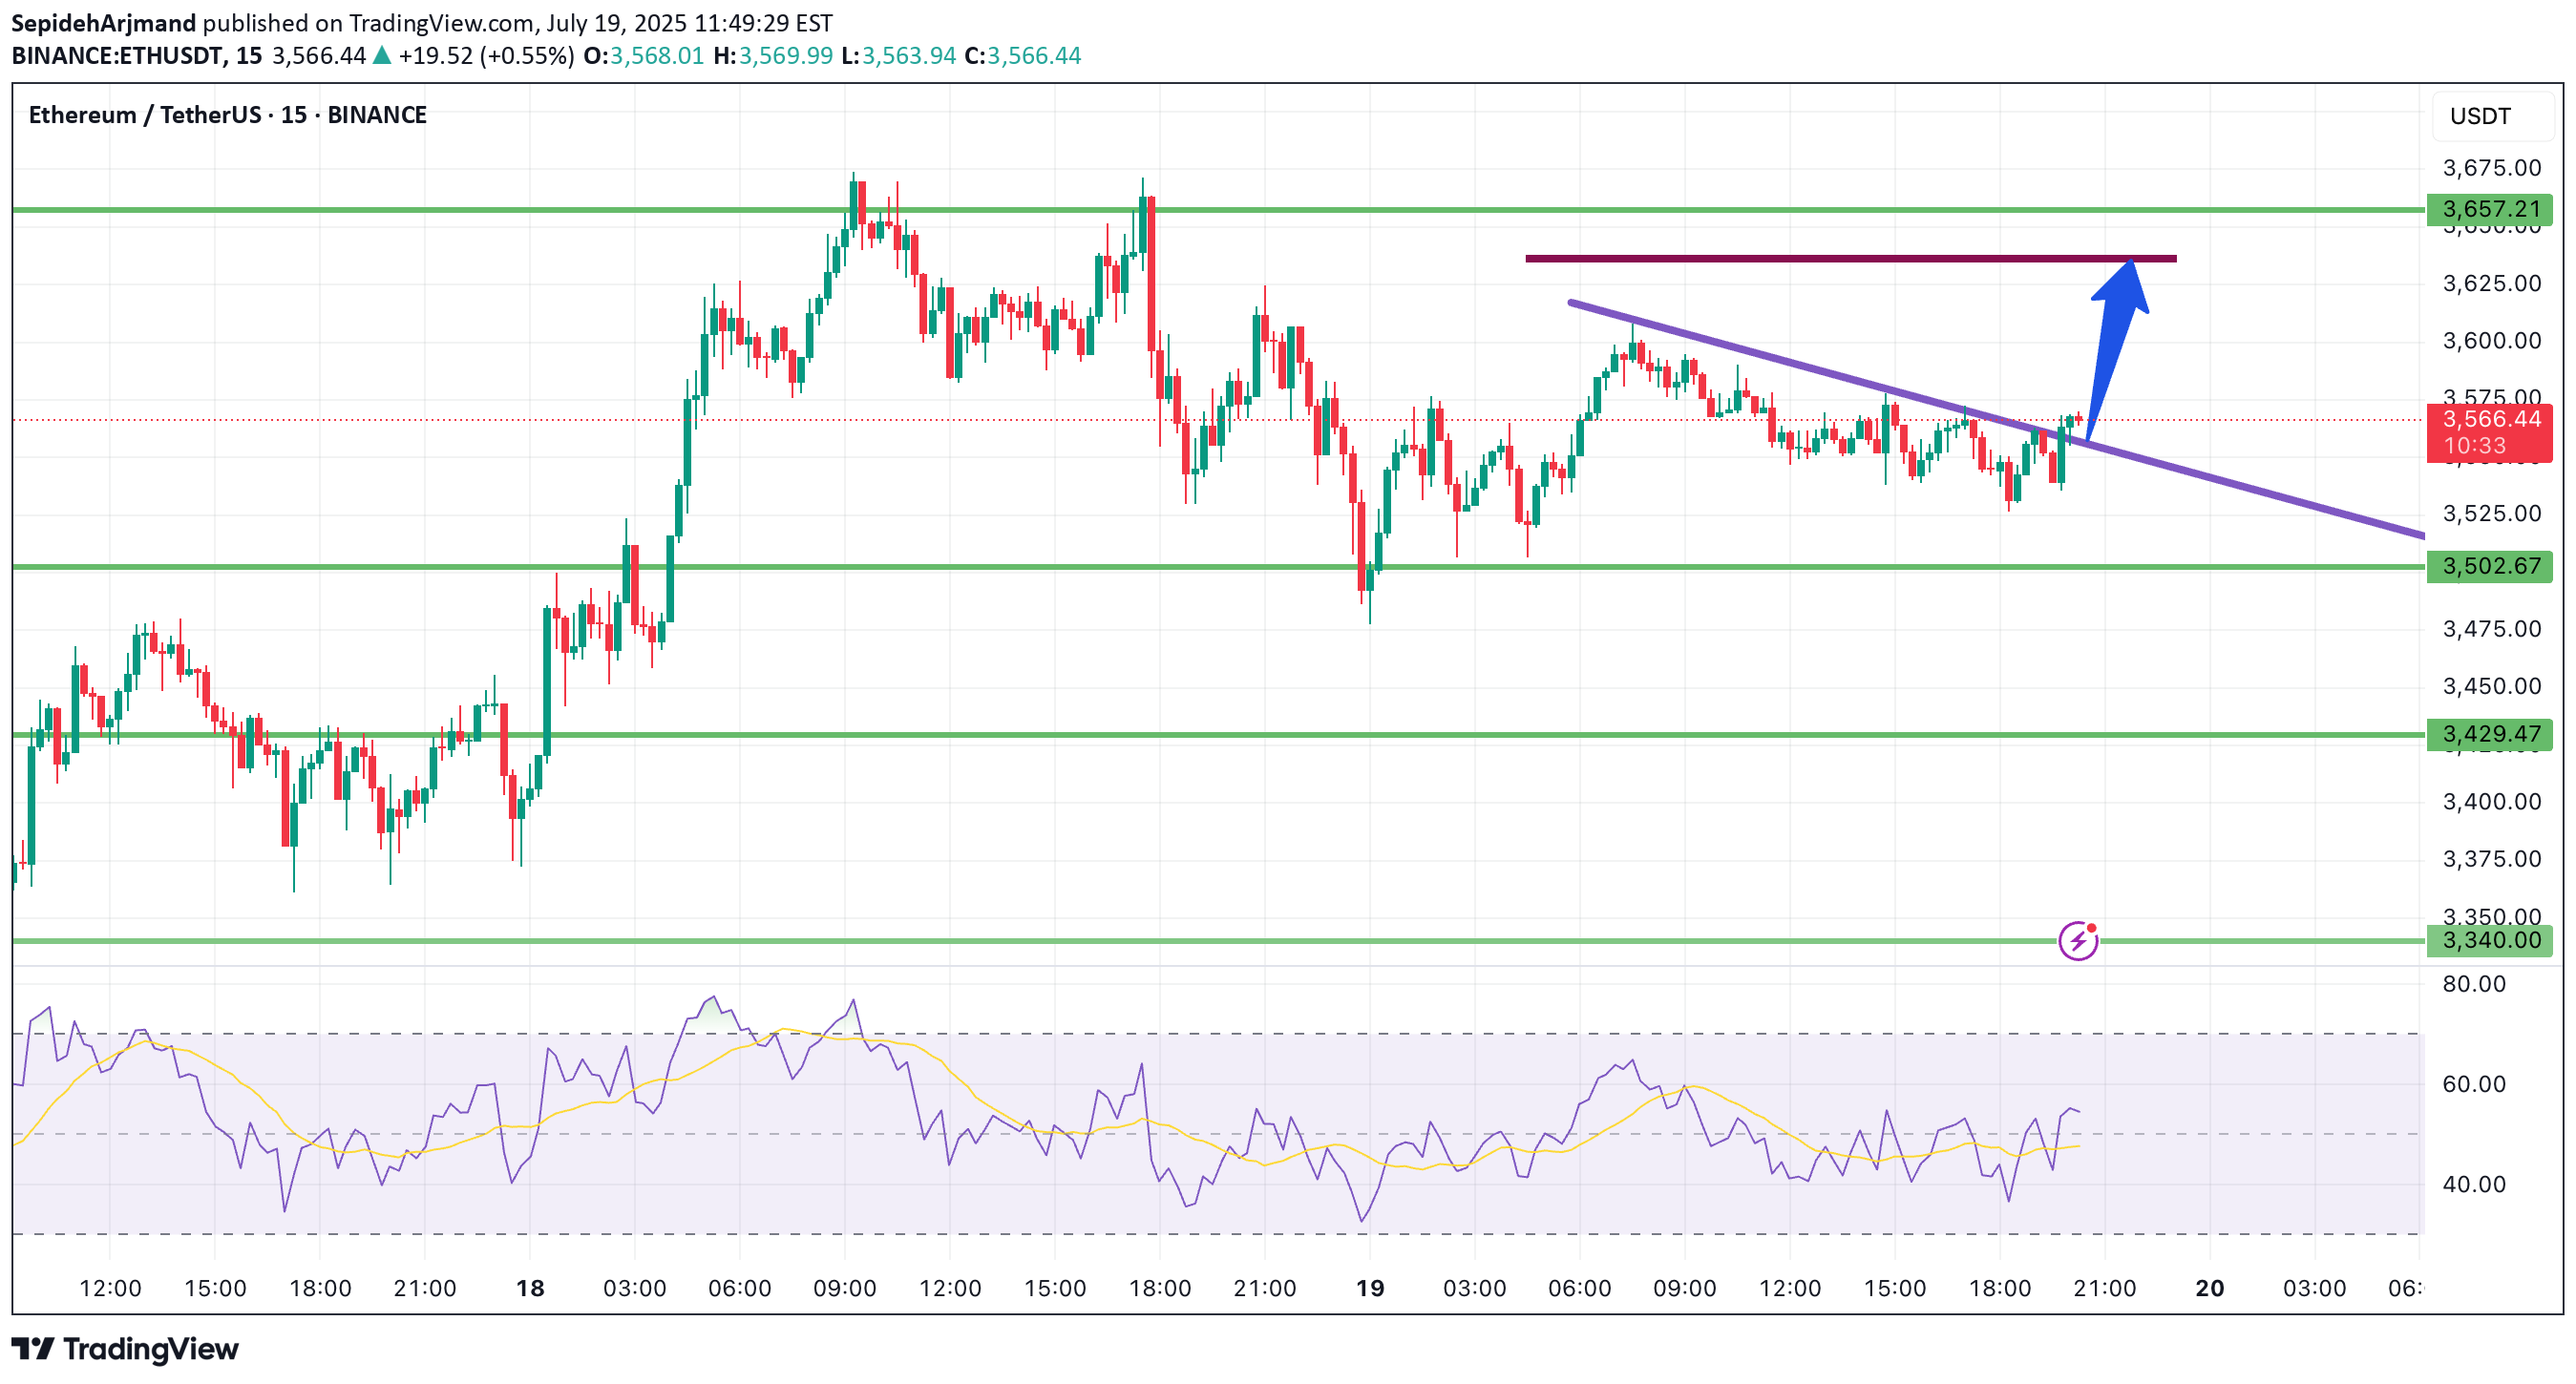
Is Ethereum Ready to Break Out? Watch This Key Trendline! In the 15-minute timeframe, Ethereum (ETHUSDT) is testing a major descending trendline. If a strong bullish candle closes above this level and price action holds, we could see a move toward the $3,637 resistance zone. This area has acted as a significant technical level in the past, and a confirmed breakout may trigger further upside momentum. 🚀 A successful breakout could provide a solid long entry setup, with $3,637 as the first target. Keep a close eye on this move—momentum is building. 💡 Don’t miss more high-probability setups like this! Follow for real-time crypto analysis and trade ideas.

SepidehArjmand

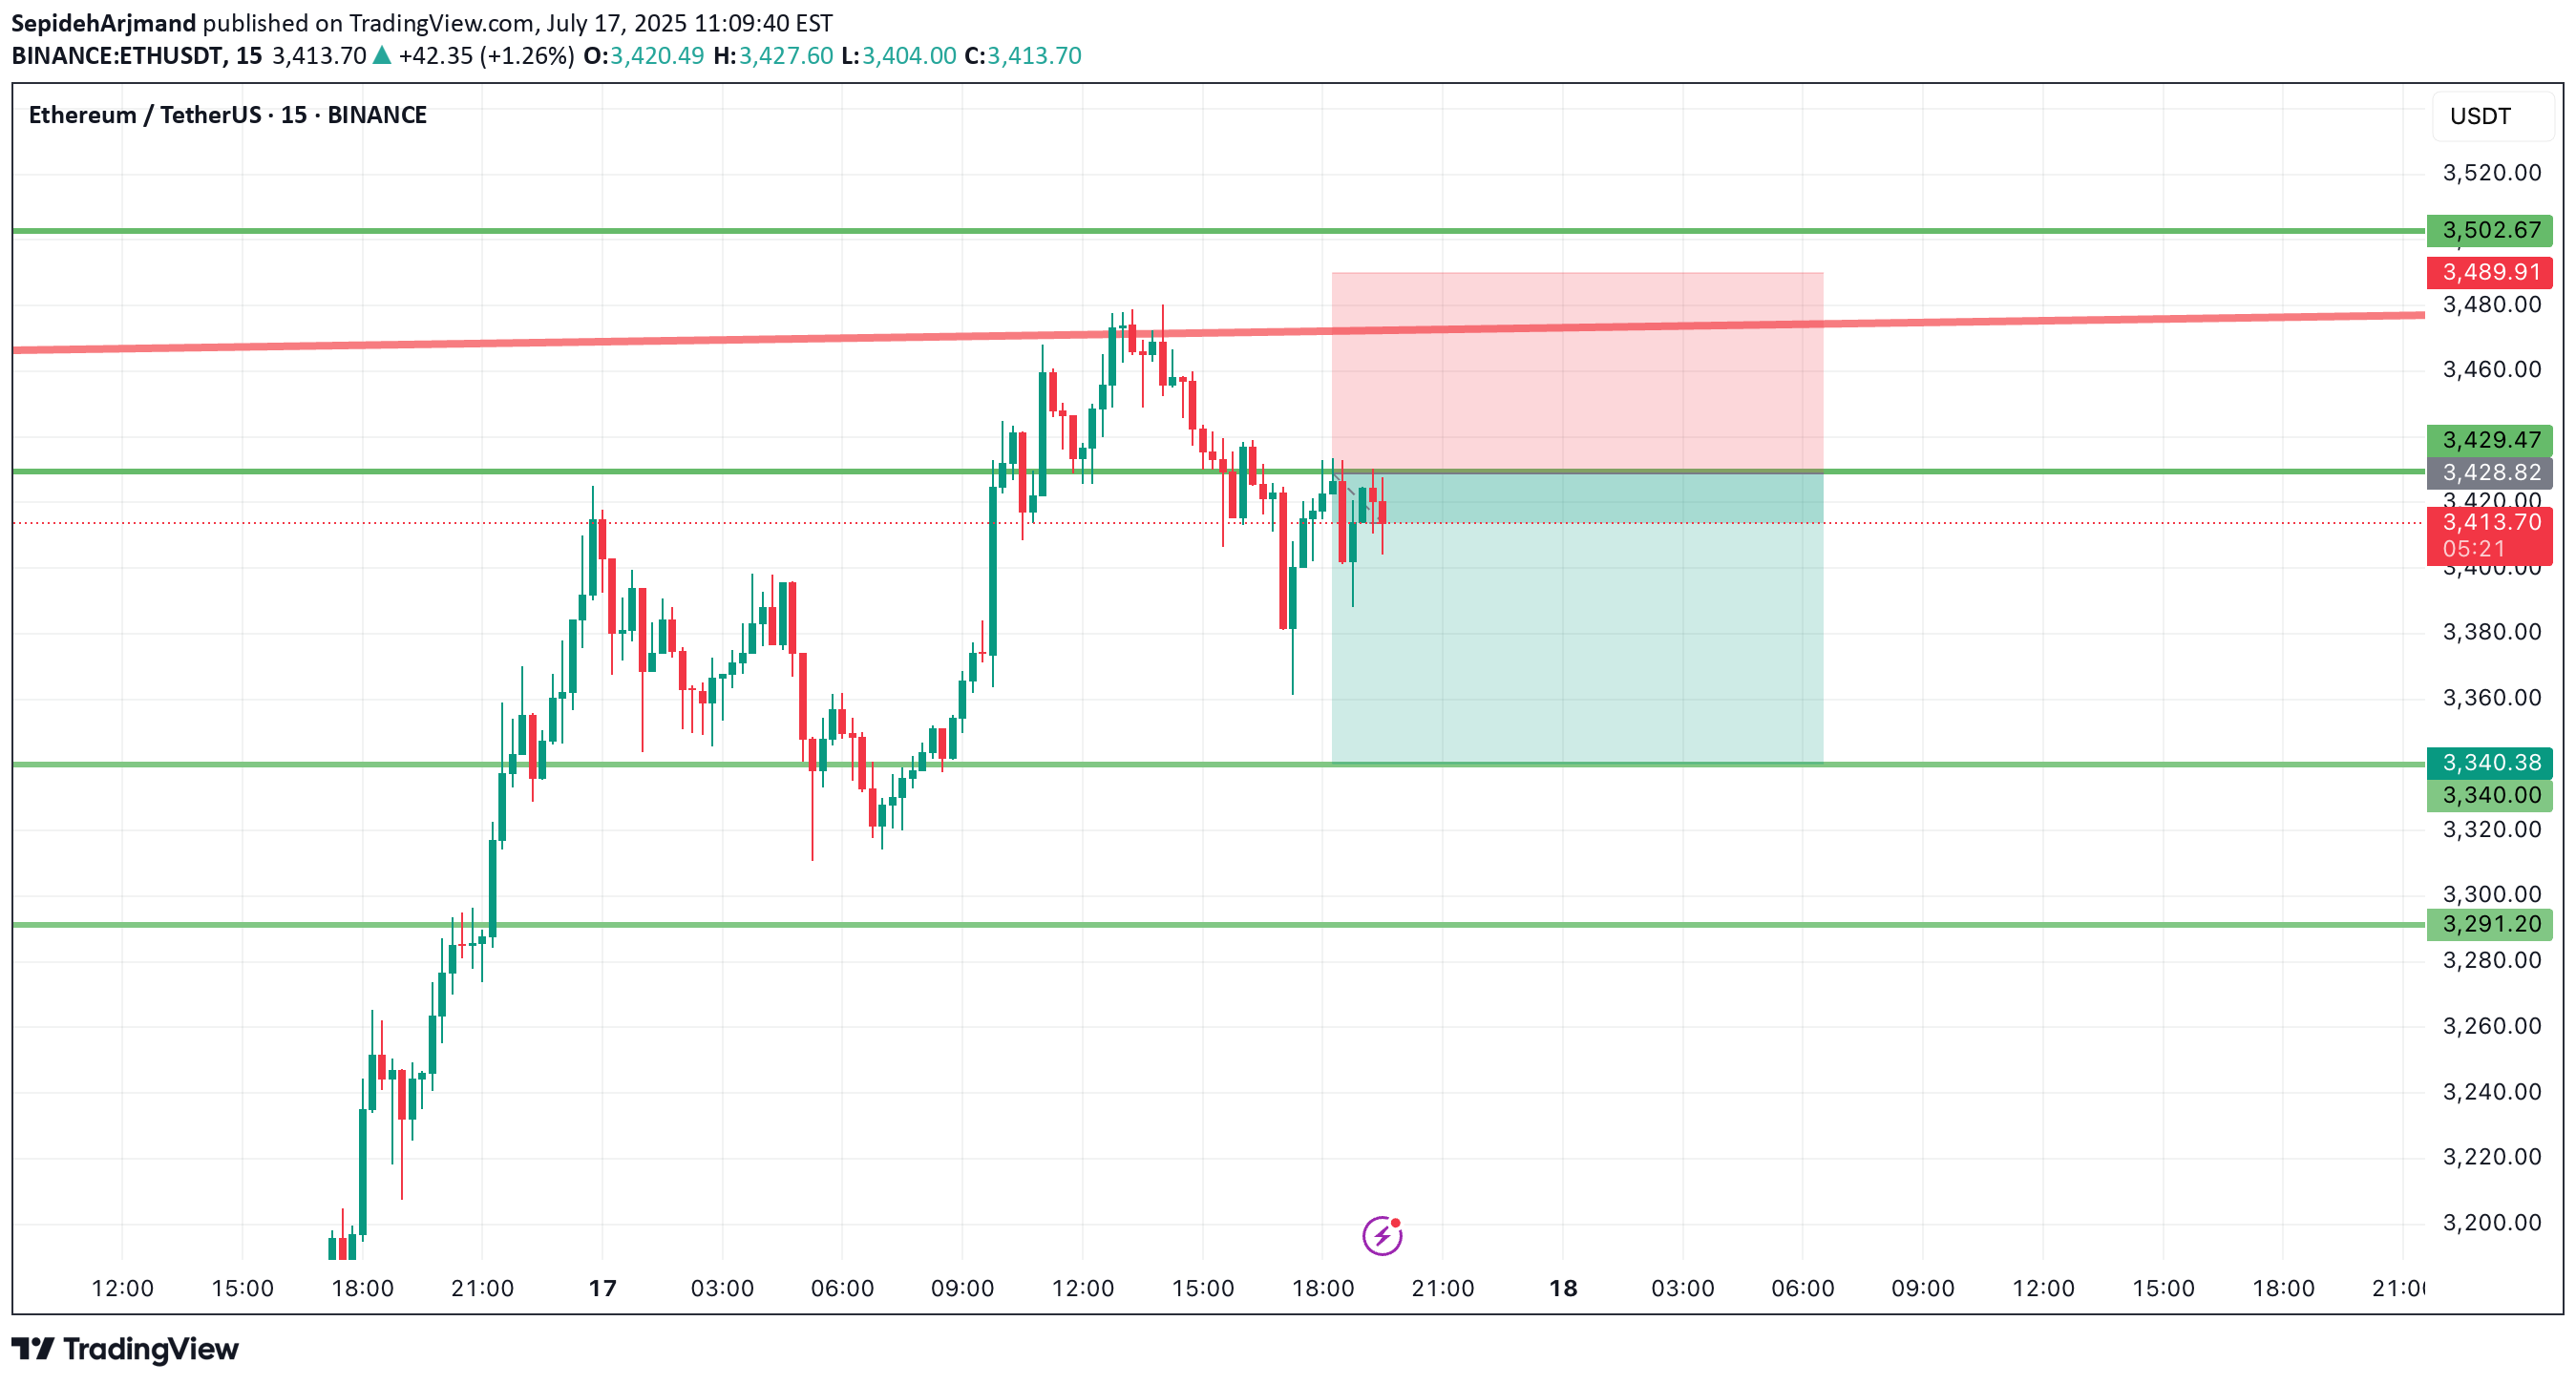
ETH Short Opportunity 🟥 | Watch 3428 Closely Ethereum is approaching a key resistance at $3428 — this zone could offer a great short setup if confirmed. First target on the downside: $3340 📉 High R/R potential if price rejects this level. Stay sharp and manage your risk! 🔔 Follow me for more real-time trade ideas and technical insights.
Disclaimer
Any content and materials included in Sahmeto's website and official communication channels are a compilation of personal opinions and analyses and are not binding. They do not constitute any recommendation for buying, selling, entering or exiting the stock market and cryptocurrency market. Also, all news and analyses included in the website and channels are merely republished information from official and unofficial domestic and foreign sources, and it is obvious that users of the said content are responsible for following up and ensuring the authenticity and accuracy of the materials. Therefore, while disclaiming responsibility, it is declared that the responsibility for any decision-making, action, and potential profit and loss in the capital market and cryptocurrency market lies with the trader.