
Saver0
@t_Saver0

What symbols does the trader recommend buying?
Purchase History
پیام های تریدر
Filter
Saver0
COMP going up 7-20%, pump detected with 99%+ hit rate

Hi Traders, If this is the first time you read about my pump signals, I will provide more details at the bottom so you know what this is based on. Now to the signal itself. The COMP signal is from this morning. There are 2 targets. In addition to the signal, we can apply some technical analysis to see what's going on with this asset: ORI indicator is showing a break out into bullish area ORI black trend signal line has crossed over the green fast MA and is above the slow MA. ORI is moving in a channel with space to the upper side Once price breaks the trendline, I expect the pump to continue Greep pips to you 🤑 ------------------- What are pump signals: The algo detects unusual volume activity and buying pressure across multiple time periods. Here are some details analysis of these signals. Average Gain to Target 1: 17.7% Average Time to Target 1: 8 days Median Time to Clear Target 1: 6 days 80th Percentile Time to Clear Target 1: 16 days Win Rate Target 1: 94.9% Win Rate of Either Target: 95.3% Total Signals: 8515 First Signal At: September 2022 How to trade them: You can apply some TA to time your entry. As you can see from the pump stats, they take a few days to weeks to hit. We get the 95% average hit rate across all signals within 30 days so there can be a large time window. I suggest splitting alt-coin capital into 20 parts and spreading them across multiple signals. The exit should be time-based and clearing of most signals. In the worst case, when traded this way, I see statistically 18% average gain per month. The capital doubles roughly every five months. Final note: It takes time for me to post these so I will be posting them on TV rarely when I have the time and often with a delay. As always, please trade at your own risk. This is all meant to be educational.
Saver0
ↀ OGUSDT going up 10-20%, pump detected with 99% hit rate

Hi Traders,There are multiple signals that came out of the pump algo that I developed. Today I'm going to share a few of them that the system detected over the past few days. First up is OGU.If this is the first time you are reading about my pump signals, I will provide more details at the bottom so you know what this is based off of. Now to the signal itself.OGU signal is from yesterday at 8pm. The signal comes with two targets as you can see on the chart.Addition to the signal, we can apply some technical analysis to see what's going on with this asset: ORI indicator is showing a healthy bullish trend. ORI black trend signal line has crossed over the green fast MA and is above the slow MA. Also the green MA and black trend signal trend lines have crossed the down trend line. Starting to see an increase in volumeGreep pips to you 🤑-------------------What are pump signalsThe algo detects unusual volume activity and buying pressure across multiple time periods. Here are some details analysis of these signals.Average Gain to Target 1: 17.7%Average Time to Target 1: 8 daysMedian Time to Clear Target 1: 6 days80th Percentile Time to Clear Target 1: 16 daysWin Rate Target 1: 94.9%Win Rate of Either Target: 95.3%Total Signals: 8515First Signal At: September 2022How to trade themYou can apply some TA to time your entry. As you can see from the pumps stats, it takes a few days to weeks for them to hit. We get the 95% average hit rate across all signals within 30 days so there can be a large time window. I like to split my alt-coin capital into 20 parts and spread them across multiple signals. My exit is time based and clearing of most signals. The worst case, when traded this way, I see 18% average gain per month. The capital doubles roughly every 5 months.Final noteIt takes time for me to post these so I will be posting them on TV rarely when I have the time and often with a delay.Trade at your own risk
Saver0
COIN, 40% gain to be expected
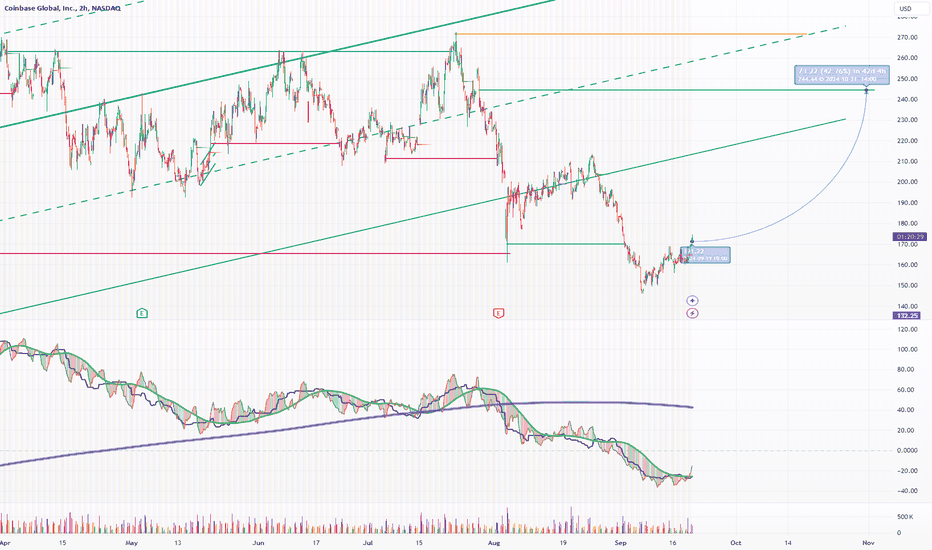
Hi all, I thought I would share this stock, which I've been trading for over two years. COIN and BTC are very closely correlated. I posted about BTC just a bit ago and I expect BTC to be in 60-70k range for this new bull cycle. This means COIN should cross $240 and could get to $260-270 range once again. We are looking at an easy 40% gain. Take a look for yourself and see if I'm wrong 😉 Green pips to you 🤑We are close to reaching the target. You probably wonder how much higher it could go once it reaches the target. COIN could break the highest high if BTC manages to does it as well. We could see COIN breaking $300. However, my time-based exit is prior to the election as I expect some volatility soon after that could lead to some sell-off. Election results could be the sell-the-news type of event.Target reached. Expecting a correction now.
Saver0
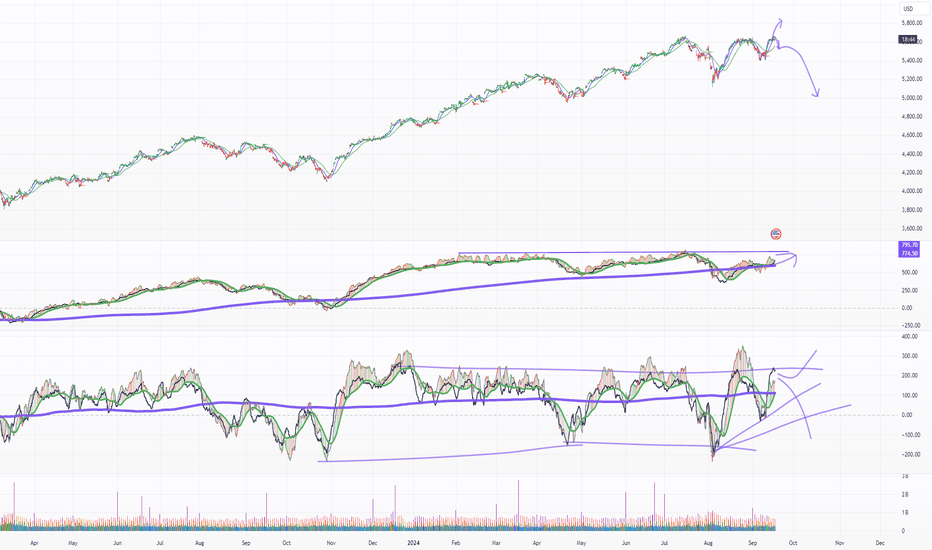
BTC to 66.6k and then 70k

Hi folks! I hope everyone managed to get in at our lows over the past few weeks. The cycle has officially turned bullish, and we are going to 66k first and then 70k. After FOMC, we get a clear direction to the market, but often, people do not know how much higher or lower it can go. I have a system of measuring energy that gives the total potential energy produced during events such as FOMC. Based on that energy, I have the highest probability target of 66k, followed by 70k. You can also see that 66k is well within the upper trend line. While 70k is outside, I expect a spike outside this zone to trap in bulls/greedy. We entered back into the bullish channel. The ORI indicator also showed significant bullish divergence and Trend crossing into the bullish territory. Enjoy the euphoria you will feel over the next few weeks. Just don't get greedy; find joy and secure your profits. More pain will come eventually. Green pips to you 🤑There should be a bit more; we should see BTC breaking $70k, but reversion will occur. We could see a new 6-month low.
Saver0
How prepared are you for the outcome from FOMC today?
Hello traders! I see one of three possible decisions being made today: Highest probability, 25bp rate cute Low probability, 50bp rate cut Low probability, no change (they did say over many months how committed they were to 2% inflation). These 3 possible decisions can have multiple outcomes. 25bp rate cut : Market moves in the current direction (up for assets/crypto etc) 50bp rate cut : Market turns heavy bullish No change : get ready for a very cold and painful winter and QE to turn the market back around in 3-6 months from now. How are you preparing for these three possible outcomes strategically and mentally? Here is my play: I have bets for the long side, so if a bullish outcome happens, I'm ready to take my profits at my targets And if there is no change and we see a crash over the next few months, I'm mentally prepared and will embrace that outcome with a smile on my face and get ready to buy again at the next bottom once the FED unleashes QE. There is one last rare possible outcome: selling the news type of event. We could see a sharp decline over the next few weeks, but it will be all very bullish. There could be an attempt to mark down the prices to get folks to sell so they can buy. Let's play smart and be prepared mentally. Trading is just like any other sport; it's a mental game. Good luck to everyone today, and green pips to you 🤑
Saver0
BONK, 99% probable pump signal with 2 targets, easy 20% gain

Good morning, traders! Today, I have BONK to share with the TV community, which came out of the high-probability pump detection algorithm that I developed. Based on past pumps for the same pattern, both of these targets have a near-certain probability of hitting. Over the past few days, many pumps were detected across many coins. I especially like the T2 level because it is also a very high-probability impulse-based reversion zone. These targets are very likely to hit just on their own. Combined with the pump, I think we've got a money-maker here. Additional things going for this signal: We are on an upward trend and about to break out of the following downward trend line. We also got a high-volume print indicating the buy orders, a.k.a. pumps. Who is getting on this pump train? Leave your comments below. Green pips to you 🤑T1 is hit, but T2 is still at play.Target 2 also hit 🤑
Saver0
90-95% hit rate, 2 pump targets detected

Today, I got RIF to share with the TV community for free. These pump signals aren't available in my service yet, but they'll soon be available once I remove the free beta 😉 So now to the signals itself. There are 2 targets; the bottom one is a 95% probability of clearing within the month, and the other one is 90%. From the Reversion point of view, it's a solid level, and we can see that with my indicator, we have significant divergence with sufficient distance to cover before we touch the long-term MA reversion center line. Green pips to you 🤑Target 1 reached, now wasn't that quick 😉Target 2 reachedDone
Saver0
99% near certain pump reversion signal on OM

This target is nearly certain. It comes from my brand new algorithm, and I will be posting more of these daily. I specifically like this target because I have the volume confirmation, and it's also a reversion-based target. However, this signal has never been missed just on the pump signaling alone. This level is to be expected within 30 days.We are almost on the way!Another hit as expected. 🤑
Saver0
MKR 20-28% pump detected, 93% chance of hitting

Hi all, I have some exciting news to share. I will soon be providing you with regular pump signals from my brand-new algorithm, which detects pumps with a 90-100% hit rate. Today, I'm sharing this signal that my algorithm detected on MKRUSDT, which has a very high probability of reaching the target within 30 days. I'm working on making this live on my platform. It should be available within a week or two. The nice thing about today's signal on MKR is that it's also a solid Impulse based Reversion level. Green pips to you 🤑This was detected by a mistake and corrected in the signals posted afterward. Please ignore this one.
Saver0
BTC looks to be bottoming out or more fear ahead? (Daily Update)

Hello traders, this is my daily update on BTC. The daily updates aim to give you a sense of where the reversion zones are, and I will try to post these as often as possible. For live updates, you know where to go 😉 I highlighted with a red marker the area on my indicator that shows a bit of a bullish trend, and you can see in the price the impulse irrational move that drove the price against the trend. Hence, this area is expected to be revisited, and I expect the price to be above 59K once more. Looking at the overall trend by going to 4-hour period, it gets interesting. Here we can see a similar impulse move of price against the trend. This leaves a zone open at roughly 53.7k. So we are to expect more downward movement in price. However, this could very well wait until we see the price going back all the way to the top of around $67-72k. If I must pick a direction, I think it will go lower. There is no point in predicting, the long-term direction is very uncertain right now. Best to take small impulses away and towards zones in lower time frames. I wish you many green pips 🤑Here is where it's going next. Once the lower zone clears, BTC might be ready to turn back up and go towards the zone at $59k.We got another impulse to move up with a zone to the bottom to clear. If the price holds at the lower zone level, we might be ready to turn up and flip poles towards the long side today.
Disclaimer
Any content and materials included in Sahmeto's website and official communication channels are a compilation of personal opinions and analyses and are not binding. They do not constitute any recommendation for buying, selling, entering or exiting the stock market and cryptocurrency market. Also, all news and analyses included in the website and channels are merely republished information from official and unofficial domestic and foreign sources, and it is obvious that users of the said content are responsible for following up and ensuring the authenticity and accuracy of the materials. Therefore, while disclaiming responsibility, it is declared that the responsibility for any decision-making, action, and potential profit and loss in the capital market and cryptocurrency market lies with the trader.