
Samer_Krema
@t_Samer_Krema

What symbols does the trader recommend buying?
Purchase History
پیام های تریدر
Filter
Samer_Krema
UP UP, For "GOOD" Profit..

Bitcoin / U.S. Dollar (Weekly) currently Price is 68,700 ... - Given the price behavior of the previous period, in the long term, it will have to reach an increase of 50-60% from the current price in order to achieve the long-term goal, which is the price of 117,111$. - The percentage of achieving this goal is estimated at 75%, based on the level of rebound, as the start will be at a rapid pace during the coming period. - Whoever has enough patience, we are talking about a profit of 46,000$ at the very least. ... After All knowledge belongs to Allah alone.
Samer_Krema
What's New About Bitcoin!!!
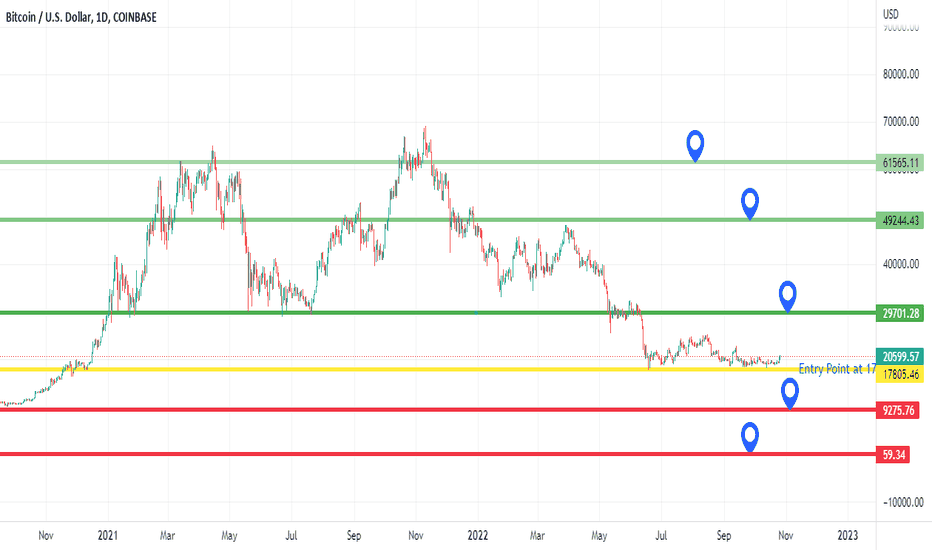
For Bitcoin, the range of price action for the medium term (3 months to 1 year) is as follows: first scenario: Current entry point to buy at 17805 TP 1 - 29701 TP 2 - 49244 TP 3 - 61565 Stop Loss - 16000 and immediate entry Sell and target price 10000.99 second scenario: Current entry point to sell at 17000 TP 1 - 9,275.99 TP 2 - 59.99 Stop Loss - 25500 and immediate entry buy and target price 41000.00note: Please exit at the first target, take profits, and request the update, as there may be new variables due to the length of time. Note that when the price reaches a target, price fluctuations may occur, which may cause a temporary or permanent reversal, so please be careful.
Samer_Krema
Two Different Scenario..
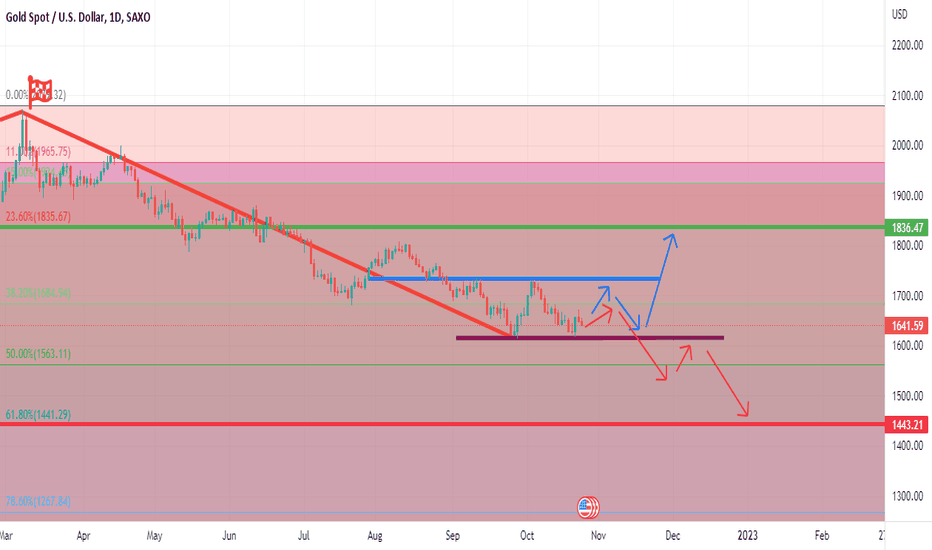
- First >> The price Will Try Harder To Break Down 1614.00 To Continue Below to 1441.99. - Second >> The price will try to break 1733.99 To Continue Above To 1835.00. ---------------------------- This is My Opinion and And Only Allah knows How That Matter Gonna Be.
Samer_Krema
تحليل قصير المدى لرمز BTCUSD
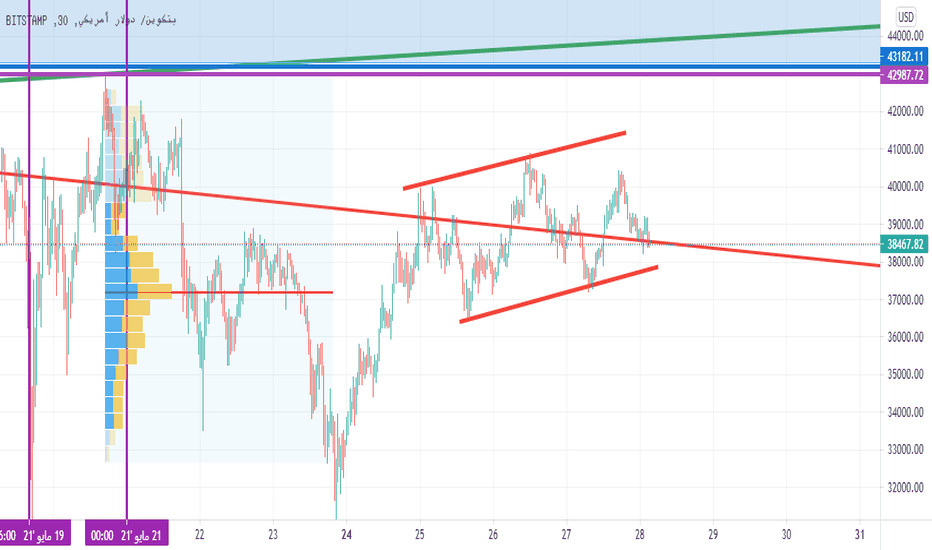
Currently, it is looking for support, and what is supposed to be in the 38,000 price area can continue the ride to the 41,200 level as a start, and if this price does not break, it will return again to 38,500-39,000. It is possible that he is searching for support to break the 37,000 level and close below it. Here he fails to rise to 40,000, and it becomes possible that he meets the calm levels or one of them: - 35,500 - 33,800 - 32,400
Samer_Krema
تحليل متوسط إلى قصير المدى لرمز SHIBA INU / USD
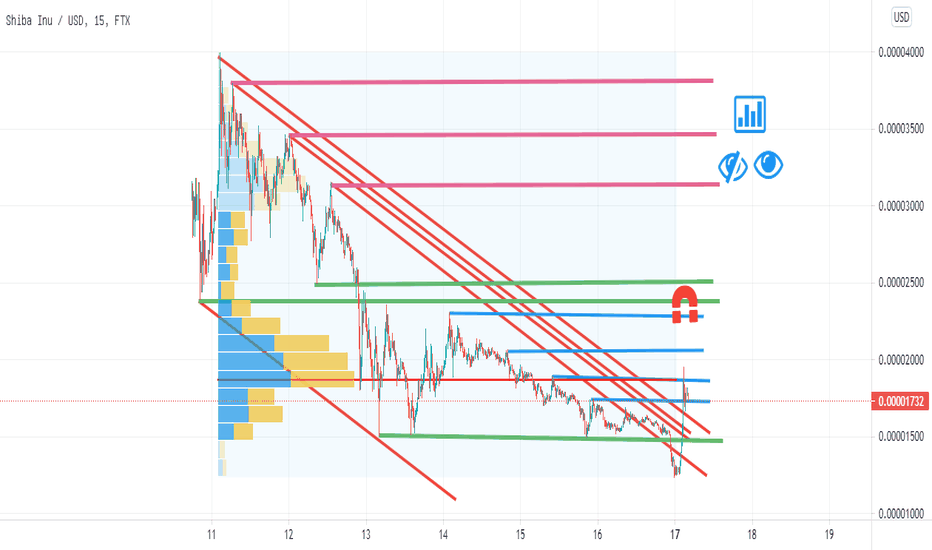
First scenario: As shown in the chart above, the price is trying to test the 0.00002379 level, which until now is considered somewhat distant because the price is looking for upward momentum from one of these two levels 0.00001638 / 0.00001527 so that it can break free and test the 0.00002379 price level comfortably and begin striving to reach the strong resistance level, which is represented by the price range between 0.00002493 and 0.00002933, and from this range the price will search for a support level, which is likely to be at the price of 0.00002500, to give it enough momentum to complete its rise to the levels: - 0.00003397 - 0.00003602 - 0.00003989 - 0.00004642 Second scenario: If the price succeeds in breaching the support level 0.00001238, then the support level will be at: - 0.00000592 - 0.00000192 One of these two levels will be enough to return the price to the 0.00001000 area as a correction initially, and if the support is strong enough, the rise will end at this support, starting an interesting upward journey. And God knows best.
Samer_Krema
تحليل متوسط إلى قصير المدى لرمز BTCUSD
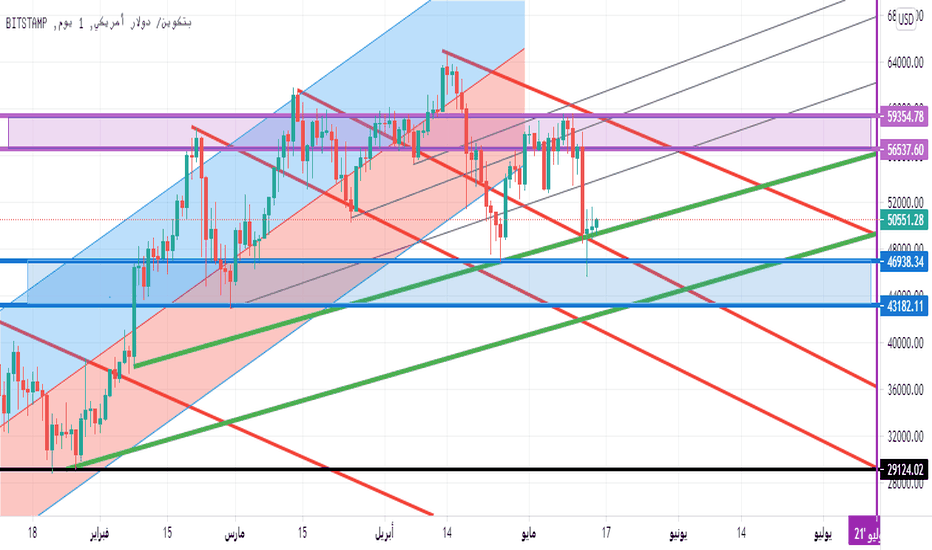
The price is trying to test the upper resistance lines at the levels: - 54300 - 55675 - 58114 If it succeeds in breaching the 59800 level, then it will continue the march upwards to test the price of 64820 and will attempt to break it on more than one occasion. However, if it fails at the first line of defense (first resistance) or one of the resistance levels here, the price will fall strongly to 48920 as the first support point to gather purchasing momentum to rise again, and unless the price obtains the appropriate momentum to rise again from this level here, it will fail and complete the decline process to search for stronger support, which is represented by the price of 44040. There is a 78% probability that this level will be broken strongly because the price is looking for very strong levels, which are: The following prices: - 41000 - 34400 - 27200 Yes, these levels are 60% likely that the price will work to reach them during the months of July and September of this year 2021, unless it succeeds in breaking the price level 64820-64895 to the upside. For traders, we recommend trading with caution, and in the case of buying, target resistance points, take profit at each level, and work to change the stop loss to reduce the risk. This is a comprehensive reading of the general situation of the BTCUSD symbol and is very brief for traders, wishing everyone success and abundant profits. {This is a preliminary analysis of the price behavior of the BTCUSD symbol, and the risks of trading in the cryptocurrency market must be taken into account and trading with caution}.
Disclaimer
Any content and materials included in Sahmeto's website and official communication channels are a compilation of personal opinions and analyses and are not binding. They do not constitute any recommendation for buying, selling, entering or exiting the stock market and cryptocurrency market. Also, all news and analyses included in the website and channels are merely republished information from official and unofficial domestic and foreign sources, and it is obvious that users of the said content are responsible for following up and ensuring the authenticity and accuracy of the materials. Therefore, while disclaiming responsibility, it is declared that the responsibility for any decision-making, action, and potential profit and loss in the capital market and cryptocurrency market lies with the trader.