
Sahrin
@t_Sahrin

What symbols does the trader recommend buying?
Purchase History
پیام های تریدر
Filter
Sahrin
Cardano Bulls Hold Control, Eyeing Breakout Above $0.95
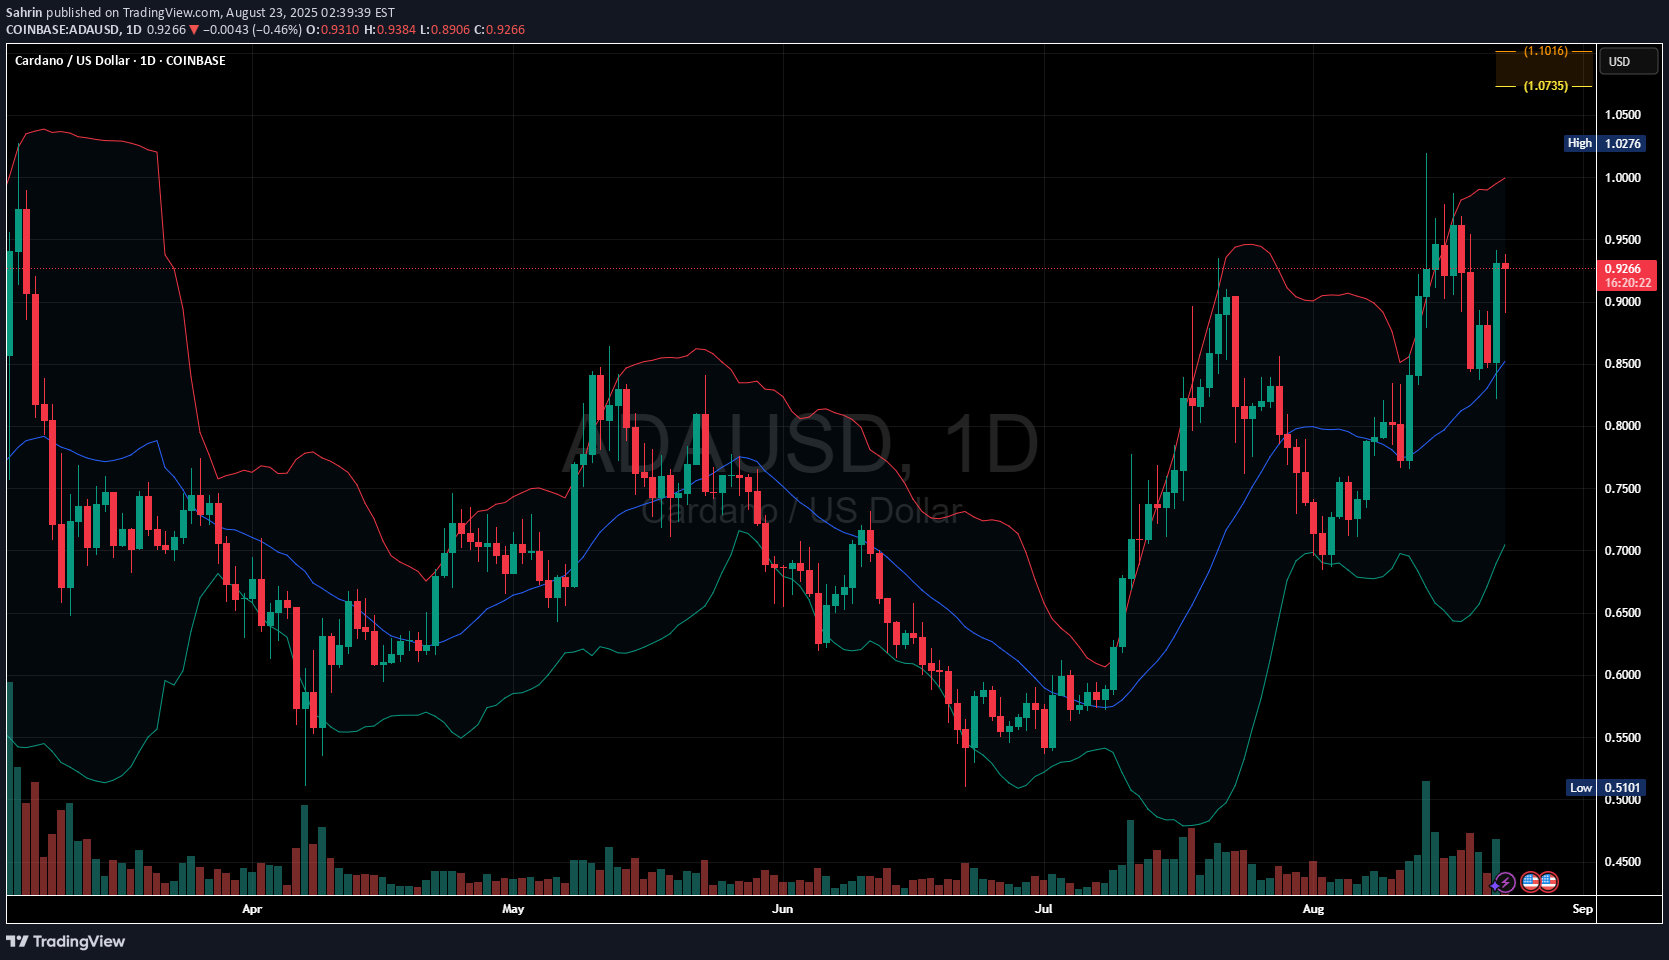
Daily close above $0.95 with volume → confirms breakout continuation. Upper BB expansion with price riding along it → indicates strong trending market. Holding above $0.85 (BB midline) → confirms bulls remain in control. ADA/USD daily chart favors a bullish bias with trend strength intact. If price can reclaim and hold above $0.95, expect a push toward $1.00–$1.05. Holding above $0.85 keeps the uptrend structure valid.
Sahrin
Bears Take Control: XLM/USD Struggles Below $0.40

Price has closed below the middle Bollinger Band (blue line), indicating bearish pressure. Recent candles show rejection wicks on top and strong red-bodied candles, signaling active selling. Support zone around $0.40 has been breached and price is struggling to reclaim it.
Sahrin
Polkadot Daily Chart: Uptrend Continues Above Mid-Band Support
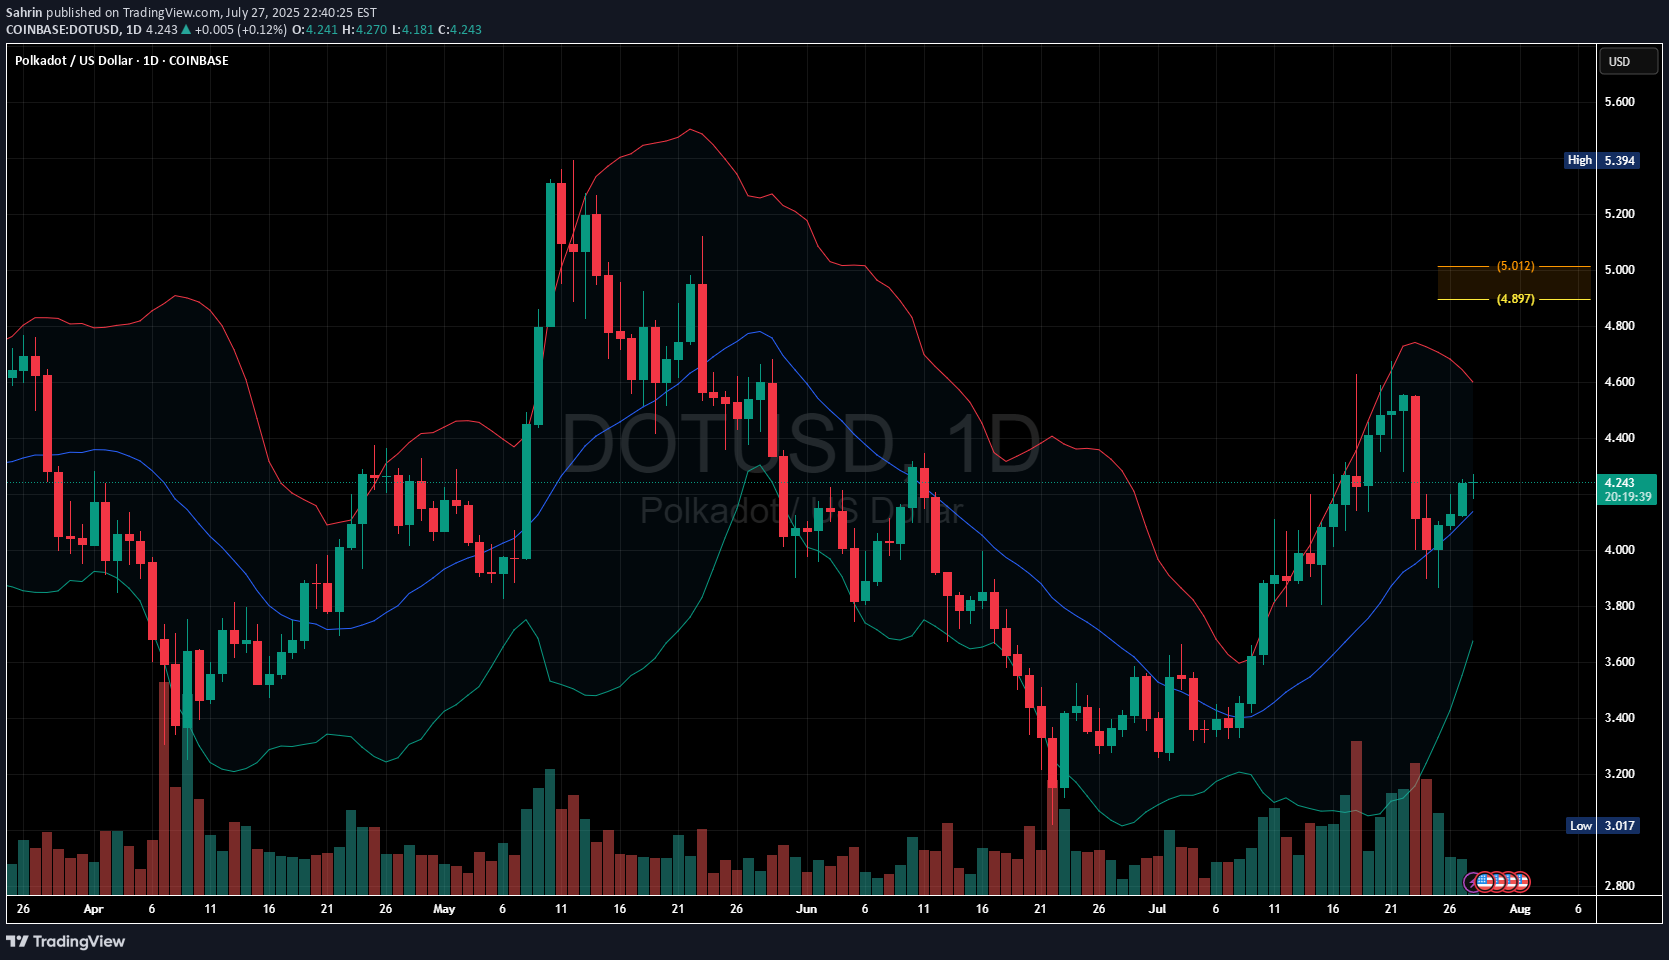
DOT is trading above the 20-day moving average (middle band of the Bollinger Bands), which is a bullish signal suggesting upward momentum. If price holds above the middle Bollinger Band, the bullish bias remains intact. A close below it could weaken the short-term bullish case. Key support: $4.20–$4.00 Key resistance: $4.60 (break above confirms continuation)
Sahrin
BCH/USD Chart Analysis: Higher Highs Fuel Bullish Outlook

Price is riding the upper half of the Bollinger Band. Price recently bounced from the middle band, a bullish continuation signal. Multiple bullish candles with small upper wicks, showing buyers are in control. Recent pullbacks have been shallow, indicating strong buying interest on dips.
Sahrin
CRV/USD Under Pressure: Breakdown Signals Bearish Continuation
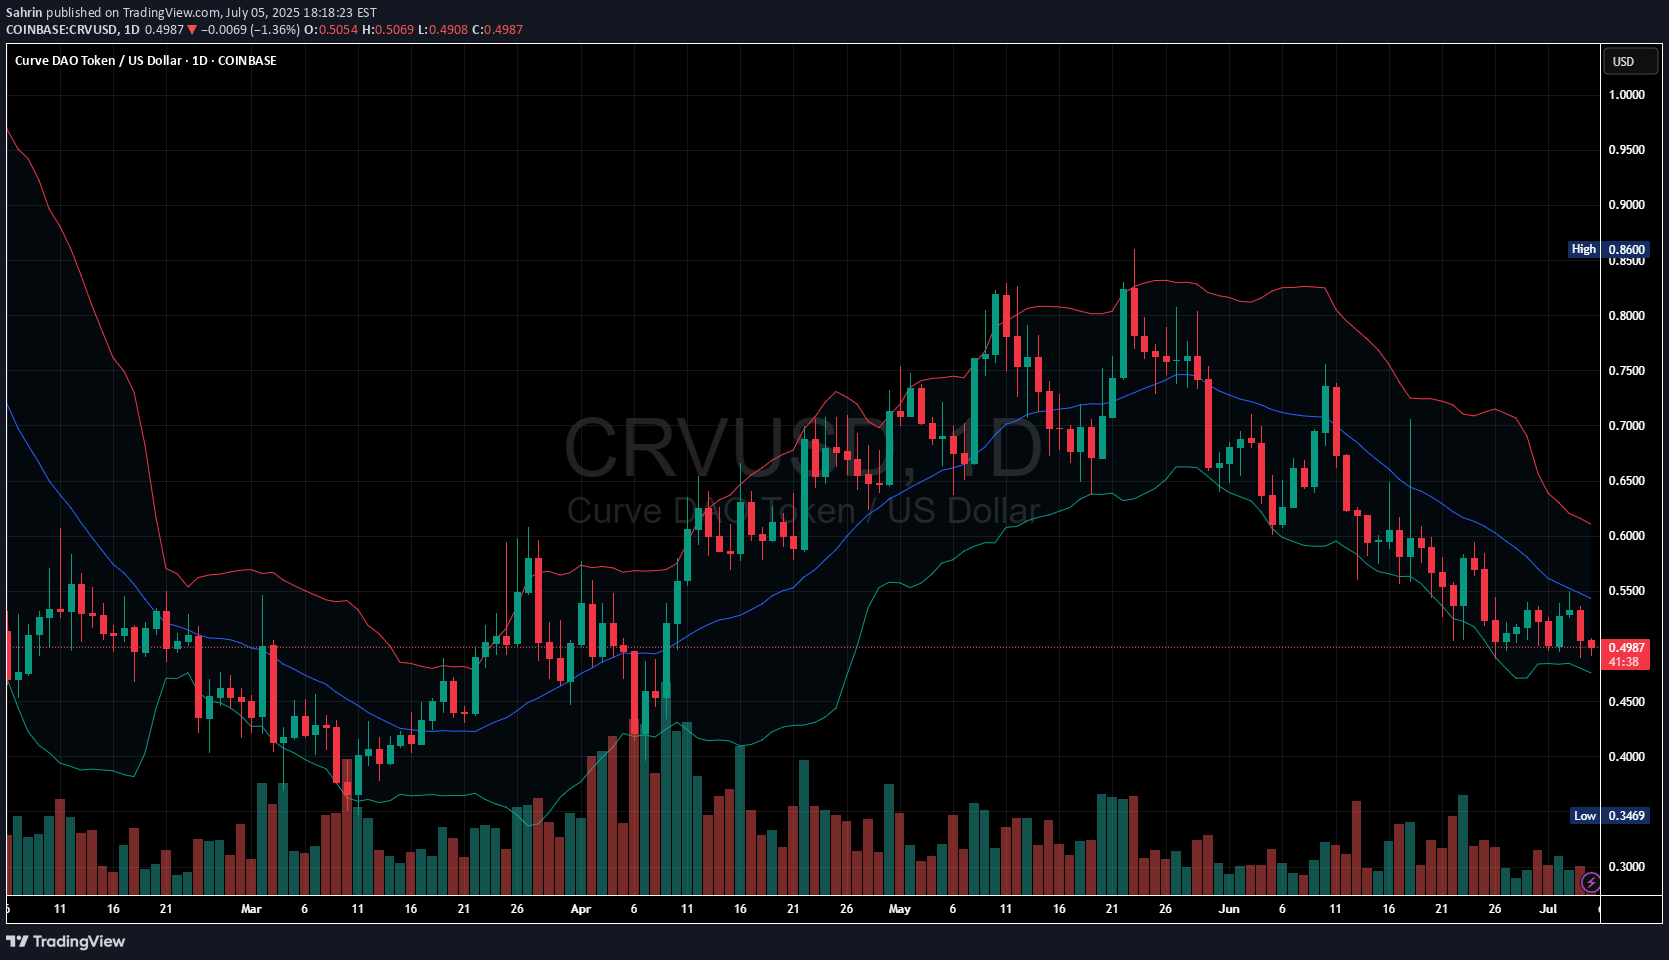
Downtrend in progress: The price is making lower highs and lower lows, confirming a bearish market structure.Price below key moving averages: The candles are trading below the midline of Bollinger Bands and the moving average, indicating sustained bearish pressure.Resistance near $0.55–$0.60: Previous support now turned resistance, tested and rejected multiple times.Support zone near $0.48–$0.45: Recent lows and potential next area of demand.
Sahrin
XRP/USD Daily Chart Signals Continued Bearish Pressure
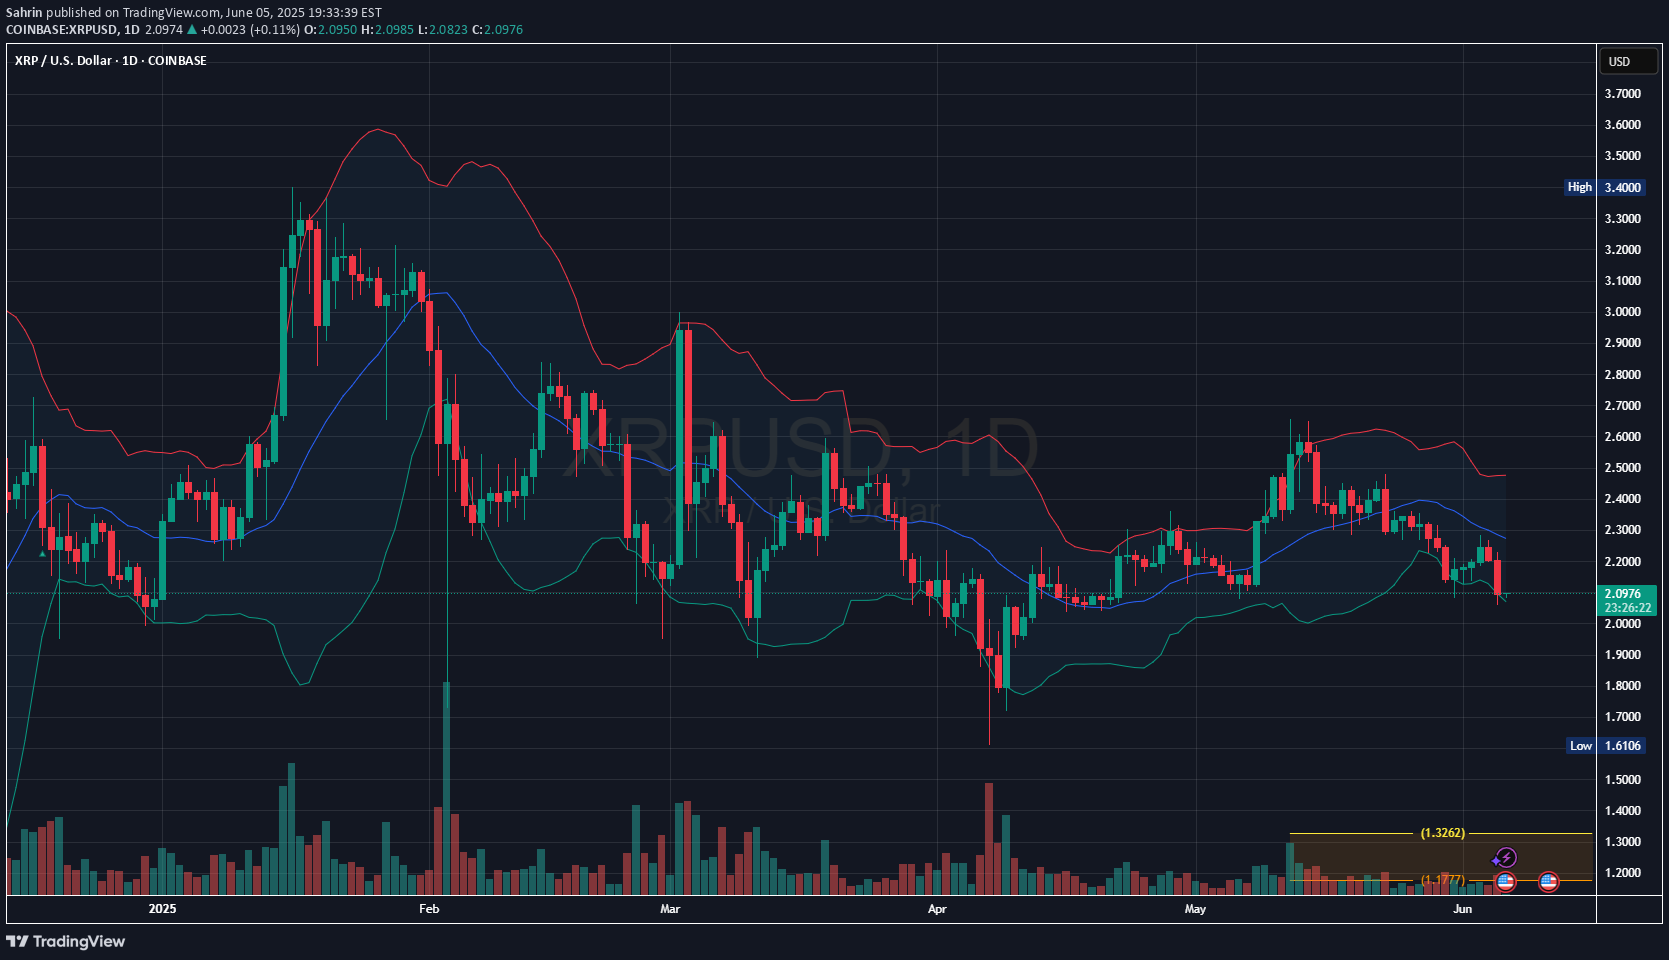
The current price is trading below the midline of the Bollinger Bands (usually a 20-day moving average), which typically indicates downward momentum.The chart shows a pattern of descending highs and descending lows, which is a classic bearish structure.The latest candle is red and pushing toward or near the lower Bollinger Band, suggesting increased selling pressure.Price recently lost the $2.20–$2.30 support zone and is now testing the $2.00 psychological level. If this level breaks, it could open downside toward $1.90 or lower.
Sahrin
Downside Risk Ahead: ETH Drops Below 20-Day MA

The last few candles show strong red bodies, suggesting selling pressure.Price has closed below the middle Bollinger Band (20-day moving average), often a trigger point for downside momentum. This suggests a transition from neutral/bullish to bearish momentum.Recent highs failed to break the previous peak near $2,900. This forms a lower high, indicating weakening buying strength.
Sahrin

Sahrin
Solana Price Analysis: Bears in Control, Is a Rebound Possible ?

The price is trading below the midline (moving average) of the Bollinger Bands.Lower highs and lower lows indicate a downtrend.Immediate Support: Around $120 (lower Bollinger Band)Volume appears moderate, with some increasing spikes during price drops, suggesting strong selling pressure.
Sahrin
Bearish Pressure with Key Resistance at $1.00

The price is trading in the lower half of the Bollinger Bands, suggesting weakness.Support Levels: Around $0.85 - $0.90 (Recent lows)Resistance Levels: Around $1.00 - $1.10 (Bollinger mid-band & psychological level)Bearish Bias: The price remains below the moving average and in the lower Bollinger Band range.Potential Reversal: If price breaks above $1.00 with increasing volume, it could signal an uptrend reversal.Synthetix Network Token Faces Rejection at Mid-Band – Bear Trend Intact
Disclaimer
Any content and materials included in Sahmeto's website and official communication channels are a compilation of personal opinions and analyses and are not binding. They do not constitute any recommendation for buying, selling, entering or exiting the stock market and cryptocurrency market. Also, all news and analyses included in the website and channels are merely republished information from official and unofficial domestic and foreign sources, and it is obvious that users of the said content are responsible for following up and ensuring the authenticity and accuracy of the materials. Therefore, while disclaiming responsibility, it is declared that the responsibility for any decision-making, action, and potential profit and loss in the capital market and cryptocurrency market lies with the trader.