
SMC_Trading_Point
@t_SMC_Trading_Point

What symbols does the trader recommend buying?
Purchase History
پیام های تریدر
Filter
SMC_Trading_Point
تحلیل تکنیکال طلا: بازی نقدینگی، ریزش ناگهانی و مسیر صعودی بعدی!
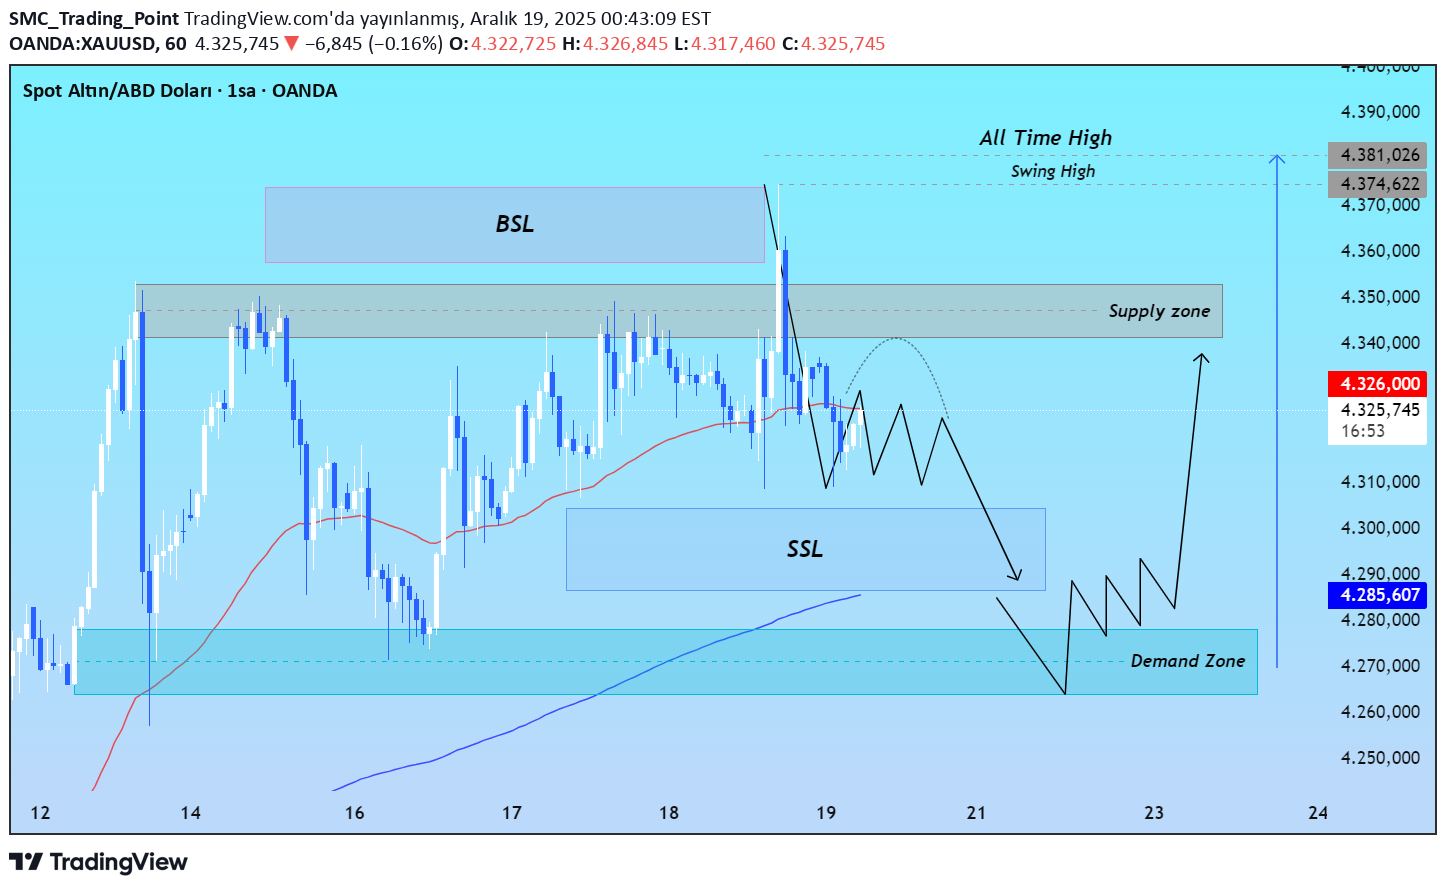
Dün Altın, alış yönlü likiditeyi (BSL) aldıktan sonra sert şekilde düştü ve güçlü satış baskısı gösterdi. Bu hareket, önceki zirvelerin üzerindeki stopları temizledi ve fiyatın daha aşağı seviyelere inmesini sağladı. Bugün Altın’ın satış yönlü likiditeyi (SSL) hedeflemesi ve direnç üzerindeki stopları toplaması muhtemel. SSL alındıktan sonra fiyatın talep bölgesine doğru düşmesi ve burada alıcıların tepki vermesi beklenebilir. Talep bölgesinden sonra Altın, piyasa yapısına uygun şekilde yukarı yönlü hareketine başlayabilir. İlk hedef dünün swing high seviyesi, ardından tüm zamanların en yüksek seviyesi olabilir. Momentum devam ederse, fiyat daha da yukarı çıkarak yeni likidite alanları oluşturabilir. Bu yapı, klasik SMC davranışını gösterir: önce likidite alınır, sonra trend devam eder. Bu paylaşım eğitim ve öğrenme amaçlıdır, yatırım tavsiyesi değildir.
SMC_Trading_Point
Gold Market Structure and Key Liquidity Zones
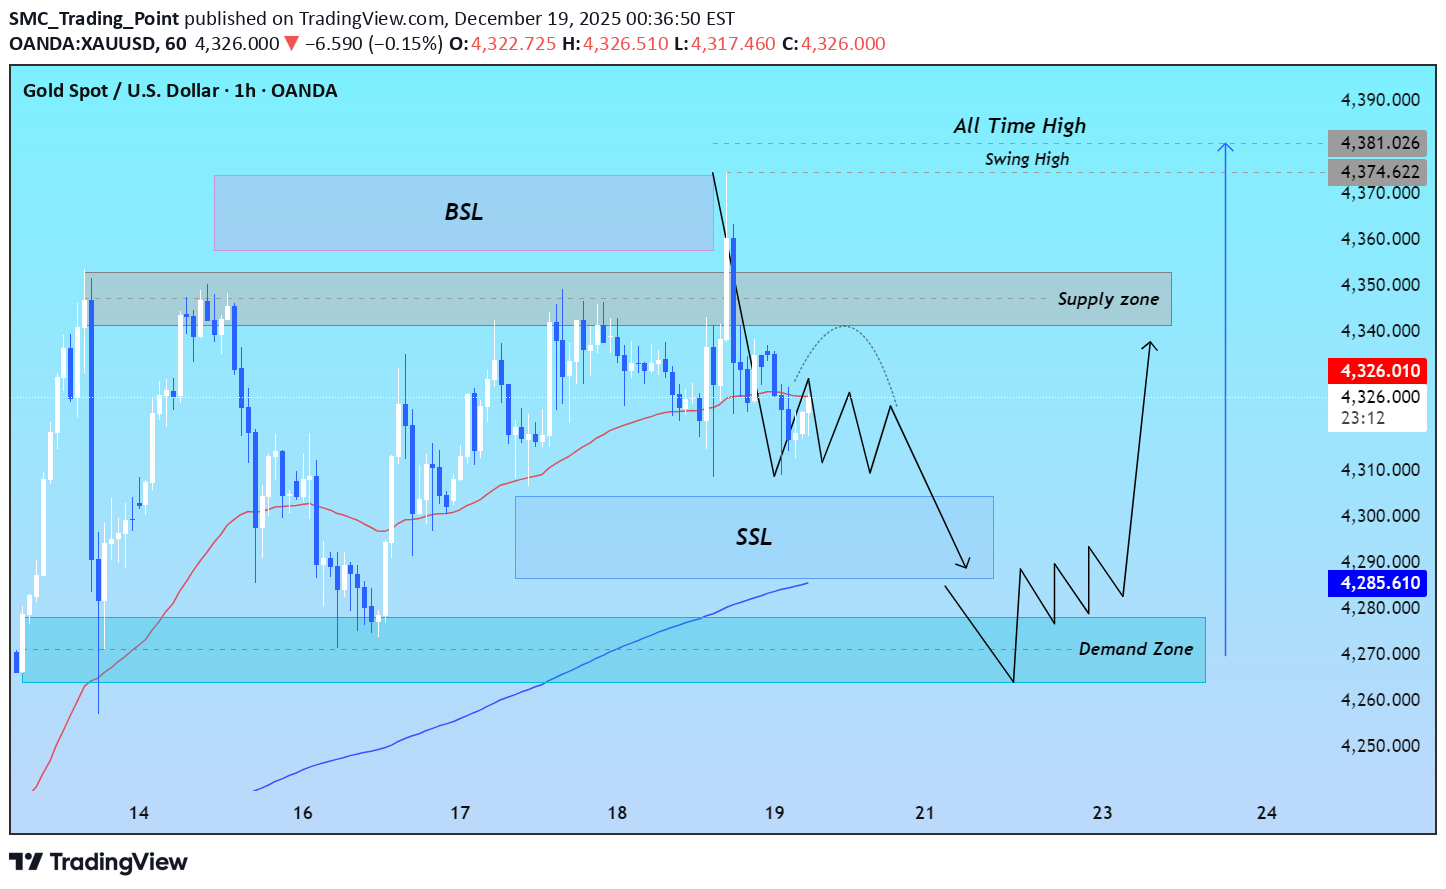
Yesterday, Gold grabbed the buy-side liquidity (BSL) and dropped sharply, showing strong selling pressure. This move cleared the stops above the previous highs and allowed price to reach lower levels. Today, Gold is likely to target the sell-side liquidity, collecting stops above resistance. After grabbing the sell-side liquidity (SSL), it may drop toward the demand zone, where buyers are expected to react. From the demand zone, Gold could begin its upward journey, respecting market structure. The first target would be yesterday’s swing high, followed by the all-time high. If momentum continues, Gold could move even higher, creating new liquidity pools above. This pattern highlights classic SMC behavior _ liquidity grabs first, then trend continuation. Traders should observe these key levels and structure for potential high-probability moves. This is for educational and learning purposes not trading advice.
SMC_Trading_Point
BTCUSDT Trend Çizgisinin Altında Ayı Baskısı
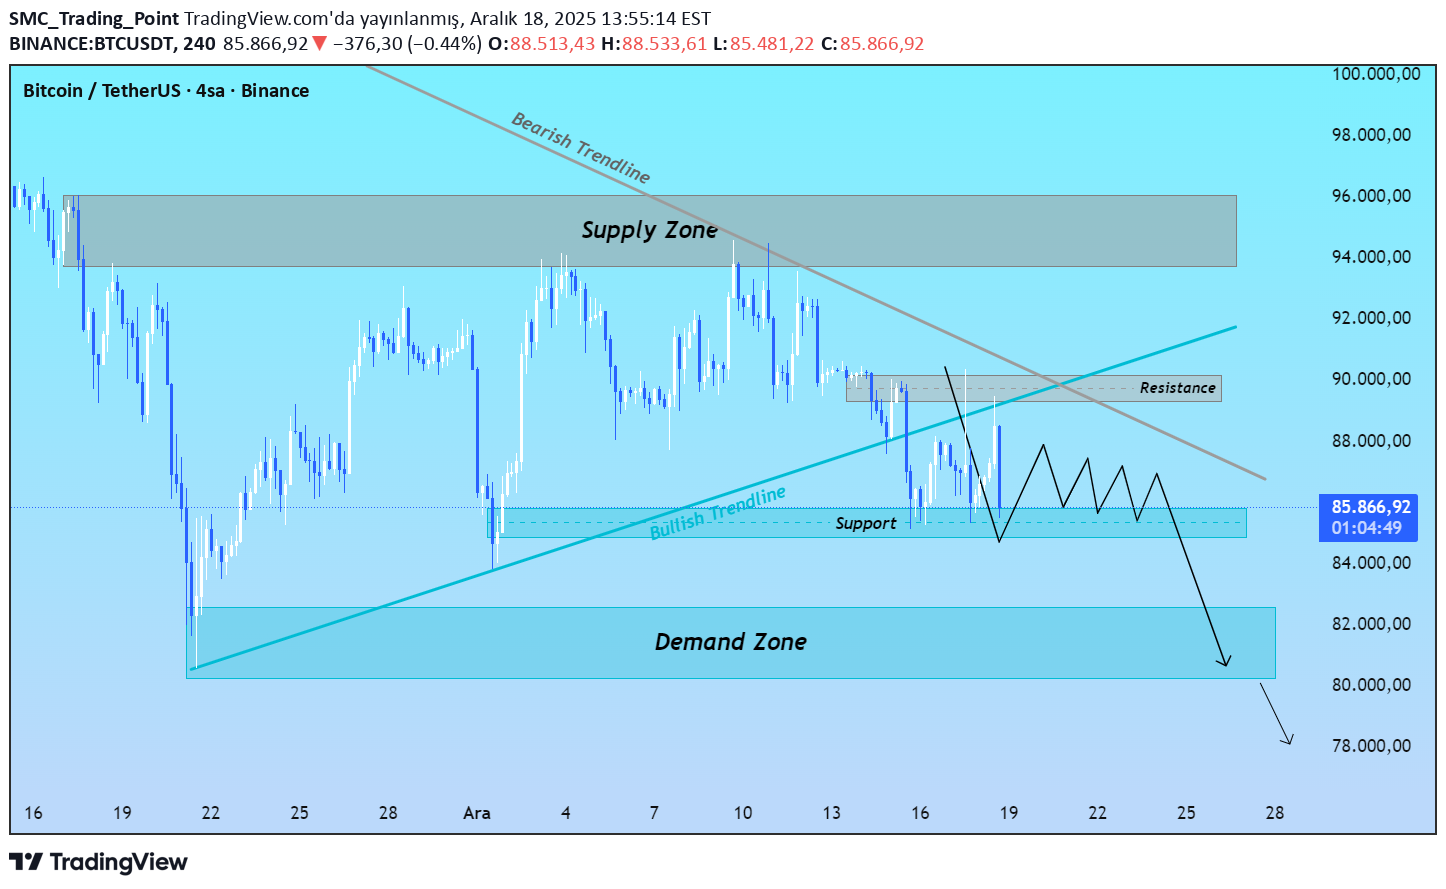
Bitcoin kısa bir yükselişten sonra dirençle karşılaştı ve düşmeye başladı. Ardından küçük bir geri çekilme yaşadı, ancak ayı baskısı hâlâ güçlü. Fiyat zaten yükseliş trend çizgisinin altında işlem görüyor, bu da ayı momentumunu güçlendiriyor. Şu anda fiyat, zayıf görünen ve kırılma olasılığı yüksek olan küçük bir desteği test ediyor. Bu destek kırılırsa, Bitcoin’in yakınlardaki talep bölgesine doğru düşmesi bekleniyor. Talep bölgesi geçici destek sağlayabilir ve tutarsa küçük bir sıçrama görebiliriz. Ancak talep bölgesi kırılırsa, fiyat muhtemelen daha düşük seviyelere düşmeye devam edecek. Genel piyasa yapısı, daha düşük tepeler ve dipler oluşturarak ayı momentumunu gösteriyor. Trader’lar satış pozisyonu açmadan önce desteğin net bir şekilde kırılmasını izlemeli. Genel olarak Bitcoin, düşüş trendini sürdürme konusunda güçlü sinyaller veriyor, ancak önemli seviyelerdeki tepkiler düşüşün yavaşlayıp yavaşlamayacağını belirleyecek. Bu yalnızca eğitim ve öğrenim amaçlıdır: Piyasa davranışını Smart Money Concepts ile anlamak içindir ve yatırım tavsiyesi değildir.
SMC_Trading_Point
BTCUSDT Bearish Pressure Below Trend Line
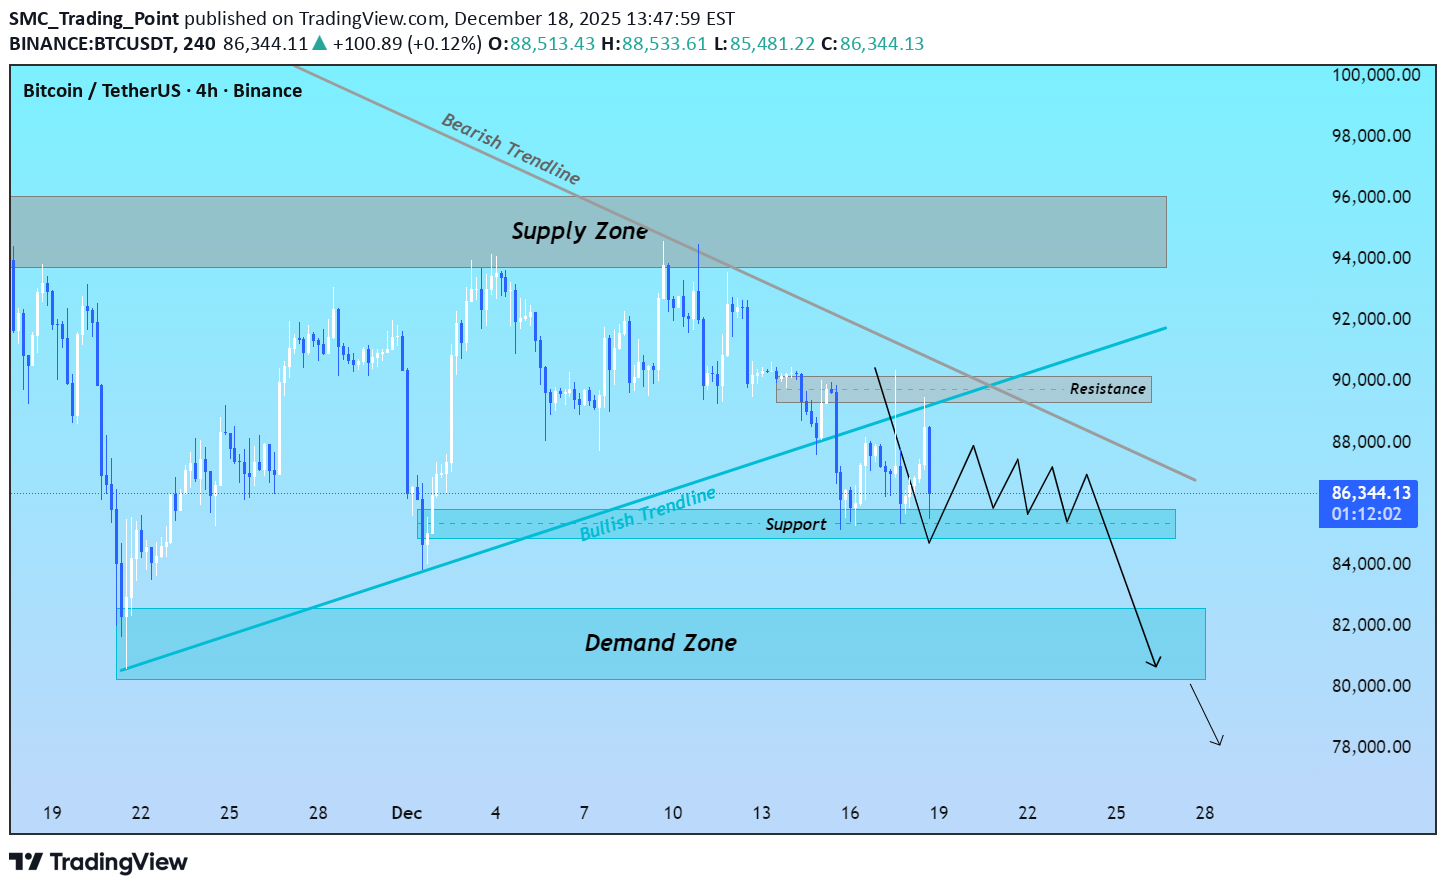
Bitcoin has recently faced resistance and started dropping after a short rally. It then made a small pullback, but the bearish pressure remains strong. Price is already trading below the bullish trend line, which further indicates bearish momentum. Price is currently testing a minor support, which looks weak and likely to break. Once this support breaks, Bitcoin is expected to fall further toward the nearby demand zone. The demand zone may act as temporary support, and if it holds, we could see a small bounce. However, if the demand zone fails, price will likely continue dropping to lower levels. The overall market structure shows lower highs and lower lows, indicating bearish momentum. Traders should watch for a clear break of support before entering a sell position. Overall, Bitcoin is showing strong signs of continuing its downtrend, but reactions at key levels will determine whether the drop slows or accelerates. This is for educational and learning purposes only: To understand market behavior with Smart Money Concepts and is not trading advice.
SMC_Trading_Point
Altın – Trend Çizgisi Kırılmadan Önce Likidite Taraması?
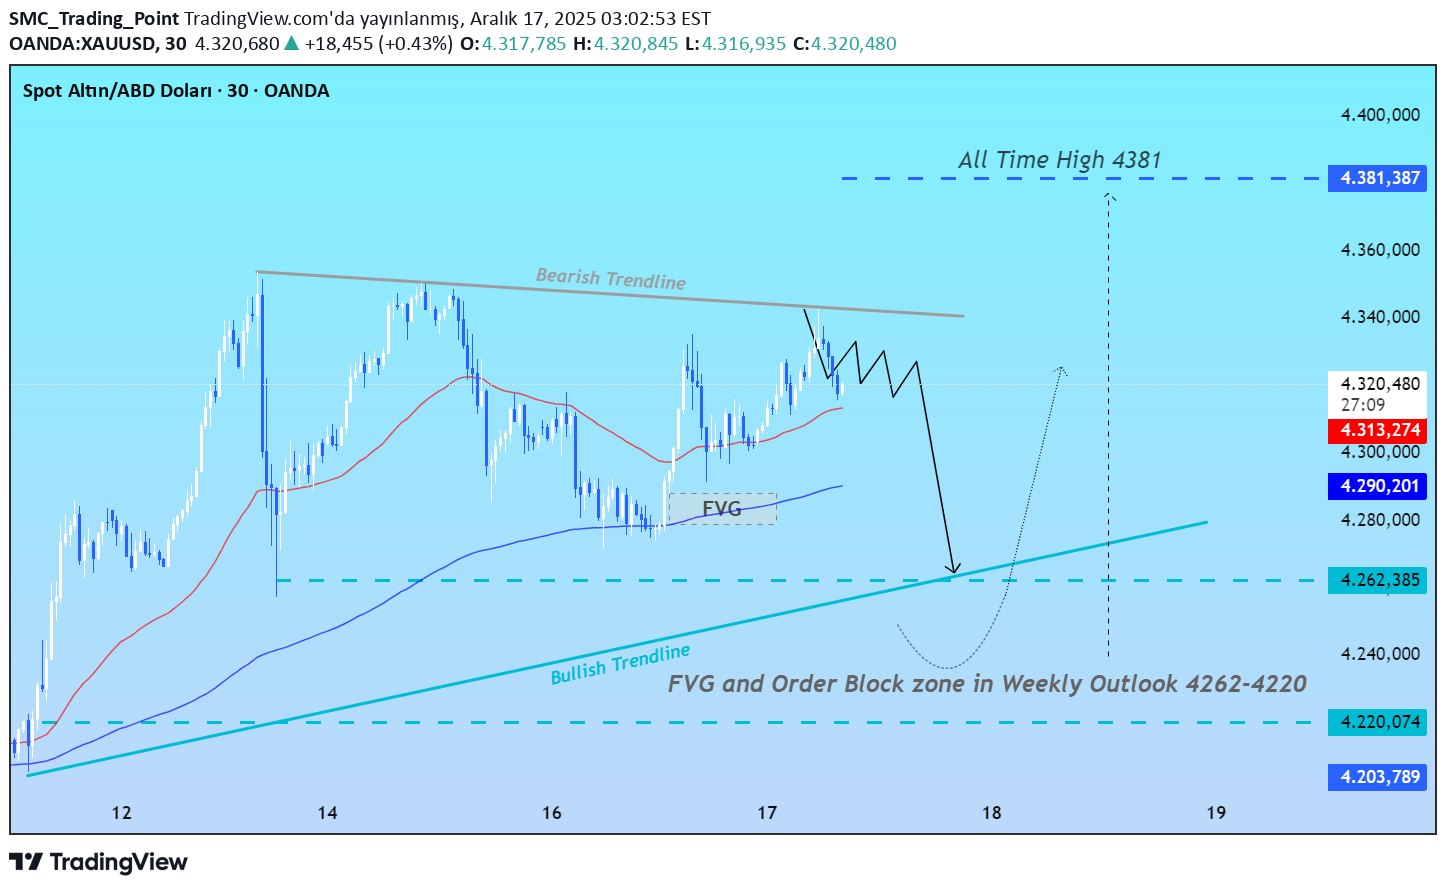
Altın fiyatı şu anda düşüş trend çizgisine tepki veriyor. Bu çizgi geçmişte fiyatı birkaç kez reddettiği için güçlü bir direnç oluşturuyor. Smart Money Concept (SMC) perspektifinden, fiyat yükselmeden önce muhtemelen alt seviyelerde likidite arayabilir. Yakın zamanda oluşan FVG (Fair Value Gap) 4288–4280 arası bu geri çekilme için olası bir bölge. Bu seviyenin altında, Haftalık Görünüm (Weekly Outlook) FVG ve order block alanı bulunuyor, yaklaşık 4262–4220. Bu bölge bekleyen likiditeyi içerebilir. Fiyat bu bölgeye gelerek stopları süpürebilir ve yükseliş trend çizgisini test edebilir. Fiyat bu bölgelerden güçlü bir yükseliş tepkisi gösterirse, bu güç göstergesi olabilir. Böyle bir durumda fiyat düşüş trend çizgisini kırmayı deneyebilir ve daha yüksek seviyelere ilerleyebilir. Bu analiz piyasa yapısı, likidite ve fiyat tepkilerine dayanır, tahmin değildir. Her zaman kritik bölgelerde teyit bekleyin. Eğitim amaçlıdır. Finansal tavsiye değildir.
SMC_Trading_Point
الذهب: آیا قبل از شکست روند، شکار نقدینگی در راه است؟
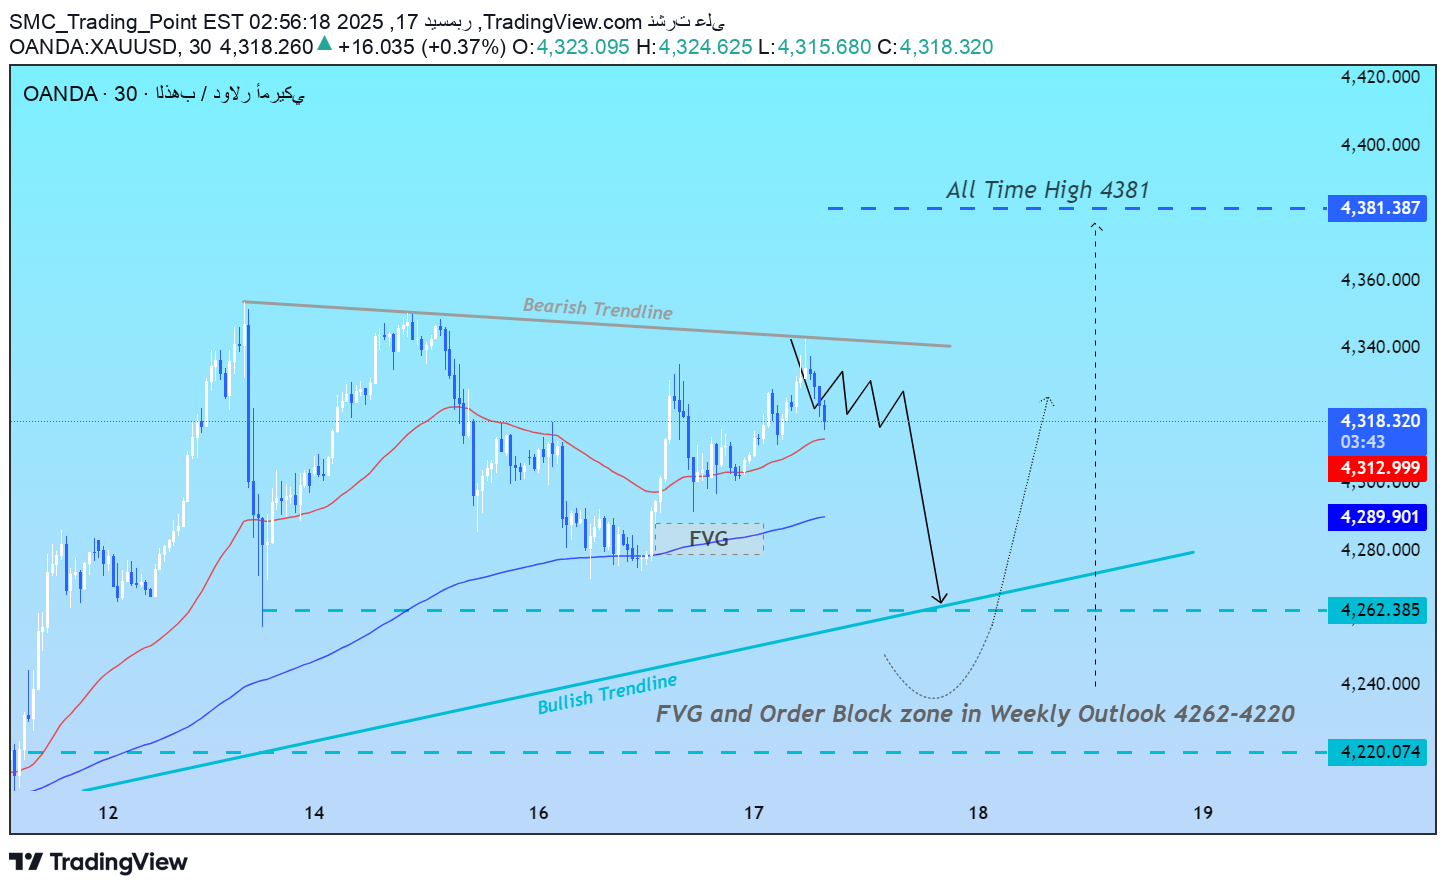
سعر الذهب یتفاعل حالیاً مع خط اتجاه هابط، والذی سبق وأن رفض السعر عدة مرات، مما یجعله مقاومة قویة. من منظور Smart Money Concept (SMC)، قد یبحث السعر أولاً عن السیولة أسفل المستوى قبل أی حرکة صاعدة. من المحتمل أن یعود السعر إلى Fair Value Gap (FVG) حول 4288–4280. أسفل هذا النطاق، توجد FVG وOrder Block من التحلیل الأسبوعی عند 4262–4220. قد یحتوی هذا النطاق على سیولة متراکمة. یمکن أن یتحرک السعر إلى هذا المستوى لـ تفعیل الستوبات واختبار دعم خط الاتجاه الصاعد. إذا أظهر السعر رد فعل صعودی قوی من هذه المناطق، فقد یشیر ذلک إلى قوة. فی هذه الحالة، قد یحاول السعر اختراق خط الاتجاه الهابط والمتابعة نحو مستویات أعلى. هذا التحلیل یعتمد على هیکل السوق، السیولة، وردود فعل السعر، ولیس تنبؤًا. دائمًا انتظر تأکید السعر عند المناطق الرئیسیة. للأغراض التعلیمیة فقط. لیست نصیحة مالیة.
SMC_Trading_Point
طلا: آیا قبل از شکست خط روند، نقدینگی جارو میشود؟ (تحلیل اسمارت مانی)
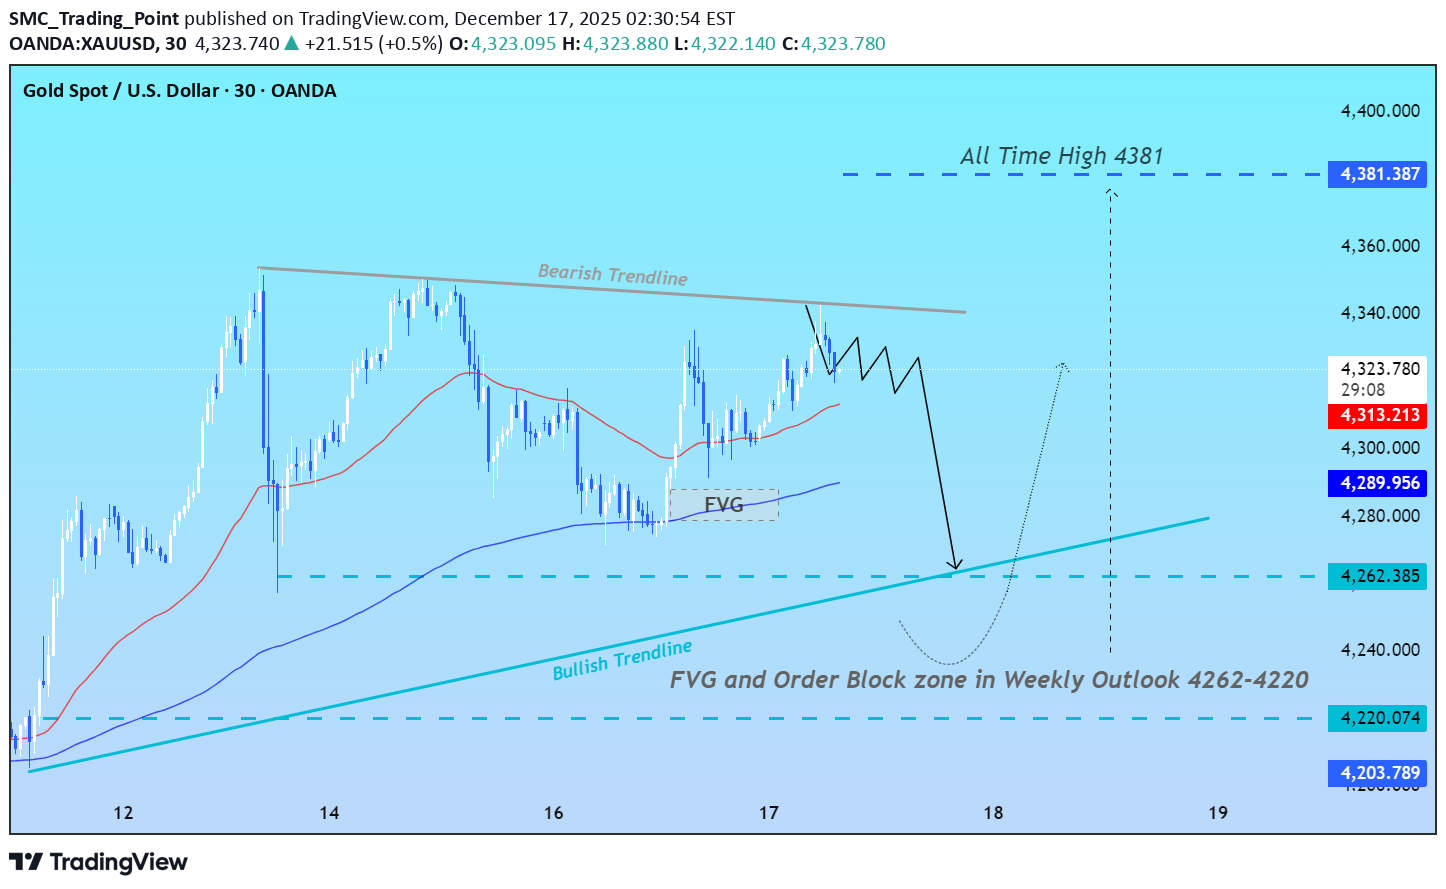
Gold price is reacting to a bearish trend line that has rejected price multiple times before. This makes the area a strong resistance. From a Smart Money Concept (SMC) perspective, price may look for liquidity below before any upside move. A pullback toward the recent Fair Value Gap (FVG) around 4288–4280 is possible. Below this zone, there is another FVG and order block area from the Weekly Outlook, located around 4262–4220. This area may contain resting liquidity. Price could move into this zone to sweep stops and test the bullish trendline support. If price shows a strong bullish reaction from these levels, it could signal strength. In that case, price may attempt to break the bearish trendline and continue toward higher levels. This idea is based on market structure, liquidity, and price reaction, not prediction. Always wait for confirmation. Educational idea only. Not financial advice.
SMC_Trading_Point
الذهب يتفاعل من مستوى الدعم الرئيسي
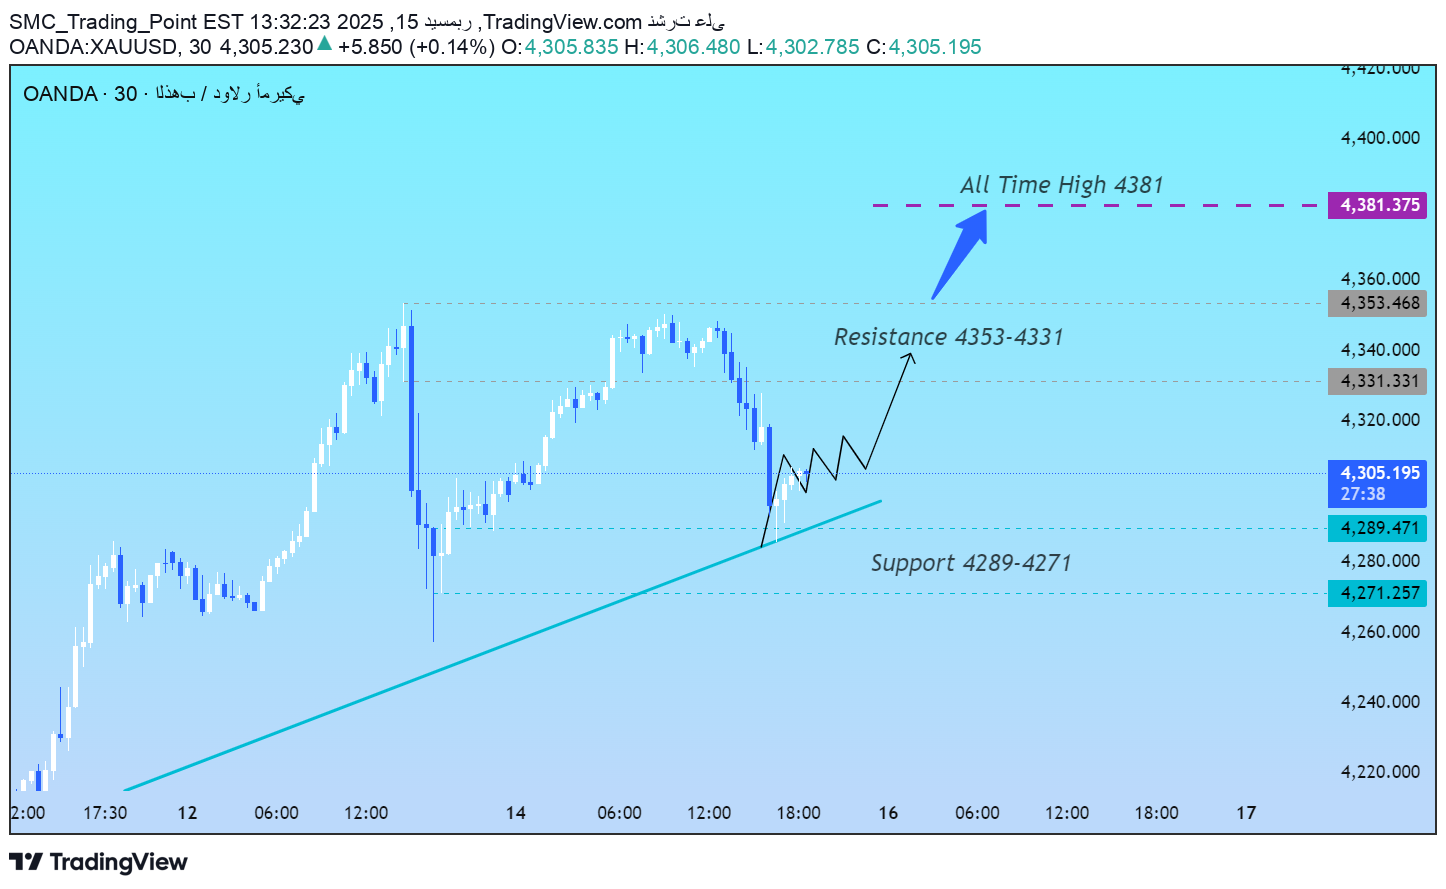
یتفاعل الذهب حالیًا من منطقة الدعم 4289–4271، والتی تظهر اهتمام المشترین وتعمل کمنطقة طلب. قد یقوم السعر باختبار هذا الدعم مرة أخرى لامتصاص الأوامر المتبقیة قبل أن یتحرک للأعلى. إذا تم الحفاظ على الدعم، فقد یستمر الزخم الصاعد، مما یدفع السعر نحو منطقة المقاومة 4331–4353. عند المقاومة، قد یتباطأ السعر أو یشهد تصحیحًا صغیرًا، وهذا أمر طبیعی فی هیکل السوق. الحرکة الصاعدة الواضحة فوق هذه المقاومة تشیر إلى القوة وقد تفتح الطریق نحو مستویات أعلى بالقرب من الارتفاع السابق 4381. بشکل عام، ستعتمد الحرکة التالیة على کیفیة تصرف السعر حول هذه المناطق الرئیسیة، وینبغی على المتداولین مراقبة ردود الفعل عند الدعم والمقاومة لفهم الاتجاهات المحتملة فی المستقبل. تمت المشارکة لأغراض تعلیمیة وتثقیفیة فقط. لیست نصیحة مالیة.
SMC_Trading_Point
Altın Ana Destekten Tepki Veriyor
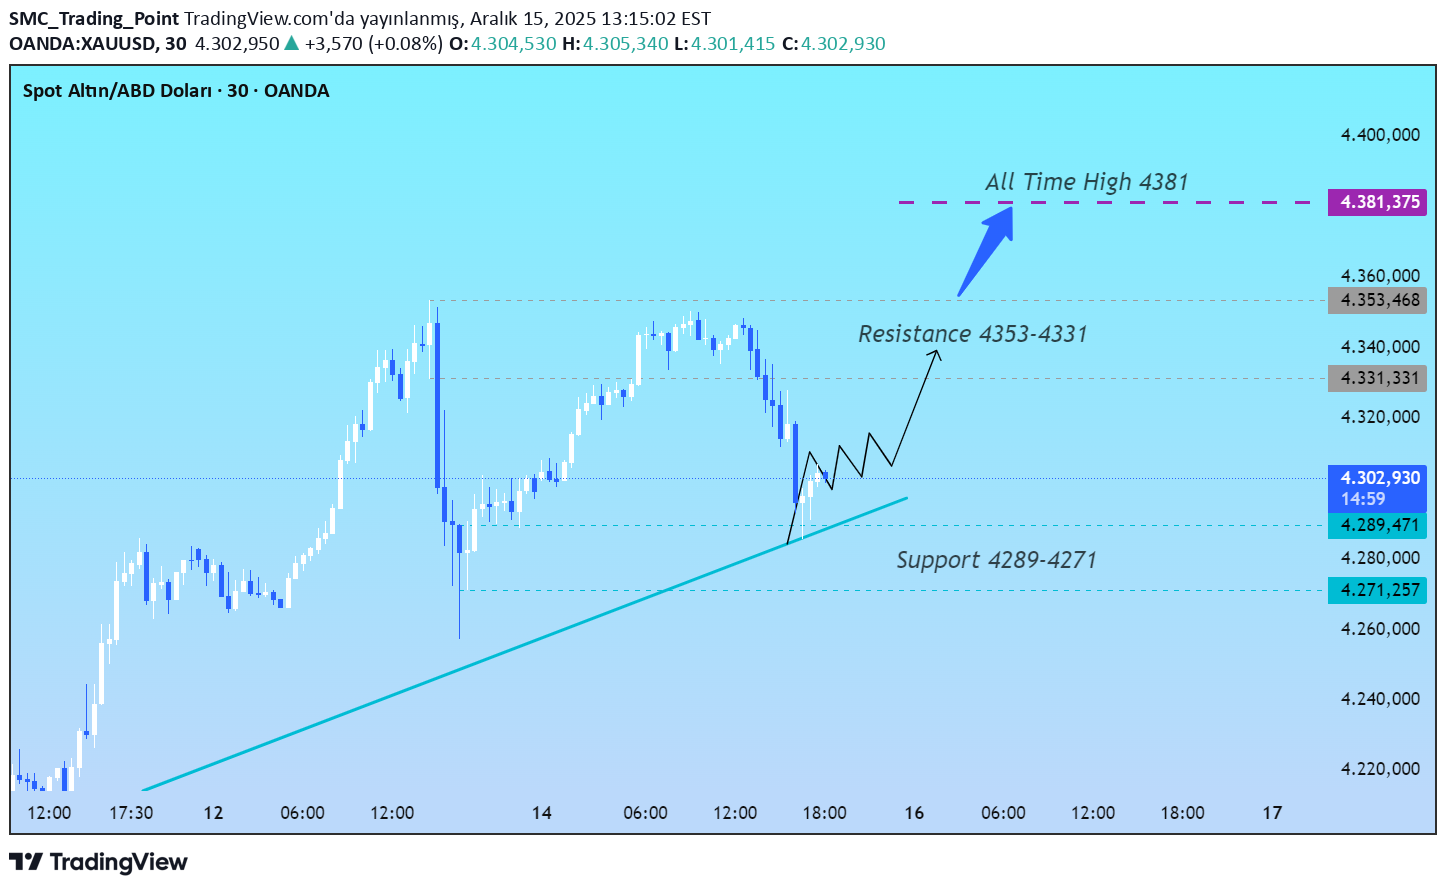
Altın şu anda 4289–4271 destek bölgesinden tepki veriyor ve bu alan alıcı ilgisini göstererek bir talep bölgesi olarak çalışıyor. Fiyat, yukarı yönlü hareket etmeden önce kalan emirleri temizlemek için bu desteği yeniden test edebilir. Destek seviyesinin korunması halinde, yükseliş momentumu devam edebilir ve fiyatı 4331–4353 direnç bölgesine taşıyabilir. Dirençte fiyat yavaşlayabilir veya küçük bir geri çekilme yaşayabilir, bu piyasa yapısında normaldir. Bu direncin üzerinde temiz bir kırılma, güç göstergesi olur ve fiyatın 4381 önceki zirve seviyesine doğru hareket etmesini sağlayabilir. Genel olarak, sonraki yön hareketi, fiyatın bu kritik bölgelerde nasıl davrandığına bağlı olacak ve yatırımcılar, destek ve direnç tepkilerini izleyerek olası trendleri değerlendirmelidir.
SMC_Trading_Point
Gold Reacting From Key Support Zone
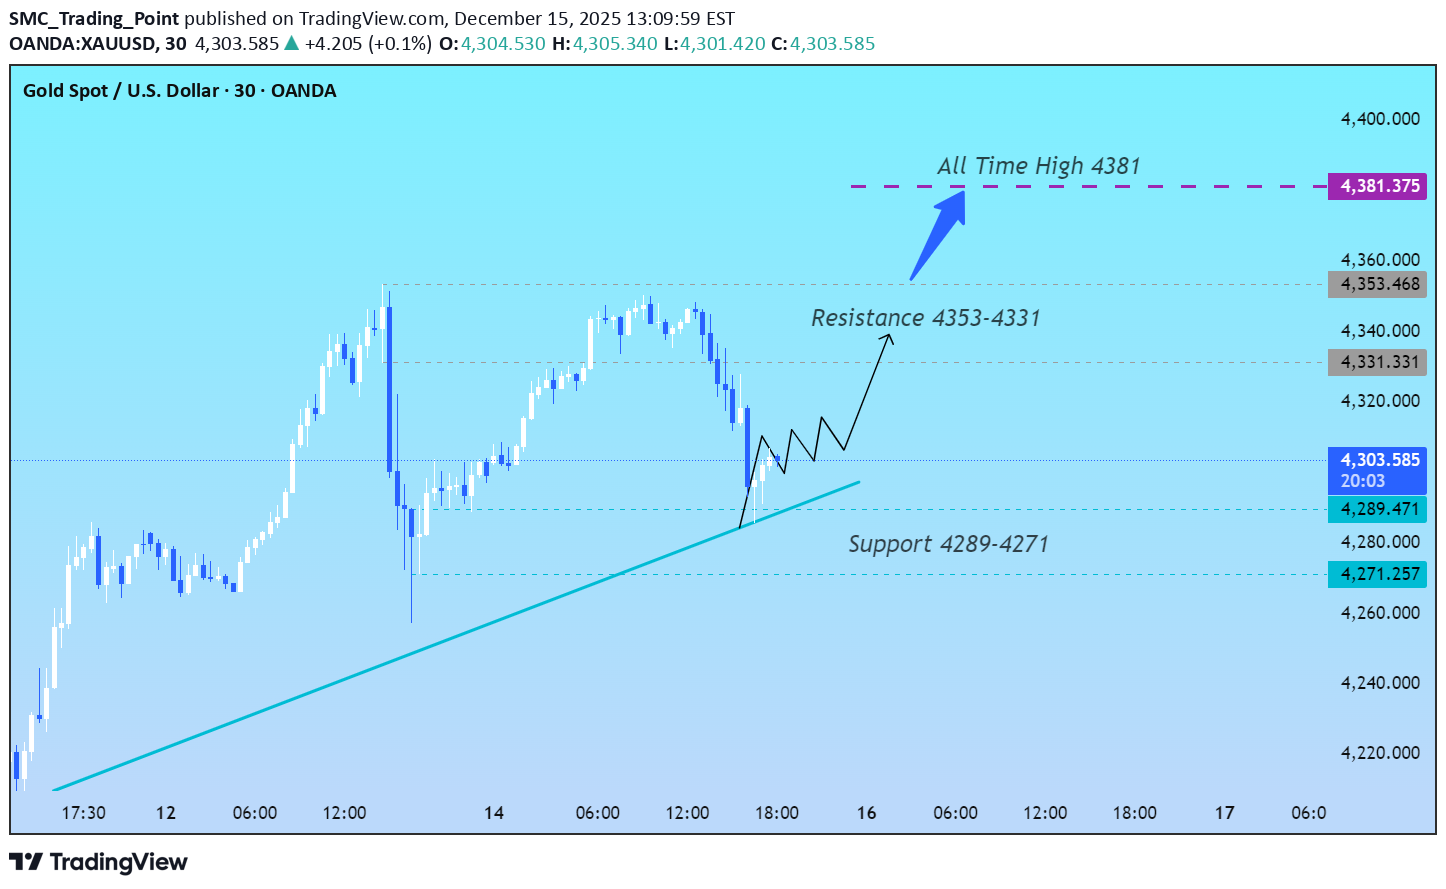
Gold is currently reacting from the 4289–4271 support zone, which is showing buying interest and acting as a demand area. The price may retest this support again to absorb remaining orders before moving higher. If the support holds, the bullish momentum could continue, pushing the price toward the 4331–4353 resistance zone. At resistance, price might slow down or experience a small pullback, which is normal in market structure. A clean move above this resistance would indicate strength and could open the path toward higher levels near the 4381 previous high. Overall, the next directional move will depend on how price behaves around these key zones, and traders should watch for reactions at support and resistance to understand potential future trends. Shared for educational and learning purposes only. Not trading advice.Gold retested the 4289–4271 support zone and showed a strong reaction, confirming buying interest. Price has now moved higher and is approaching the 4331–4353 resistance zone. A reaction or brief pullback may occur at resistance. If resistance breaks, price could continue toward higher levels near 4381. (Educational only )
Disclaimer
Any content and materials included in Sahmeto's website and official communication channels are a compilation of personal opinions and analyses and are not binding. They do not constitute any recommendation for buying, selling, entering or exiting the stock market and cryptocurrency market. Also, all news and analyses included in the website and channels are merely republished information from official and unofficial domestic and foreign sources, and it is obvious that users of the said content are responsible for following up and ensuring the authenticity and accuracy of the materials. Therefore, while disclaiming responsibility, it is declared that the responsibility for any decision-making, action, and potential profit and loss in the capital market and cryptocurrency market lies with the trader.