
SAFAR1365
@t_SAFAR1365

What symbols does the trader recommend buying?
Purchase History
پیام های تریدر
Filter
SAFAR1365
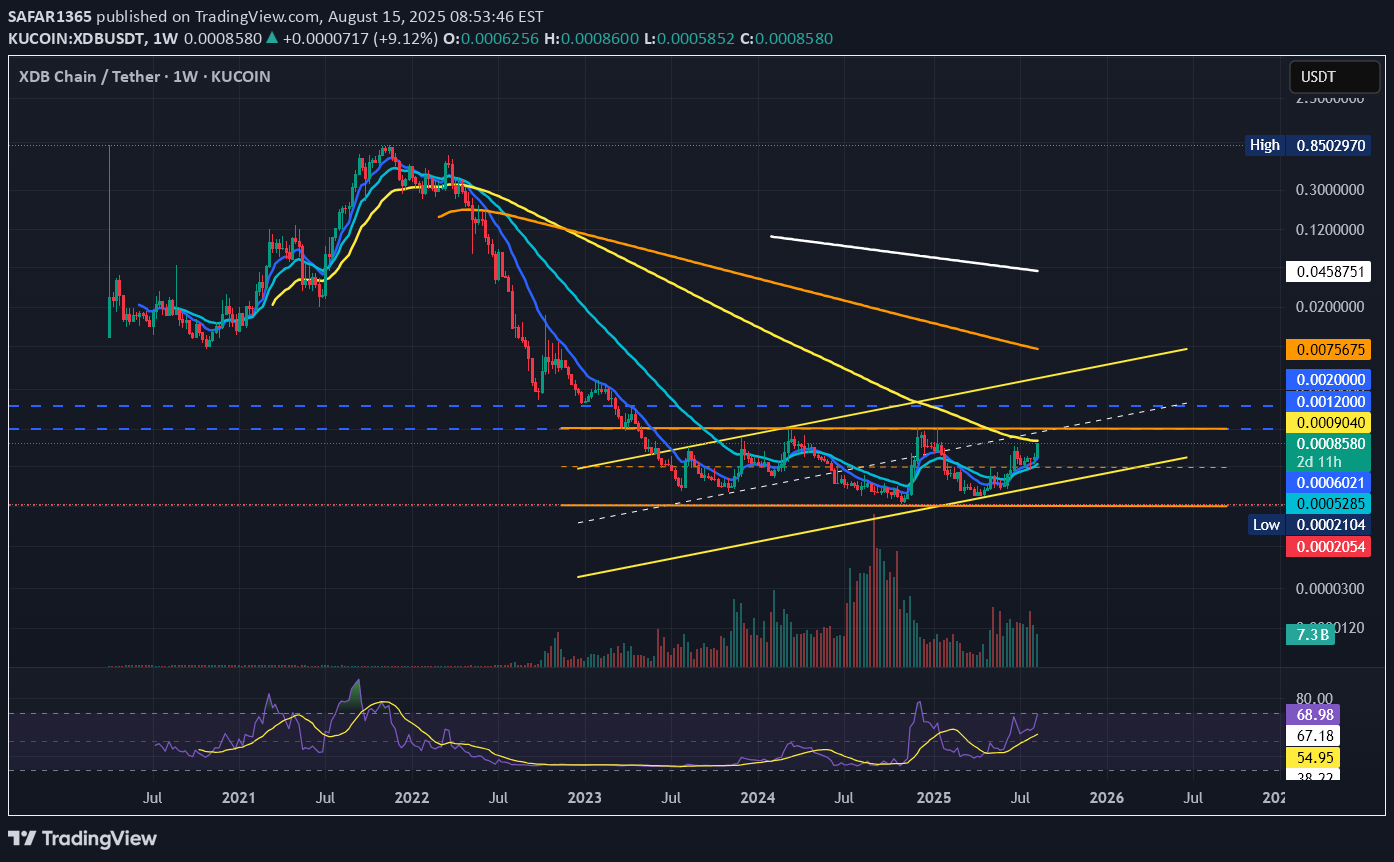
SAFAR1365
A promising comeback

XDB 1M On the monthly time frame, we are witnessing a good reversal pattern for this currency. As you can see, the static resistance is at 0.0012, as well as the dynamic resistance, the 10-moving average, which is currently at 0.0011669. Note that the time frame is monthly, and given the one-month stick plan of this currency, there is a higher possibility of an increase.
SAFAR1365
XDB 1M

Will it come ready to fly? It seems that we are ready for a strong upward movement on the monthly chart. Considering that we are at the bottom of the descending channel and the Adam and Eve pattern is visible, if the market conditions maintain their upward trend, it is possible to reach higher prices.
SAFAR1365
Is XDB ready to fly!?

Assuming that we are in the process of a 5-wave upward movement in weekly time, if the correction of wave 2 does not continue further, according to the Fibonacci lines, the targets of wave 3 are almost certain. You can also see that the EMA10 & EMA20 lines are currently acting as support and resistance.
SAFAR1365
The start of a bullish rally with a golden cross on XDB

In the daily time frame, the Golden Cross has occurred and the SMA50 (yellow line) has crossed the SMA200 (white line) upward, which can promise an upward rally for this currency. In general, it seems that if the volume increases, the conditions are suitable for price growth. Note that due to the high risk of the currency, if you buy, make sure to put a stop so that you don't suffer a loss.
SAFAR1365
Bitcoin status in monthly time frame

Bitcoin is in an ascending channel on the monthly timeframe and we are rising from the bottom of the channel In the event of a fall, EMA 10 and 20 (blue and turquoise lines at the bottom of the ascending channel and the bottom of the channel itself, currently the price is about 30,000) and also EMA 50 (yellow line, currently the price is about 25,000) is a good support zone.
SAFAR1365
Breaking the downtrend line

We see the failure of the risk of the downward trend in the monthly time frame, if the monthly candle closes and stabilizes above the trend line, it can be said that the bull market has started.
SAFAR1365
The possibility of an explosion in the price of Bitcoin

Bitcoin seems to be in an ascending channel on the monthly time frame and we are currently at the bottom of the channel. By breaking and stabilizing above the downward trend line, it can be considered a very good possibility of growth. Note that the time frame is monthly and fluctuations are normal in this time frame. The acceptance of spot bitcoin ETF by the SEC could speed up this issue.
SAFAR1365
After a long time, a bearish structural change happened for the

DigitalBits has managed to close a candle above 0.0006505 in the daily time frame and in practice it can be said that by breaking the ceiling that the new floor had created, a change in the bearish structure has happened for this currency after a long time. Our bullish scenario is still running and the price targets at this stage of the rise are marked on the chart. This analysis is a personal opinion, please do not use it as the basis of your purchase and sale without further research.
SAFAR1365
XDB (DigitalBits) 5 rising waves

If XDB (DigitalBits) wants to climb with 5 waves, such a pattern can be imagined based on Elliott waves and the target 0.0015 can be considered. The important point for researching this issue is to cross 0.0006505 because this is the ceiling price that created a new floor, and by crossing this price, its long-term bearish structure will change. This analysis is a personal opinion, please do not use it as a basis for trading without doing your own research. Please share your opinion with me.
Disclaimer
Any content and materials included in Sahmeto's website and official communication channels are a compilation of personal opinions and analyses and are not binding. They do not constitute any recommendation for buying, selling, entering or exiting the stock market and cryptocurrency market. Also, all news and analyses included in the website and channels are merely republished information from official and unofficial domestic and foreign sources, and it is obvious that users of the said content are responsible for following up and ensuring the authenticity and accuracy of the materials. Therefore, while disclaiming responsibility, it is declared that the responsibility for any decision-making, action, and potential profit and loss in the capital market and cryptocurrency market lies with the trader.