Ruthenium
@t_Ruthenium

What symbols does the trader recommend buying?
Purchase History
پیام های تریدر
Filter
Signal Type
Ruthenium
Looks to have support from the 100 daily moving average. if there is a correction to 28.5K
Ruthenium
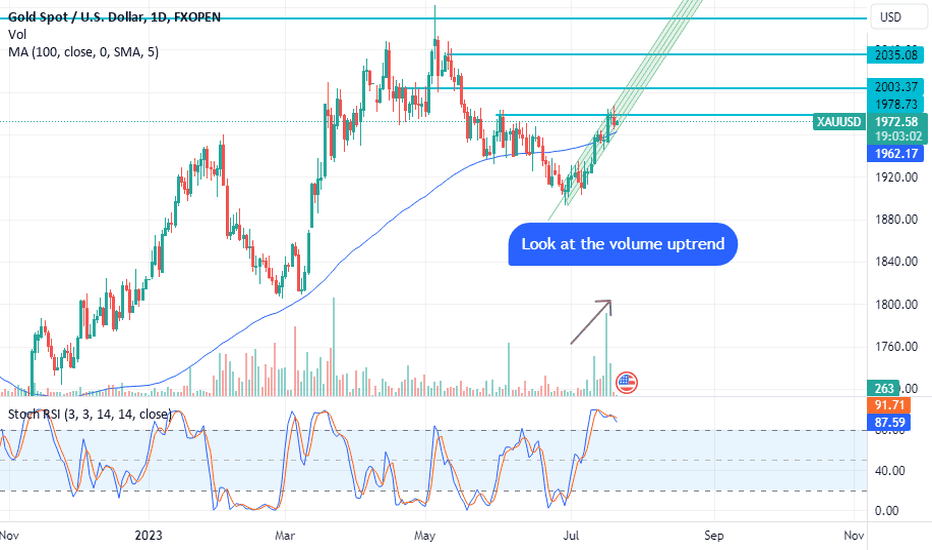
There may be resistance at the 1980 level but the 100 Daily moving average is right here asa support level. The stochastics are not favorable here though. The equities market may produce some flight to quality if the AI boom goes poof.100Ma failure. Now a cap.
Ruthenium
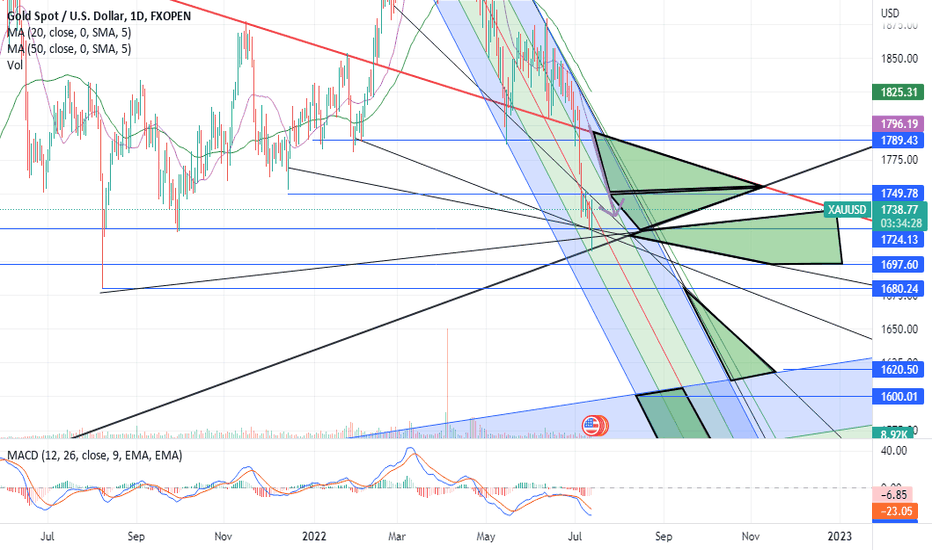
The downtrend was broken this AM. Rays of hope. I had a downtrend to the main channel in blue but this wen out the window with the morning price bonce. I hoped to get to 1789.
Ruthenium
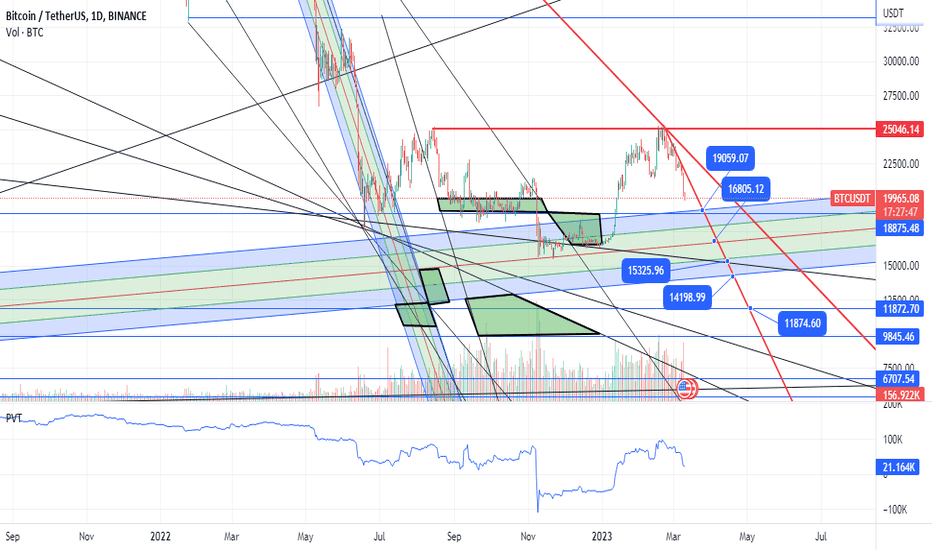
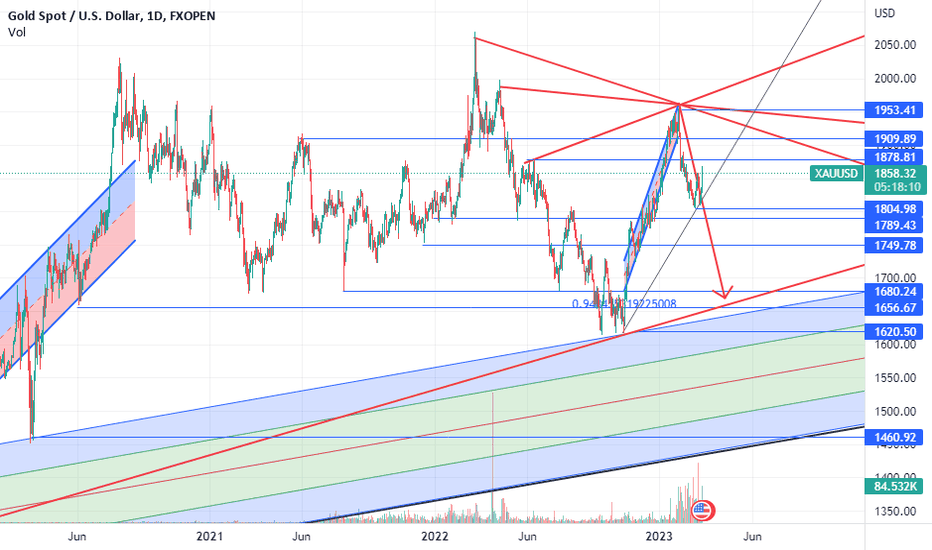
Trend/ray analysis...shows these support levels. Huge Double top at 25K and major resistance at 21.4k
Ruthenium
Added bear trap tiles for reversal potential....the tiles are the outs for the bulls so the bears well might go but with9+% inflation numbers Interest rates will climb to even higher ratchets down equities harder. Even the dollar started to weaken. PPI, jobless claims, retail sales, and import prices... the bears will need some luck.I needed to add the 200W ma going from 1650 to 1668 accross the commodity channel to the upper gap.that should be 1650 to 1678 across the channelDXY holds 105 gold will stagnate here 1750 pull back....hopefully 1724 holds....longer term.
Ruthenium
Areas of interest for future bitcoin speculation. These time and price zones could be places to place your bets.
Ruthenium
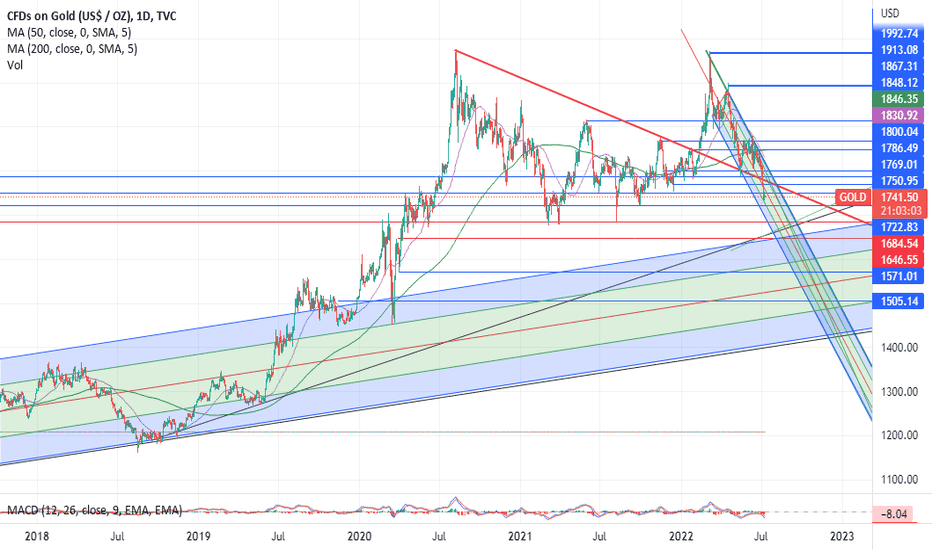
Well the new channel points back down to test the old uptrend. Long-term commodity channel that was from 2012 shows the Covid/Putin excursions that were responsible for excessive QE and government expenditures for war on whatever. WAR is such an overused concept. Anyway the bear channel, should it hold, needs to first get 1724 out of the way. 1650 would complete the case. This is largely a USDX issue. Other currency pairs are not bearish yet. The combination of maximizing currency strength with the backdrop of prior overprinting (MMT) will be resolved here. Guns and butter are currency strength vs tax receipts. The major trend is up but the geopolitics of the moment and obvious currency abuse/debasement are at issue. My thought would be an outcome to the downside at the intersection 1650 if the shorts have the stomach for it and if the EURO, Yen, Pound stay soft to absorb inflation for the US. This monetary policy will grind equities further which may attract buyers. Failing that, we all get some cheap gold in the 1500s. 1450 is possible, but not likely unless the currency war gets out of hand. That would crush stocks especially resource stocks. See the two gold charts done in the past below.
Ruthenium
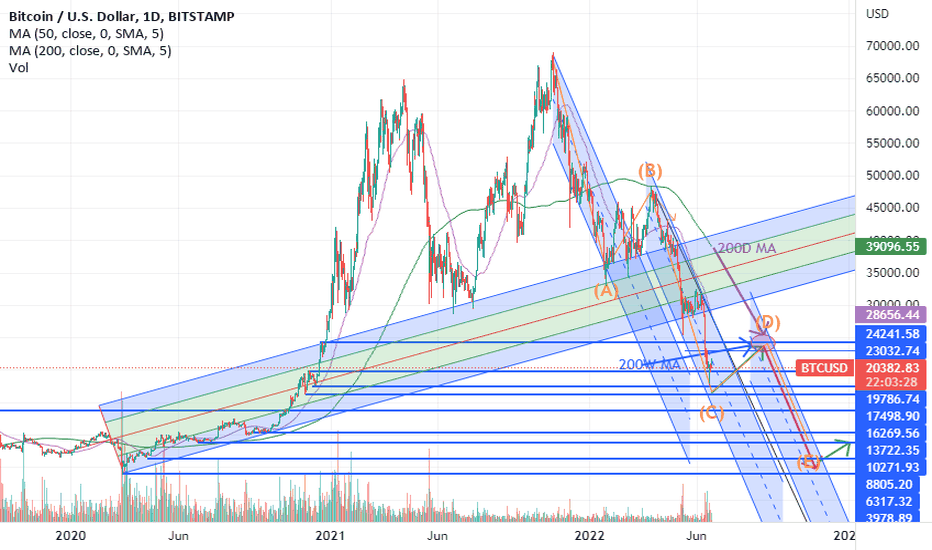
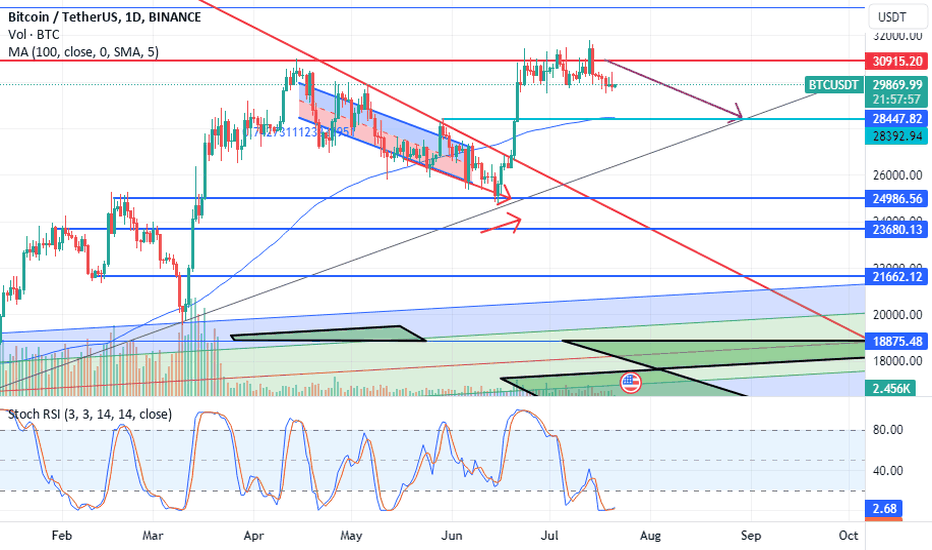
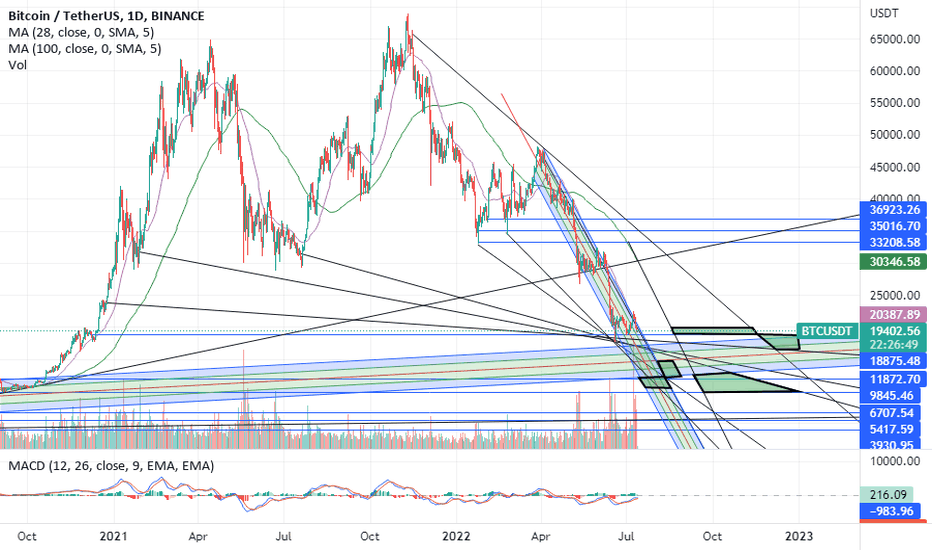
Applying thes trend channels shows that Bitcoin used aas support have now become resistances. 200W MA above now, old breakout channel resistance, elliot wave point count 0ABC in place, future cross in September...Volumes in tokens are way down...
Ruthenium
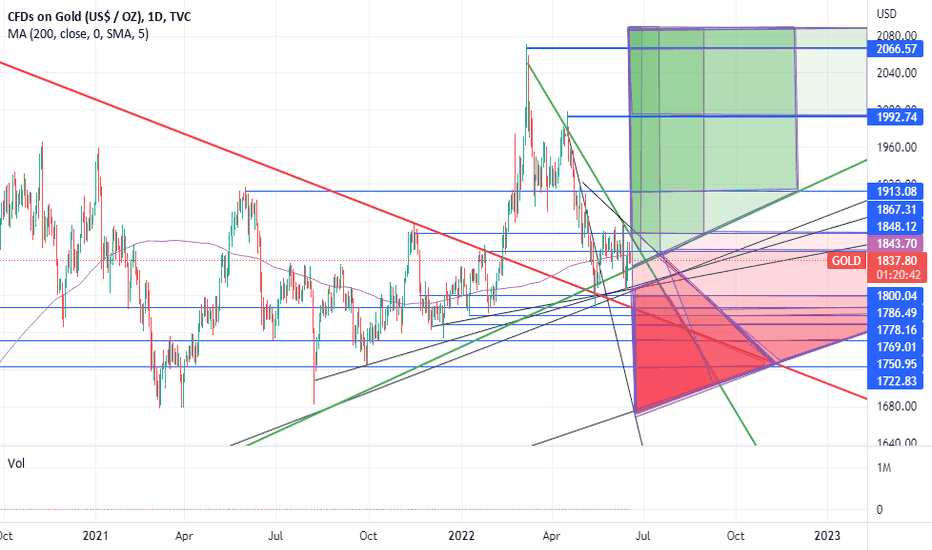
I drew support and resistance lines. from today's price going forward. as each zone is entered opacity increases 10%. This gives me a visually intuitive bullish or bearish outlook. Depending on whether I am long or short or buyer or seller these can have different meanings. For today I am ancient bullish long looking for a dip to buy more. Just evaluating the idea.
Ruthenium
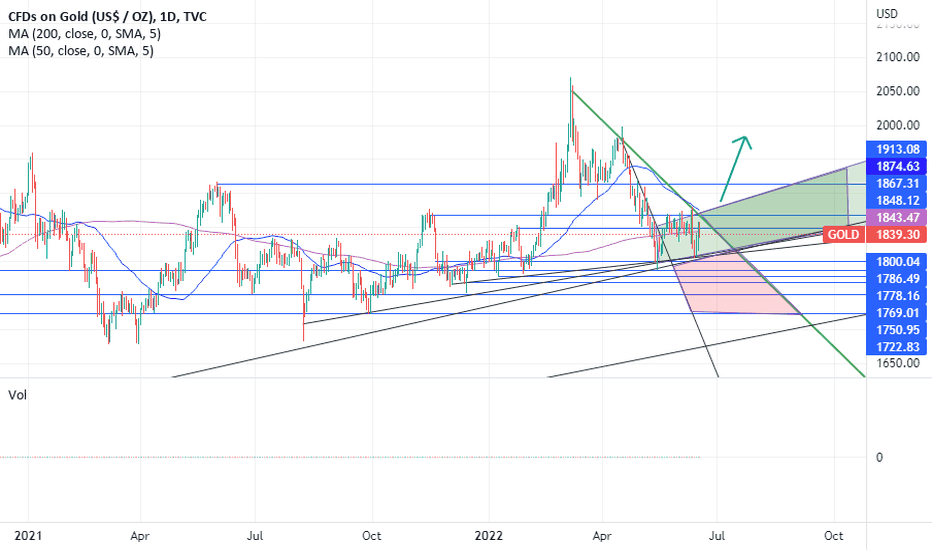
The rays from peaks and troughs show possible transitions from supports and resistances. Looks like the Green panels have the data points in them. Just like last November a ray off the tops needs to be crossed for a retest of highs. Or the green panels are continuation zones. The Bears would have to put some data in the RED box for a case. Currently the 200 D moving average is the defining feature. with the 50 D MA coming down for the test.
Disclaimer
Any content and materials included in Sahmeto's website and official communication channels are a compilation of personal opinions and analyses and are not binding. They do not constitute any recommendation for buying, selling, entering or exiting the stock market and cryptocurrency market. Also, all news and analyses included in the website and channels are merely republished information from official and unofficial domestic and foreign sources, and it is obvious that users of the said content are responsible for following up and ensuring the authenticity and accuracy of the materials. Therefore, while disclaiming responsibility, it is declared that the responsibility for any decision-making, action, and potential profit and loss in the capital market and cryptocurrency market lies with the trader.