
RodrigoHonorioUK
@t_RodrigoHonorioUK
What symbols does the trader recommend buying?
Purchase History
پیام های تریدر
Filter
Signal Type

RodrigoHonorioUK
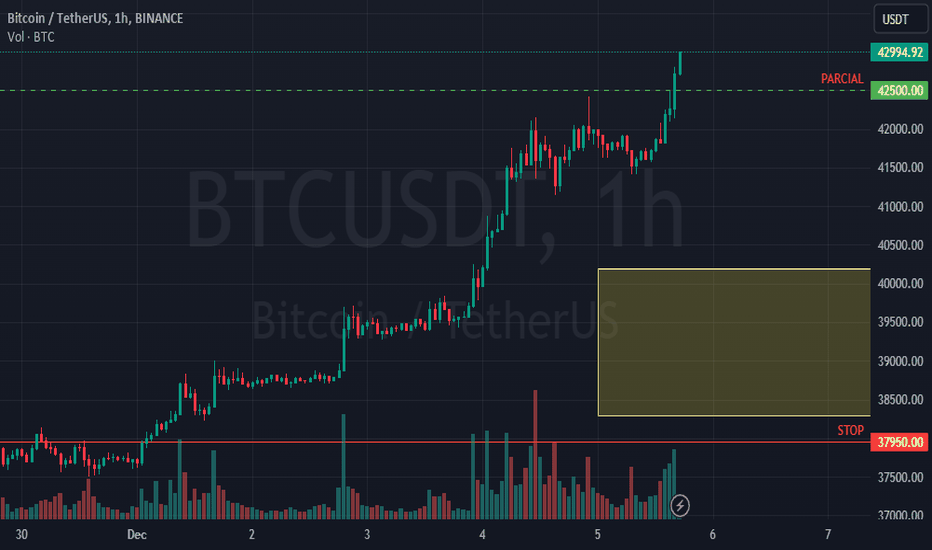
Scenario : After a strong rally, BTC entered a surge around the $37,000 mark, breaking through this zone and gaining a new momentum. With the monthly chart aiming to form a bullish pivot, the daily and weekly charts are highly stressed, requiring a correction. S&P 500 : Healthy, attempting to form a bullish pivot on the monthly chart. Strong resistance at 4600 indicates that markets are seeking a correction. BTCUSDT Monthly: High, close to the resistance of 42500. Weekly: High, RSI very stretched (needing correction). Daily: High, RSI very stretched (needing correction). Indicators RSI RSI Levels 12 and 26 period Moving Averages Volume Fibonacci Retracement Strategy : 1 hour and 4 hours in oversold conditions. Whenever the daily chart enters a strong uptrend, a correction is needed, indicated when the 1-hour chart enters oversold territory (30% RSI). The same rule applies to the weekly chart, with its respective oversold timeframe being the 4 hours. To confirm this strategy, we can observe that the 5-minute chart in oversold conditions (1-hour correction) and the 15-minute chart (4-hour correction) when entering oversold conditions provided excellent scalping opportunities. Now, the buying force will wait for the 1-hour oversold condition, while the selling force will use the 42500 resistance to take profits. Using RSI levels, the price range of $40,200 to $38,300 was found, where several buy orders should be defined to obtain the best average price. However, due to the 1-hour chart being highly stressed, the price range found today with RSI levels will not be used, requiring daily updates of the range and order values using the same tool. The initial stop loss should be set at 37950, slightly below 38000, which is a strong psychological number. As the price range is corrected, the old nearest top will be used as a stop loss. The first partial should be taken just below 42500 (to ensure our order is executed). I will take a significant profit and raise my stop loss to the entry price. As the weekly chart needs correction, it is expected that the price will fall below 38,000, where we will repeat the analysis and seek oversold conditions on the 4-hour chart.

RodrigoHonorioUK
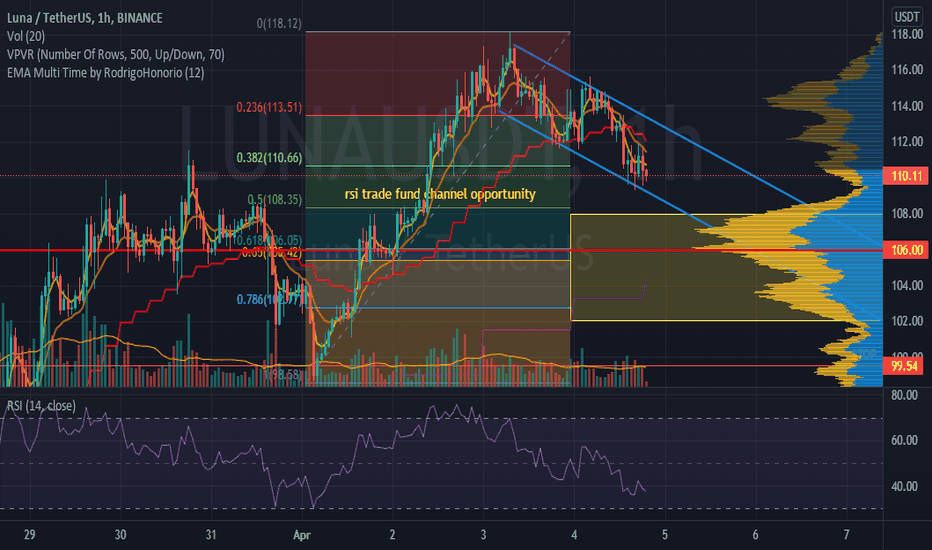
After a big rise on the daily chart LUNA is looking for the bottom to continue its trend giving us a great buying opportunity. Indicators Used *Fibonacci retracement *RSI lvls *MPVR About the BEARISH CHANNEL graphic pattern Channel of a pattern where the asset loses funds but has no downtrend continuity. It shows a depletion of buying force and tends to break out to the upside reversing the trend of its timeframe. Current scenario As everyone knows, no asset goes up forever, needing to create funds to maintain its uptrend. Luna has been in a strong uptrend for months on the daily chart always looking for bottoms when the RSI on the 1h hour chart goes into oversold. Now we are forming another fund, a great opportunity for purchases. Strategy Buy at the bottom formed at 1h in oversold. Using RSI lvls we can see the buy range where the 1h chart goes into oversold and marked with the yellow box. In the middle of this region the MPVR points to a strong support range at the value of 106, which indicates an excellent entry point. The value of 106 also coincides with the Fibonacci retracement, where 0.65 at an excellent entry point called the GOLDEN LINE. Conclusion As I always divide my equity into 10 shares and position within the yellow buy range to get the best average price, however, this time I will focus more heavily on the value of 106 due to MPVP. As Alt Coins are extremely volatile I will protect myself from an unlikely, but possible flush up to 100, a strong psychological number, positioning my STOP just below. The exits I mentioned before are made partially at each strong resistance, however if the uptrend remains strong I will make a partial gain on the first resistance and I will stop making partial gains by raising my STOP at each bottom formed at 1h to try to surf the wave .

RodrigoHonorioUK
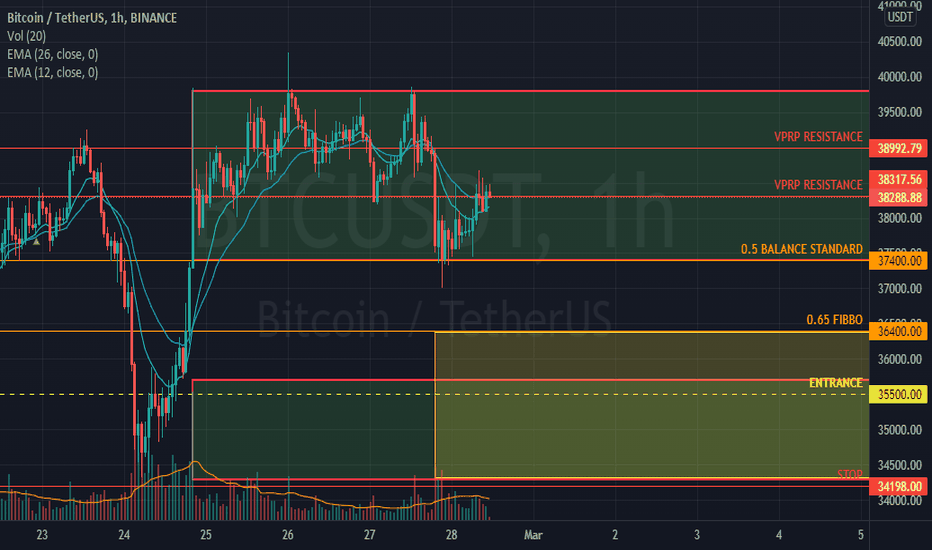
Good morning, follow BTC analysis and a possible trade for the next few hours. If you are enjoying the analysis and have questions and suggestions, leave a comment below, like and subscribe, also follow me on Twitter. Comment if you are interested in knowing more about timeframes, the indicators I use and even other indicators that I have programmed and that have helped me a lot, I can write explaining them. Twitter: @Jack74541196 Indicators Used • RSI • Light RSI • VPRP • Averages of 12 and 26 periods • Graphic pattern Current scenario BTC is now looking for a rising bottom on the daily chart, this usually occurs when the 1h chart goes oversold on the RSI. One factor can harm this trade, BTC has already hit 1h on short and I exit quickly, this can cause our orders not to be executed, on the positive side, below the buy zone there is strong support which makes us more comfortable to place our orders and a clear STOP LOSS point. The news about the war between Russia and Ukraine has been losing strength in the market, affecting less and less, as expected. SPY500USD looked for a correction on the 1h chart (5 min oversold) and held at 42700, which is excellent, probably on SPY we will have a GAP at the opening followed by a rally. Conclusion Using VPRP we map the price ranges where BTC will find support and resistance (red and green box) and within this range we can find the highest resistance prices (red line). Knowing that the daily chart has had a big rally and now needs to correct, let's use the RSI lvls to find the price range on the 1h chart that corresponds to this correction (yellow box). Finally, we use the Fib Retracement, to see where the 0.65 line (gold line) is, a great buy indicator. The Fib retraceally coincides with the entry of the RSI lvls at 1h, which in turn has a strong resistance zone at the most extreme values. The price came looking for the 0.5 of the Fib Retracement, in its first decline, which indicates a probable pattern of equilibrium in lesser timeframes and when analyzing the 5m an ascending wedge was found, an exhaustion pattern that usually breaks down, being able to boost the price down towards our buy zone. Finally, the 12 and 26 emus merged at 4h forming a strong resistance increasing the need for BTC to form an ascending bottom on the daily to have strength and break them. I will divide my capital into 5 parts and distribute it in the range of 36400 to 35500 (strong psychological number) and have my STOP LOSS at 34198, just below the last strong resistance. How to get out. I execute my exits in parts, when I reach the first resistance zone, I leave with part of the profits and update my STOP LOSS at each bottom formed in lower timeframes. This guarantees profit and security in unstable times like these.

RodrigoHonorioUK
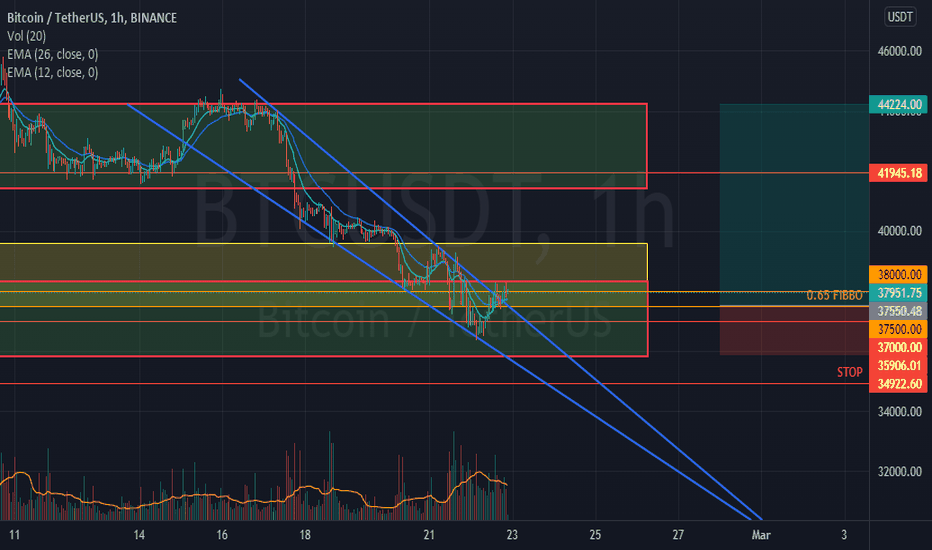
This is an update from the afternoon of 02/20/2022.. if you haven't seen it, see the post with all the description and techniques used: -CORRECTION-trading-strategy/ WEDGE DESCENDETE AT 1H FORMED!!! Upon entering the turmoil zone where there were a large number of waves, BTC formed a descending wedge pattern, a pattern that usually breaks out to the upside. DESCENDING WEDGE. Trend reversal pattern where the asset loses funds but does not continue to fall, generating a depletion in the buying force. This pattern was formed in the price turmoil zone and on the oversold RSI. It took an update in the price entry zone sideways before entering the oversold zone on the RSI, which pulled it further down, sorry I wasn't home to post. Now I continue operating this pattern by making entries at the base of the wedge, taking 10% profit on the resistance of the wedge and if there is a continuity of fall I add this profit to the base again to have the best average price. I canceled my stop and now I will accept the stop loss if we miss the bottom of the wedge. This pattern is the same as when I took the bottom of the monthly, previous post, where when entering the buy zone it formed a descending wedge and broke up.

RodrigoHonorioUK
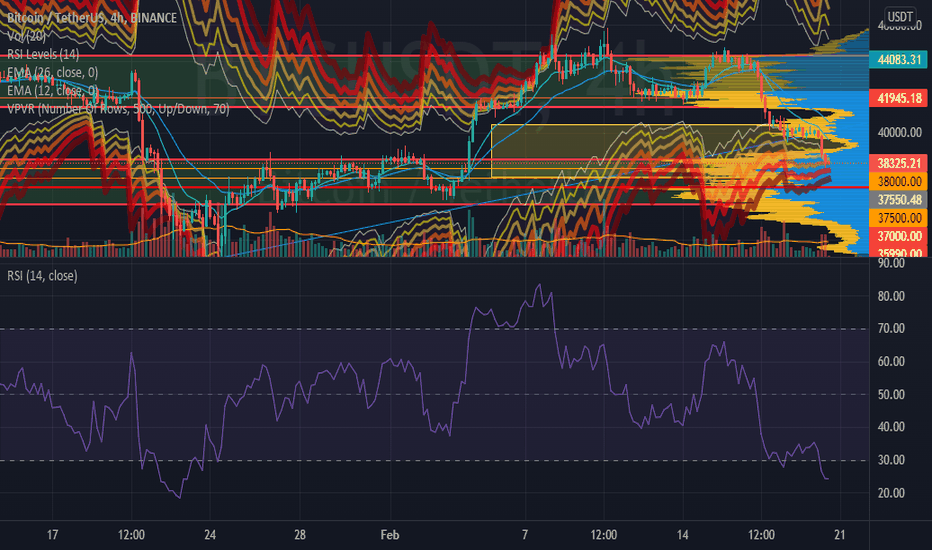
hello Below is an analysis of BTC for the next few days, the idea is a short swing using the bottonm fishing risk-return 4.19 strategy. Indicators used *Fibonacci retracement *12 and 26 period moving averages *MPVR *RSI levels Current Scenario BTC comes in a strong rally on the weekly chart, so in this period it has to correct. Believing that this low is just a weekly correction. SPY also contributing to this correction in BTC. How I analyzed I begin the search for the bottom of this weekly correction that occurs when the 4h RSI enters extreme levels. Using RSI lvls I marked this region with a yellow box. Now using the MPVR, I look for regions where there was strong market movement in the past to establish as support, the green and red box, where it coincides with the extreme level of the 4h RSI levels. Using the Fibonacci retracement on the weekly rally, it shows the golden line at the value of 38000, a strong psychological number, which is exactly in the region that the other indicators show. I would like to say that I use Fibonacci only as a mere reference but not as a criterion. Conclusion ALL indicators point to the 38000 region as an excellent buying point, I am dividing my capital into 5 orders of equal values ranging from 38000 to 37500 (another strong resistance observed in the MPVR), thus seeking to take the stop orders and get the best average price. The STOP will be at 35990, a little below the 36000, a strong psychological number, from this point on, according to the TRDR (I don't have it but I've seen it from other traders) there are no more significant orders, that is, the price would plummet. The final gain is at 44000 when the 1h RSI would enter an extreme overbought level and the 4h would enter an overbought as well, in this region according to MPVR and TRDR there is strong resistance. I will start taking profit when we reach 41900, when we enter a strong resistance zone according to the indicators, I will exit with 60% of my position and I will peel until the final profit. Heads up Be careful with the news about Ukraine, which has been affecting the market more and more but still does, and the SPY. BTC dominance is falling even in this uncertain scenario, which is strange to me and I'm looking closely. GOOD TRADES TO ALL... doubts and suggestions I am available.
Disclaimer
Any content and materials included in Sahmeto's website and official communication channels are a compilation of personal opinions and analyses and are not binding. They do not constitute any recommendation for buying, selling, entering or exiting the stock market and cryptocurrency market. Also, all news and analyses included in the website and channels are merely republished information from official and unofficial domestic and foreign sources, and it is obvious that users of the said content are responsible for following up and ensuring the authenticity and accuracy of the materials. Therefore, while disclaiming responsibility, it is declared that the responsibility for any decision-making, action, and potential profit and loss in the capital market and cryptocurrency market lies with the trader.