
RocketMike111
@t_RocketMike111

What symbols does the trader recommend buying?
Purchase History
پیام های تریدر
Filter
Signal Type
RocketMike111
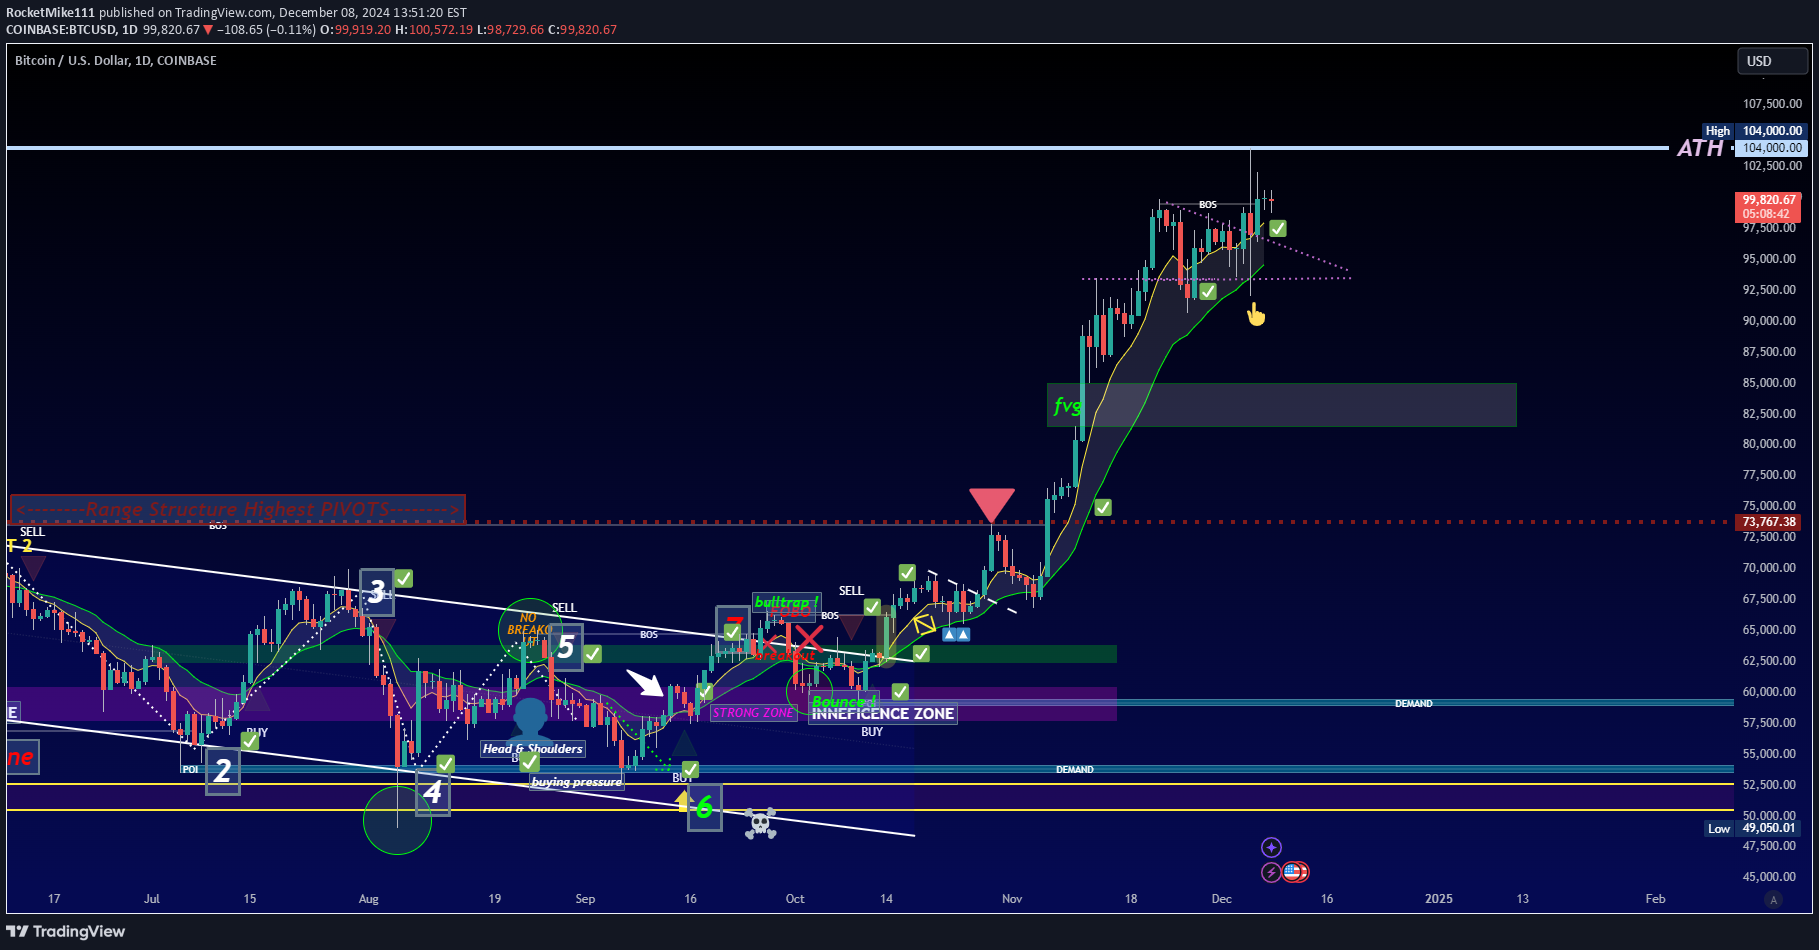
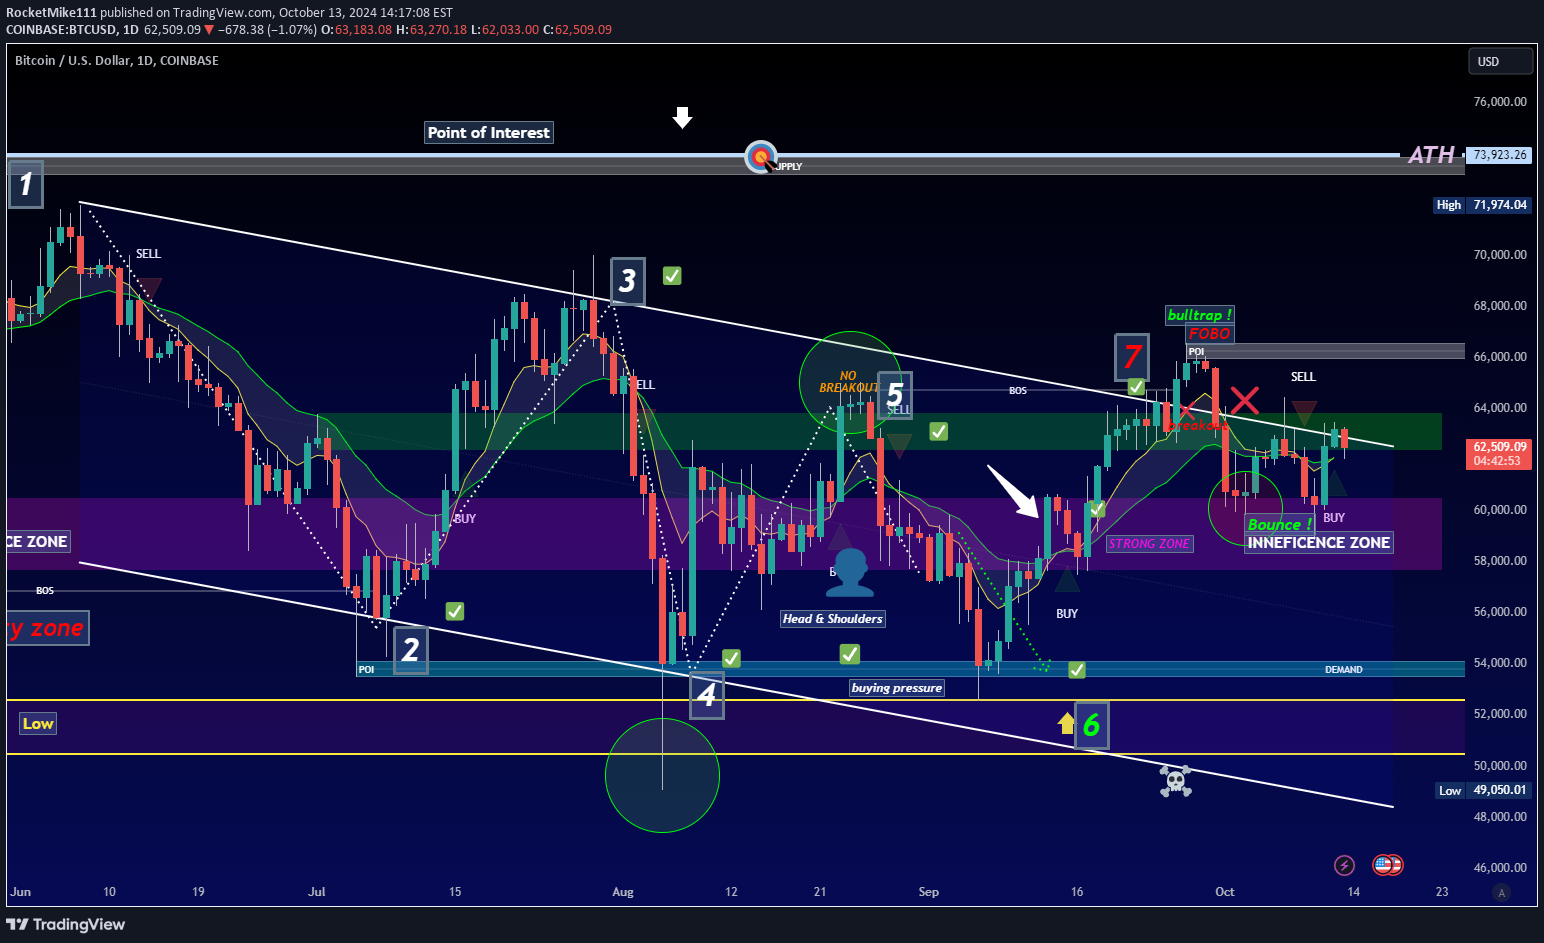
Bitcoin has indeed broken out of the ascending wedge as we had analyzed; however, I’m quite concerned about the very prominent indecision candle that formed during the breakout. This has me a bit worried. If we look at the last two days, they’ve also been indecisive candles. This doesn’t necessarily mean that a Bitcoin correction is imminent, but if the price starts losing momentum after several days of sideways movement with wick-heavy candles, it doesn’t paint a very positive picture for the days ahead. Anything can happen—Bitcoin’s volatility is very high, and the crypto market is currently very bullish. For now, it’s just a matter of waiting to see Bitcoin’s next move and how it reacts. Best regards!
RocketMike111
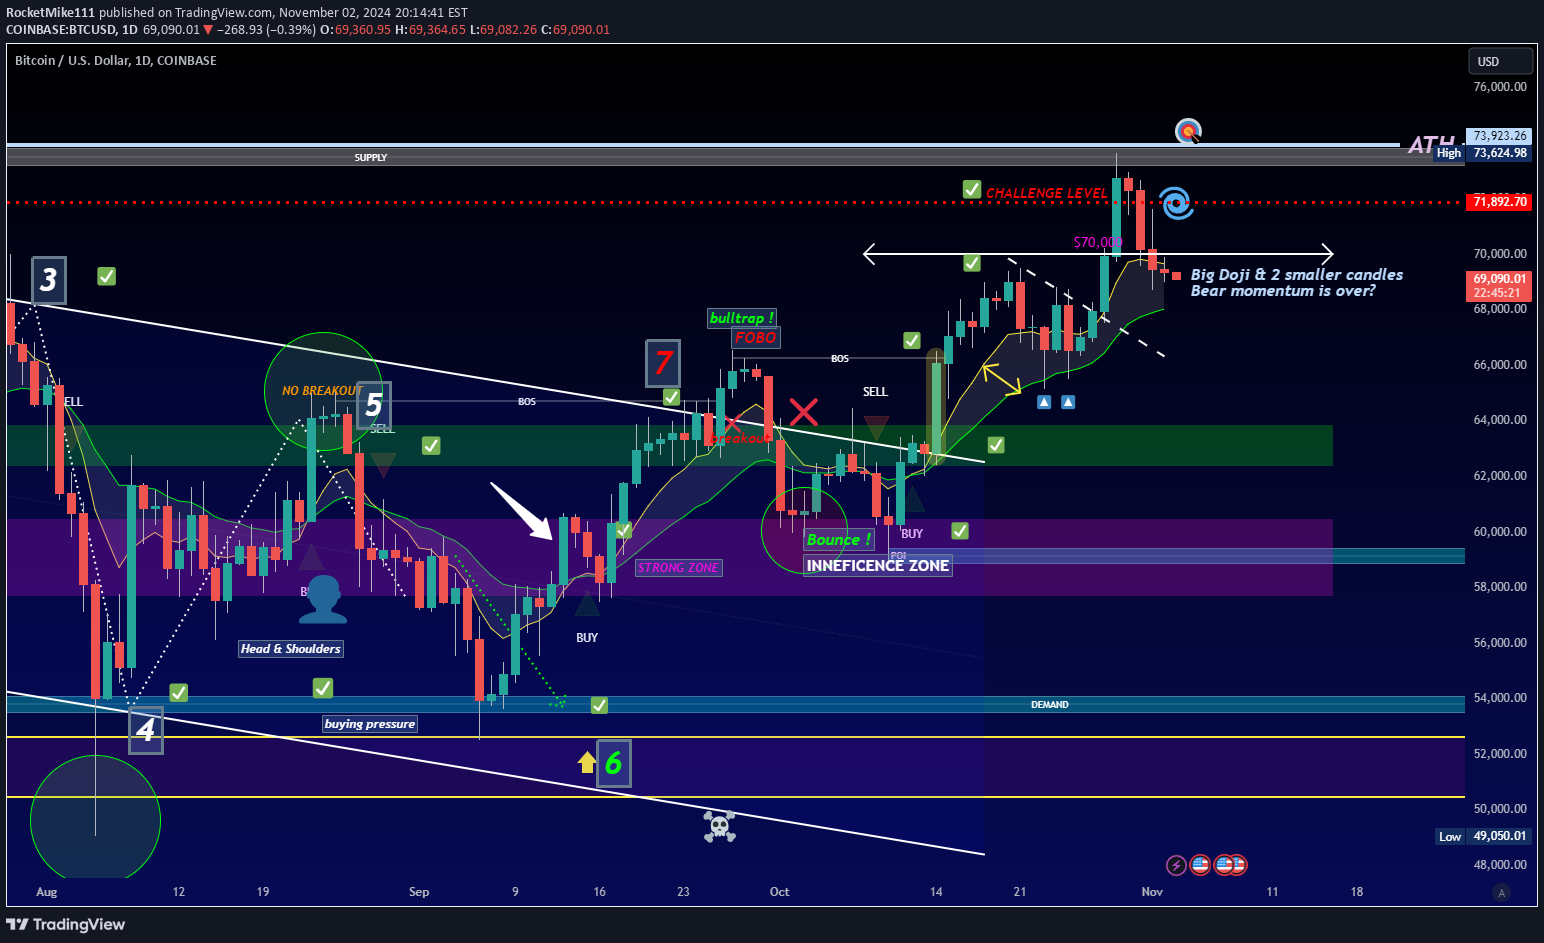
As I mentioned in my previous analysis, I don’t care about reaching 70k; what matters to me is if it can break past the zone at $71,890. Everyone is excited that BTC is back at 70k (myself included), but guess what happened next? The price touched my line at $71,890 and didn’t break through! This is simply because I see more difficulty here, as it's a zone with a greater concentration of institutional orders and has historically been strongly rejected. These last three candles give me the impression that the bear market is nearing its end, so keep a close eye on the upcoming week. But remember, it’s just an impression — the price is always trying to tell us something through its candles, and it’s our job to interpret it correctly. Best regards, and let’s hope that’s the case!! TRADE SAFE!
RocketMike111
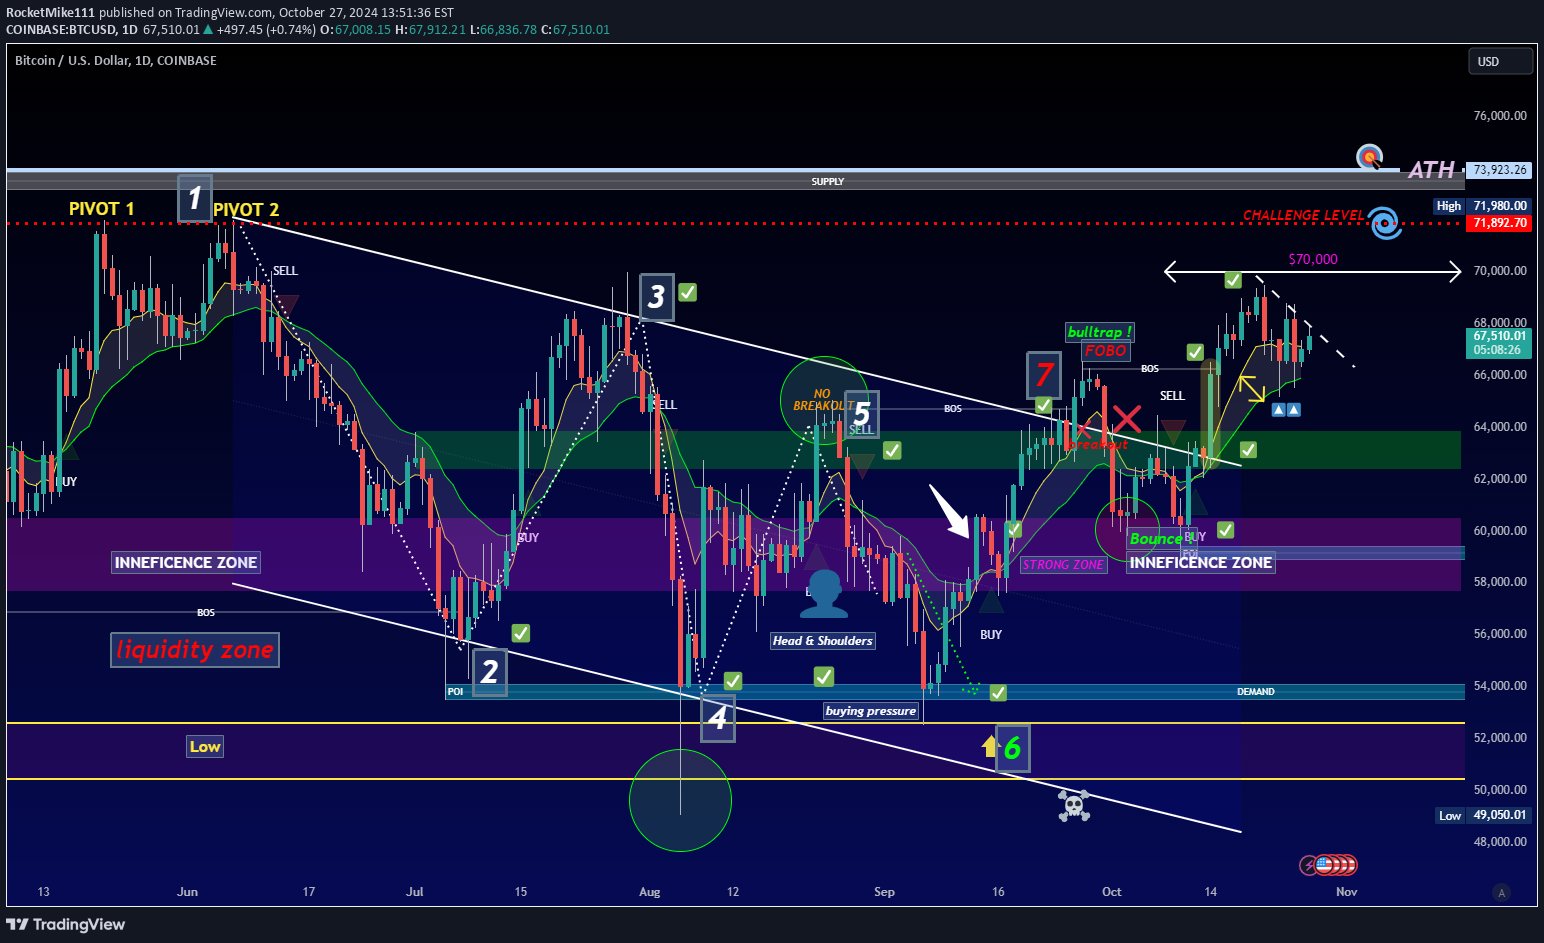
Bitcoin continues fluctuating below 70k. As we mentioned in last week’s analysis, it doesn’t surprise me that Bitcoin crosses 70k; the real challenge is for BTC to surpass $71,890. If you look at the overall structure, the price made a very significant historic move in MAY and JUNE, which I’ll label as PIVOT 1 and PIVOT 2 (see chart). To me, that area presents a real challenge to surpass because I detect a lot of institutional liquidity there, so we need to stay alert once the price crosses 70k and reaches this level. For now, the price has managed to create two candles with strong buying pressure, so I think Bitcoin will have a few good days, but it will continue to fluctuate below 70k until we see solid buying volume. Thank you for supporting my analysis. TRADE SAFE! Best regards!
RocketMike111
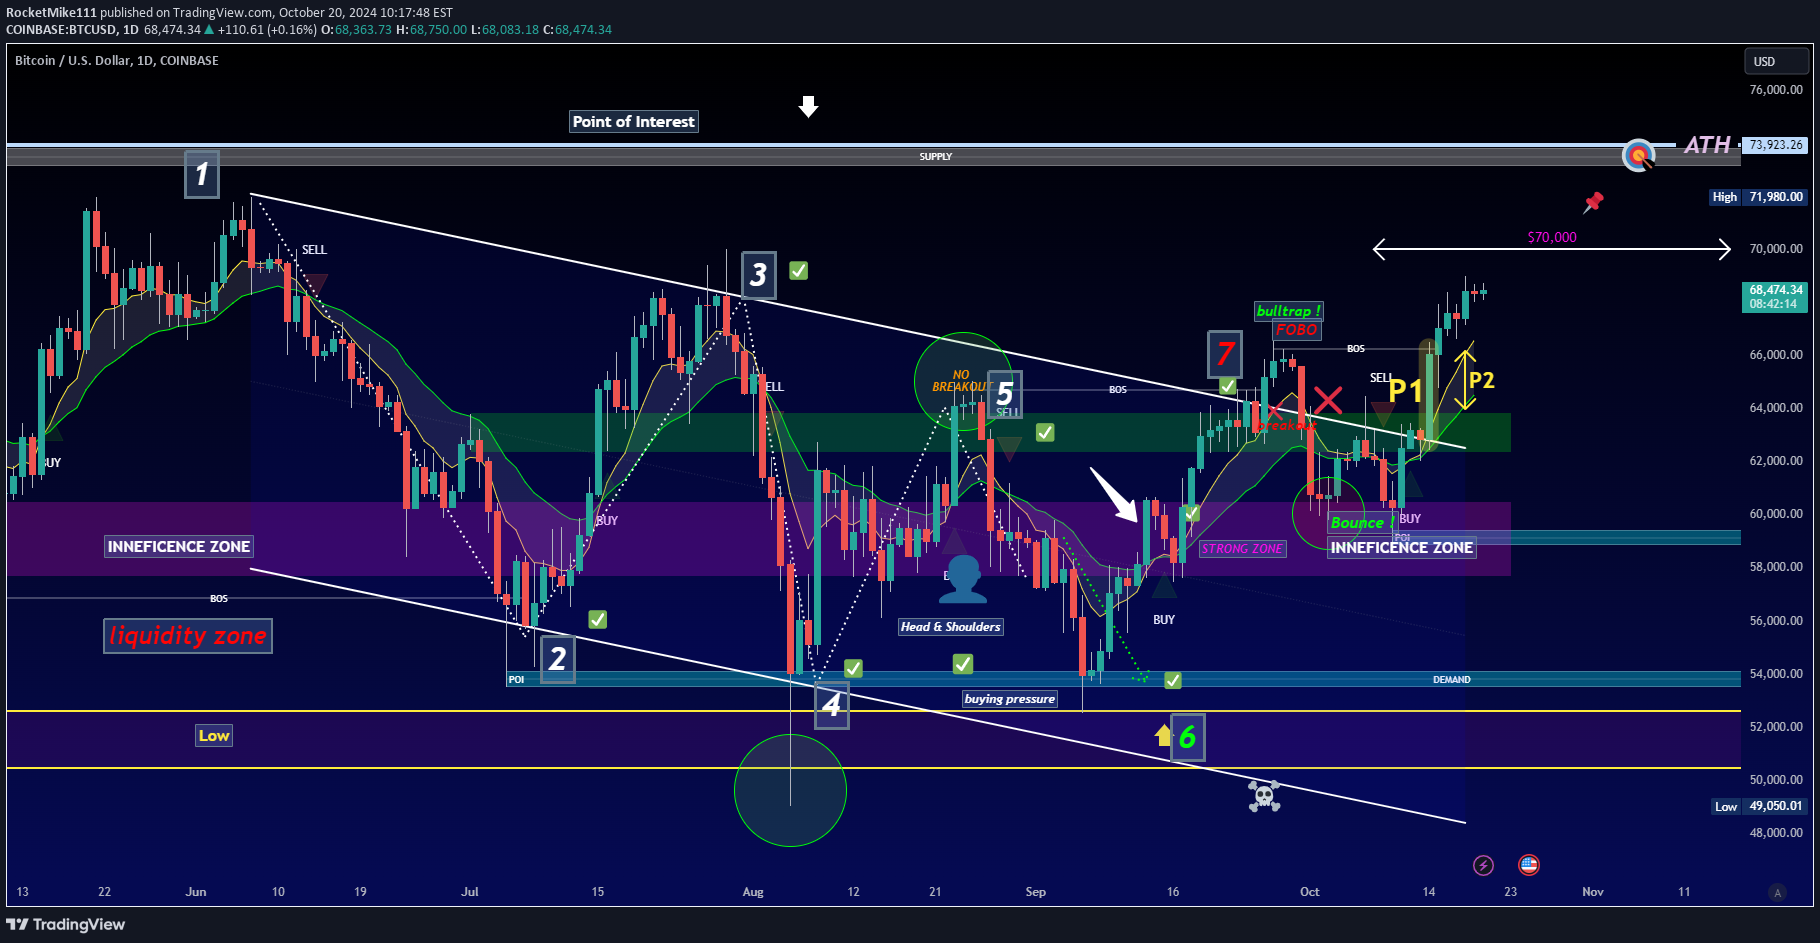
As you can see, the beast has awakened in recent days, and the mother of all cryptocurrencies is back. It’s crucial to use Bitcoin’s analysis as a base because it’s the crypto that drives the entire cryptocurrency market in general. So, rest assured, if Bitcoin wakes up, the crypto market will be alive! The Beast has awakened, and we are very close to $70,000. The key lies in two very important points that I will highlight in yellow on the chart. Point 1 (P1): VOLUMETRIC CANDLE. The impulse of the volumetric candle that gave the price its bullish strength—these types of candles are the fuel that the price needs to propel itself and reach new highs. Point 2 (P2): DIVERGENCE. If we look at the two EMAs (8 and 21), they are very extended. I use these EMAs as a reference to confirm there’s strength in the price. Whenever these two EMAs start to widen from each other, it's when the price begins to make a decision and show strength to either continue its trend or maintain momentum. But hold on! Don’t celebrate just yet. To reach the All-Time High, we’re likely to see one or two pullbacks first. It all depends on the volatility we’ll see in the coming days. Our short-term goal is for BTC to reach $70,000, and after hitting that target, we’ll be very close to seeing BTC surpass its all-time high once again. In my personal opinion, I think the most difficult stage for Bitcoin is not reaching $70,000, but surpassing $71,800 level Let’s see what the week has in store for us. Thank you for supporting my analysis.
RocketMike111
Bitcoin simply doesn’t want to move. As we can see, Bitcoin re-entered the channel again in a bull trap, so as long as the price remains inside the channel, there won’t be any movement we can analyze to predict an upward move. Let’s see what this week has in store. Hopefully, it breaks out again and this time decides to make the bullish run. Thank you.
RocketMike111
BITCOIN, after the FAKEOUT BREAKOUT, has re-entered the bearish channel that we’ve been monitoring for several months. This was a false breakout, which left many of us hopeful for a bullish market, but it turned out to be the opposite! But no worries, we must wait. The important thing here is that, within the bear market we saw last week, the price bounced off a very important and key zone that we’ve been tracking for several months. This purple zone is what I call my inefficiency zone, which I also consider one of the strongest areas where Bitcoin has previously made strong impulses. The only thing we should consider here is that Bitcoin will likely try to break the channel again. We can’t do anything until the price is on the other side of the channel. It’s that simple! Don’t try to enter right now because the price could pull back. Always pay attention to the immediate structure being presented and WAIT! We already have confirmation that the price has bounced within our inefficiency zone. Now, we just wait for the breakout, so patience is key! That’s my advice for this week. Best regards, and thank you for supporting my analysis.
RocketMike111
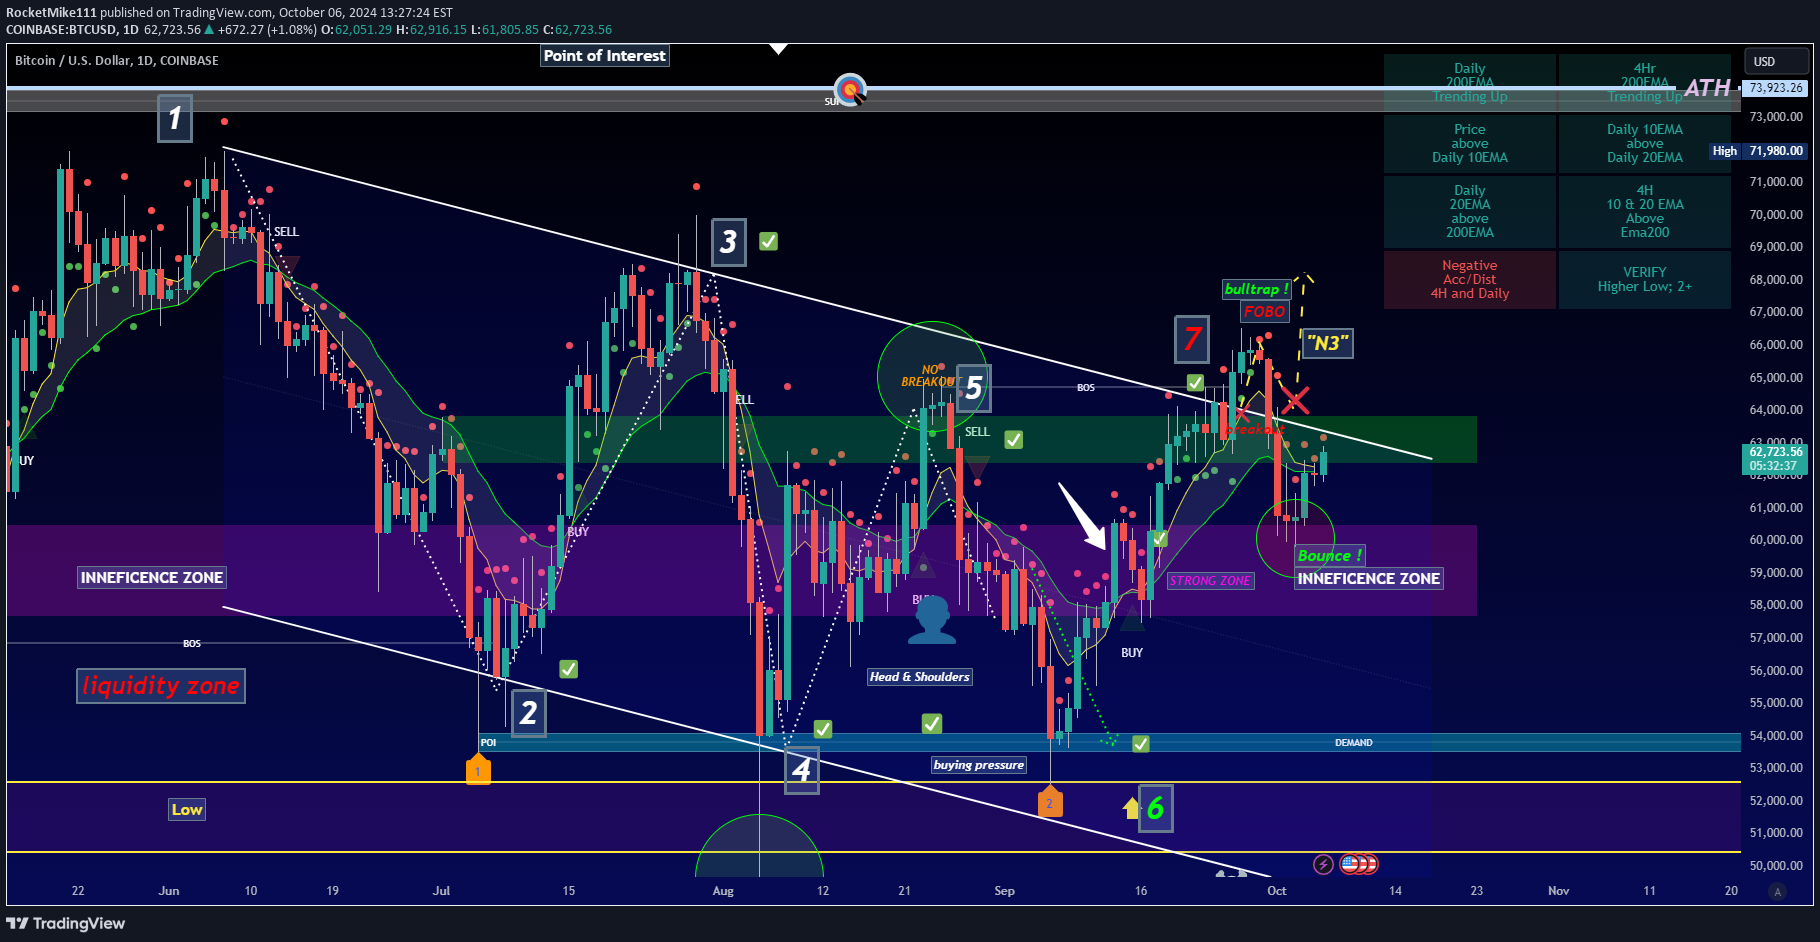
Lucky Number 7 !!!!!! Get Ready for the Bull-RUN!!! But first...First of all, I want to clarify that all the checkmarks checked off are the predictions we have been making over all these months. Each checkmark is confirmation that the price behavior followed the analysis we conducted.In this case, the breakout of point #7 was fulfilled, and this is the breakout I had been waiting for around July-August (point #3). But before we proceed, I want to clarify that for me, a valid breakout means the candle and wick are completely outside the resistance line! So, indeed, for me, this is a legitimate breakout.BUT BEFORE THIS HAPPENS, WE HAVE TO SEE A SUPER IMPORTANT MOVE!!!!!Within the N3 pattern, whenever there is a breakout, it is always followed by a new high, and then the price makes its natural pullback. We will look for the price to touch the new support level, rebound, and aim for a new high.This is my N3 pattern, which I always look for after confirming a breakout.So, let’s wait a few days to allow Bitcoin to rise as much as it needs to, make its natural pullback, and then buckle up because we’re about to see a strong bullish run.Thanks for supporting my analysis.Good luck!-mike
RocketMike111
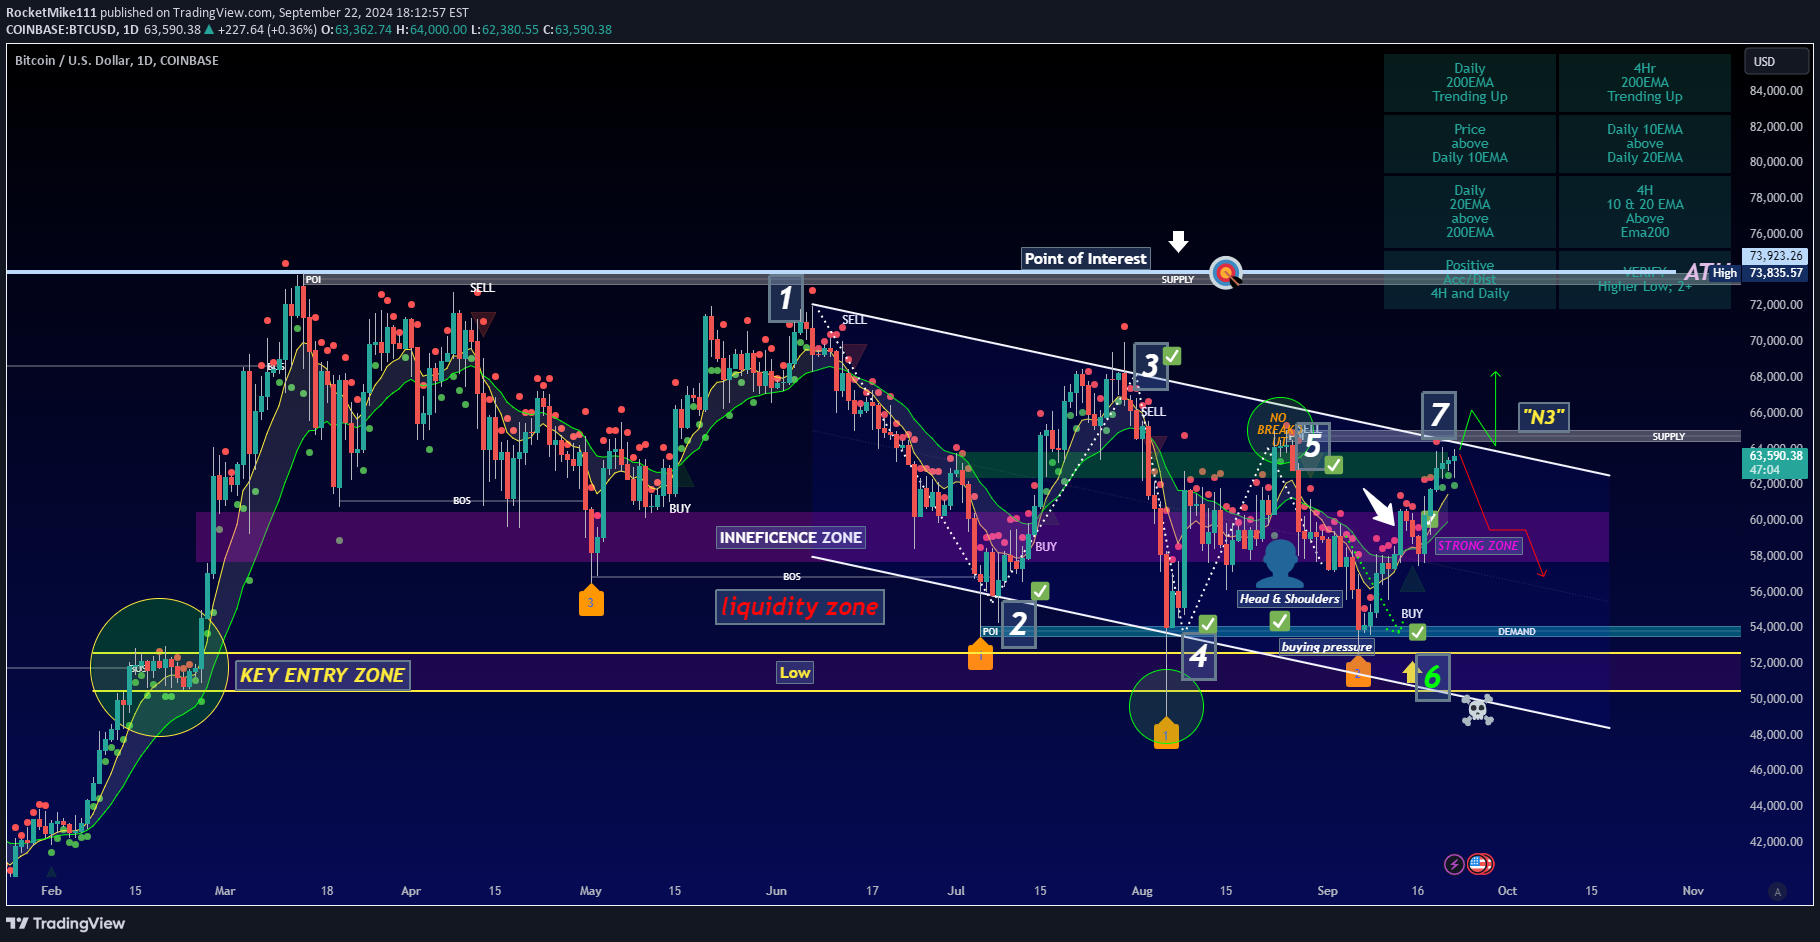
First of all, I want to be very clear that all the checkmarks are the predictions we have been making over these past few months. Each checkmark is a confirmation that the price moved on our side.To verify this, you can visit my Trading View page and check my analysis history, which I’ve shared with you every weekend.Now, let's get into the Bitcoin analysis:If we look at the overall structure of BTC, it is simply a descending range, but if we zoom in, the inefficiency zone has always been an important trigger for Bitcoin's structure, even when bearish. What I mean is that every time it touches the inefficiency zone, Bitcoin surges upward strongly. If you look closely, the largest bullish candles appear in the inefficiency zone. It is also where a head-and-shoulders pattern was formed, but when it touched a demand zone, the price shot up like foam, just as we had predicted.It’s simple... If we can see the overall structure, we have a very important 'KEY ENTRY POINT' (KEP) on the bottom left side to consider, and that same 'KEP' is the area Bitcoin has been respecting frequently.So, we can conclude in this analysis that, as Bitcoin has respected the entire bearish sequence of our trend channel 1, 2, 3, and 4, point #5 was key for retesting our 'KEP' at position #6 and then surging strongly to the inefficiency zone, resulting in a small natural pullback to accelerate the price and almost hit our resistance point #7.But what will happen now?NOTE: If there’s no breakout, there’s no party!I’ll present you with two scenarios (Bearish and Bullish) that Bitcoin may follow this week:Bearish Scenario: If there is no breakout, there’s no party! The price will simply validate our point #7, reject it, and continue the bearish sequence of the channel. We can distinguish this based on the volume and the strength of the candle (keep a close eye on that).Bullish Scenario: The price is about to validate point #7. If starting on Monday, we begin to see strong bullish volumes in Bitcoin, you can be certain that Bitcoin will break the channel. Consequently, we could see a new high after the breakout, followed by a pullback that returns to what was the channel's resistance (now support), and from there, a structural breakout or a new high.I call this pattern N3.The simple fact that the price breaks out and the full candle is outside of my channel, I consider it a genuine breakout.So let’s hope it happens this week.Regards, and thanks for supporting my analysis!"
RocketMike111
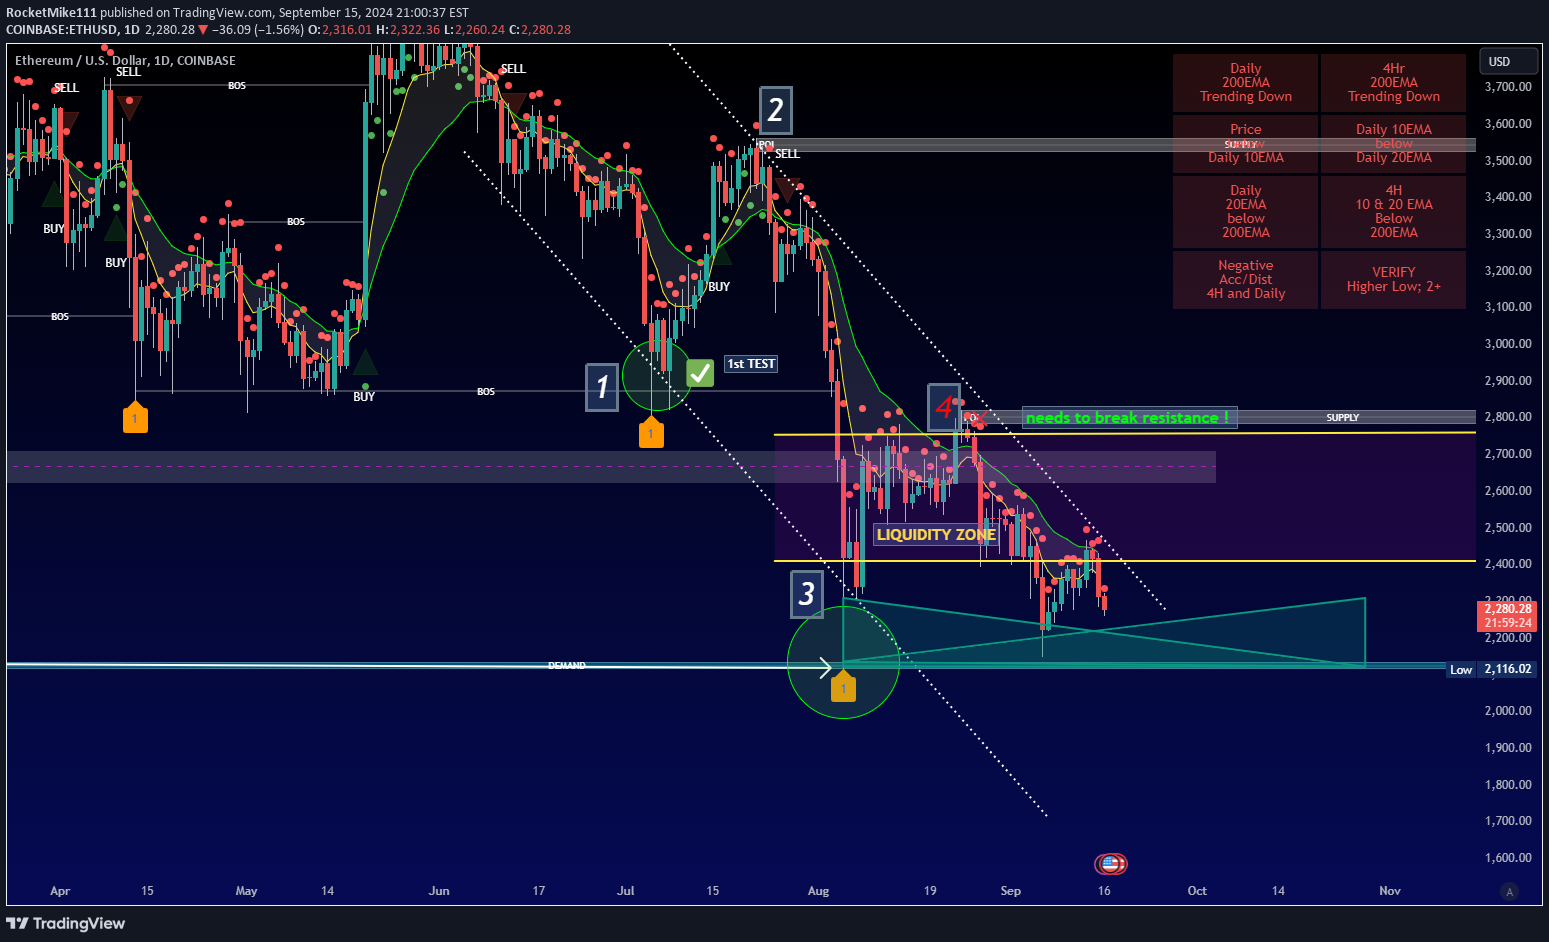
Ethereum is still in a bearish market. It had a very small upward movement, lasting maybe 2 or 3 days, but it continues to show an overall bearish trend.The only thing I can detect here is that we are still in a liquidity zone. However, there hasn't been enough volume for Bitcoin to gain strength and break the bearish channel.That’s the key! ETH needs to break the resistance of the bearish channel, but it's still in the liquidity zone. Let’s hope to see candles with buying pressure this week, as this would indicate that ETH is ready to take off. But for now, it's just a matter of watching its movement.Best regards.
RocketMike111
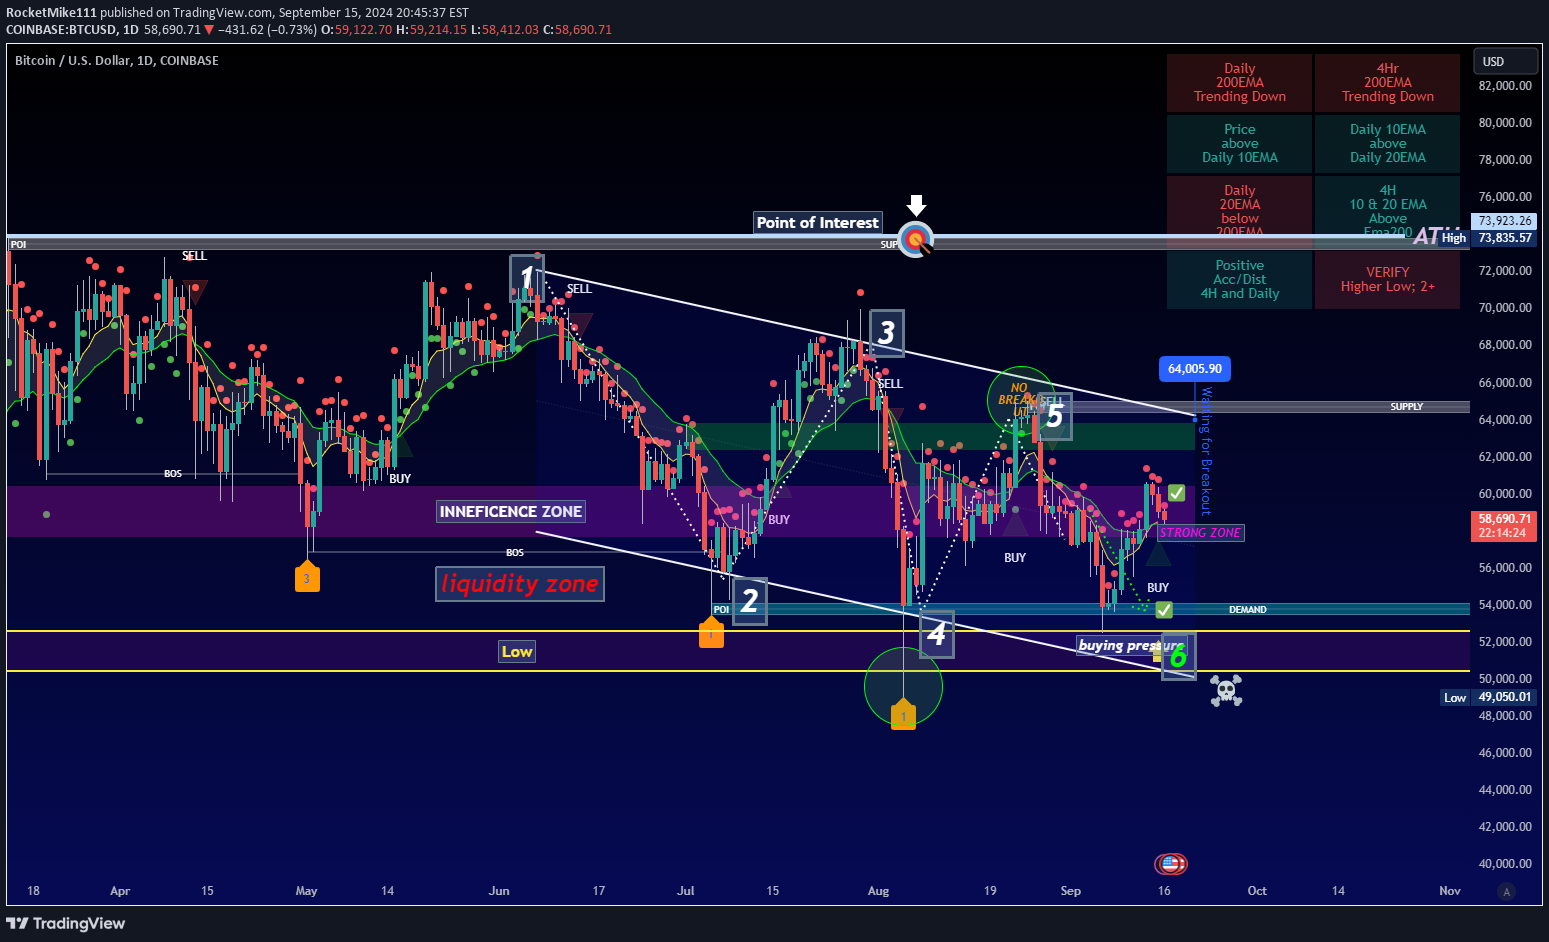
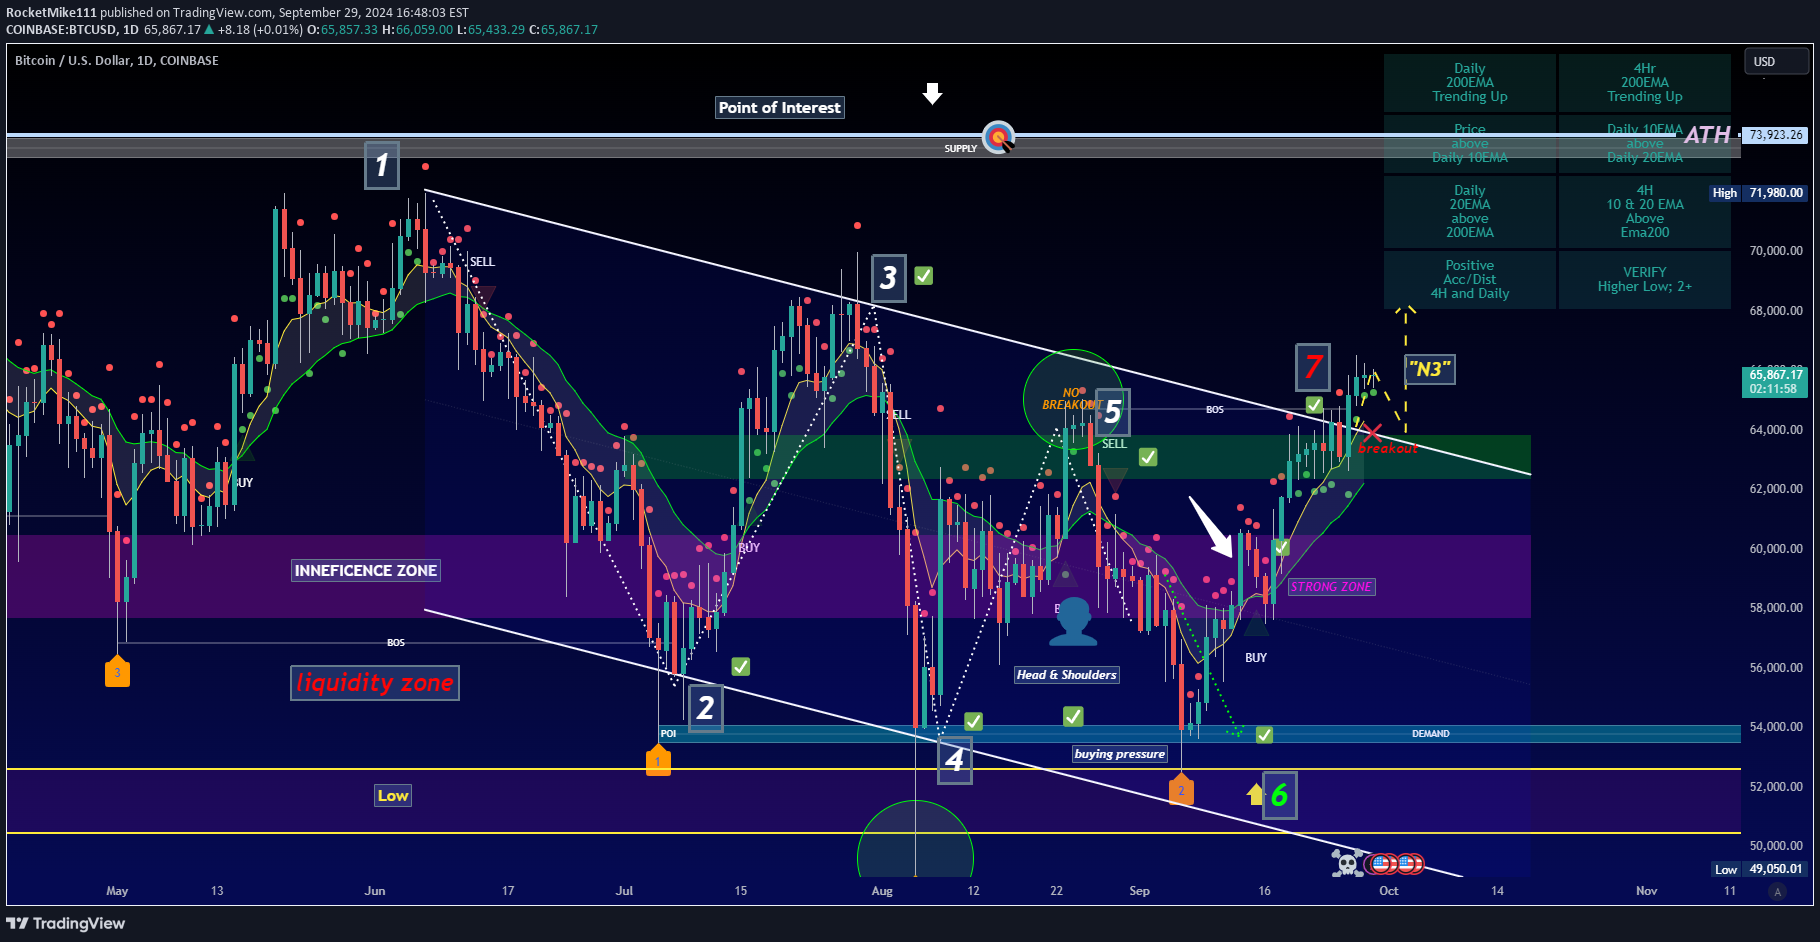
Bitcoin is stationed in an inefficiency zone but with a lot of strength. It undoubtedly had a bullish week, and naturally, after a bullish run, the price needs to take a pause or rest. What better place than our historical zone, which we've marked as an inefficiency zone on the 1-day chart.Yes, Bitcoin still has a bit more to climb to see the breakout that I've been anticipating.As we can see, Bitcoin has been in a bearish sequence channel, and from the technical analysis within the channel, I'm aiming for Bitcoin to at least reach 64k this week so we can see a bit more price action.THE BREAKOUT IS THE KEY, BUT IT STILL HAS SOME WAY TO GO!So, until Bitcoin breaks my channel or at least reaches 64k, all I can do is wait.Thank you for supporting my analysis.Best regards.
Disclaimer
Any content and materials included in Sahmeto's website and official communication channels are a compilation of personal opinions and analyses and are not binding. They do not constitute any recommendation for buying, selling, entering or exiting the stock market and cryptocurrency market. Also, all news and analyses included in the website and channels are merely republished information from official and unofficial domestic and foreign sources, and it is obvious that users of the said content are responsible for following up and ensuring the authenticity and accuracy of the materials. Therefore, while disclaiming responsibility, it is declared that the responsibility for any decision-making, action, and potential profit and loss in the capital market and cryptocurrency market lies with the trader.