
Rivani2006
@t_Rivani2006

What symbols does the trader recommend buying?
Purchase History
پیام های تریدر
Filter
Signal Type
Rivani2006
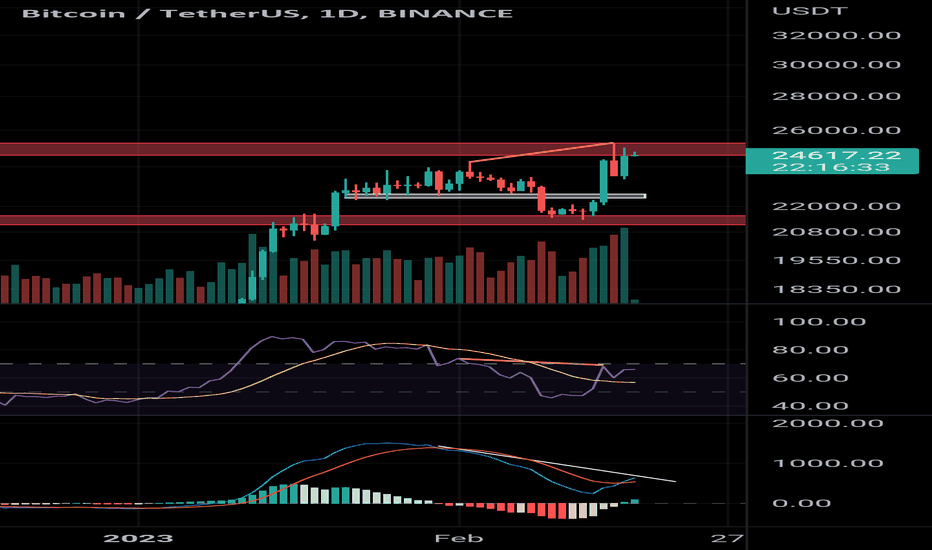
Here we can see that BTCUSDT in 1 day time frame is forming a bearish divergence and if the MACD line cuts the signal line we can get a confirmation for the divergence. So we can take SHORT TRADES in any alt coin also the price has a major resistance zone at the current price.
Rivani2006
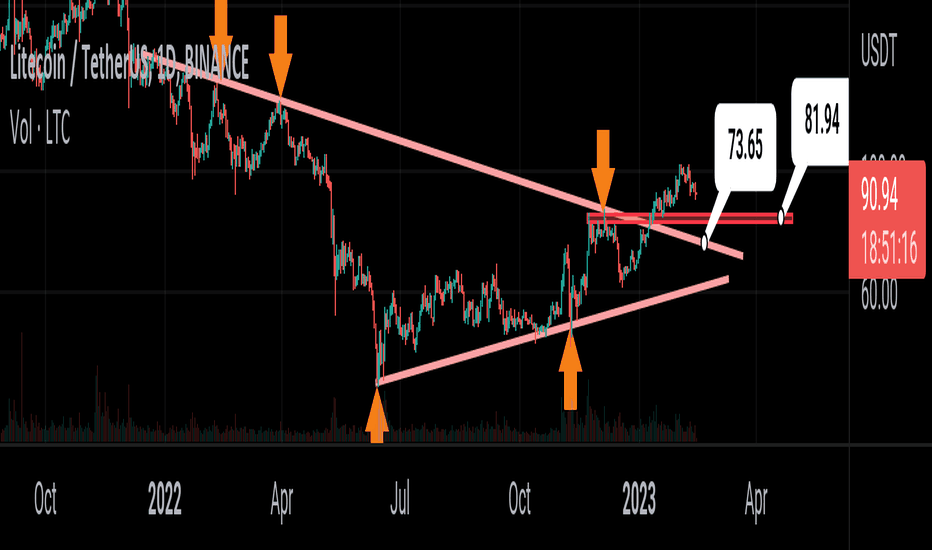
Here se can see that "LTCUSDT" in 1 day time frame has a major support zone at "81.94" and a trendline support zone at "73.65" and we can see a good long opportunity when the price hits the support and we can see good bounce back in the price. ENJOY!!!
Rivani2006
We can see in my previous post that USDTDOM has a resistance and it is about to take rejection from the point so BTC will rise and also we can see that BTC has taken support several times from the mentioned point so you can long here. Also the STOCASTIC RSI is trying to teach the overbrought zone from oversold zone. ENJOY!!!
Rivani2006
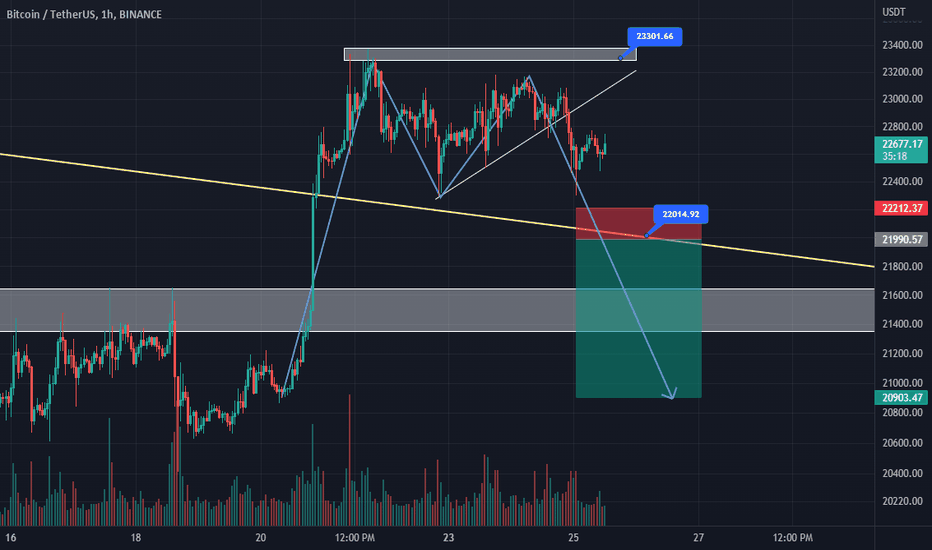
Here we cann see that in 1 hour time frame the chart of "BTCUSDT" is forming a DOUBLE TOP PATTERN and a if the price plays the pattern and we can se further downfall in the price of #BTC and also in other ALTS. So till then keep an eye on the yelllow trendline at "22K". Wait the price to break the zone of 22k and if price breaks the zone we can take SHORT ENTRY with target at the zone of "20.9K". ENJOY!!!!!!!!!!
Rivani2006
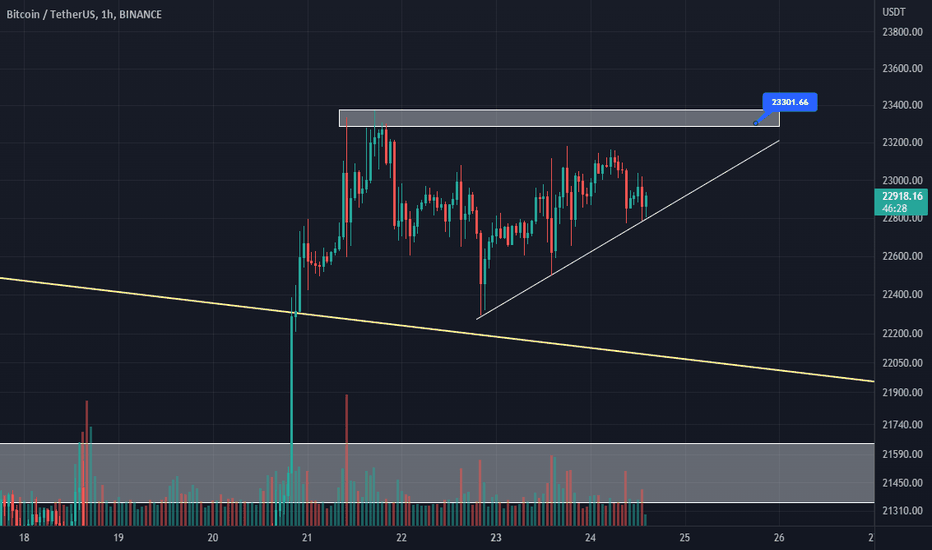
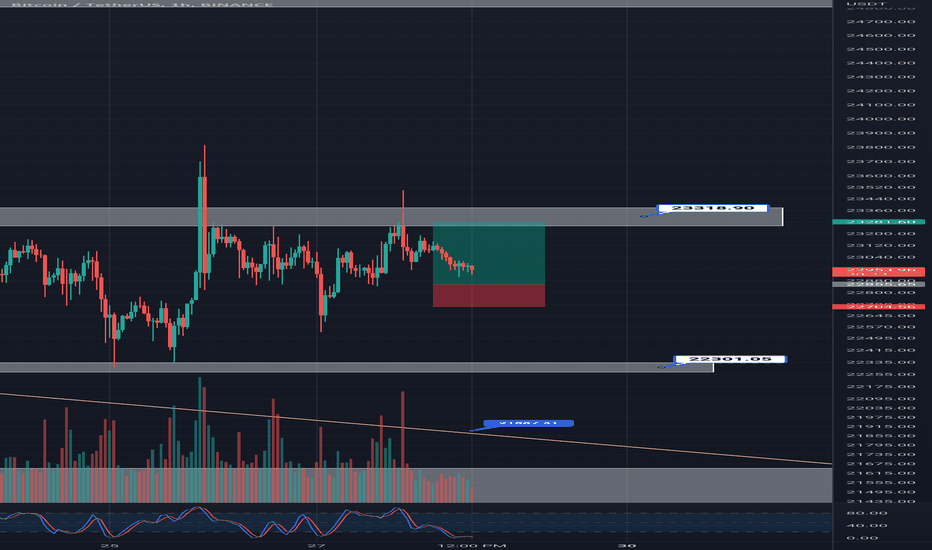
Here we can see that "BTCUSDT" in 1 hour time forming a ascending triangle and we can look for short entry at the zone of 23.3k to 23.1k. ENJOY!!!!!!!
Rivani2006
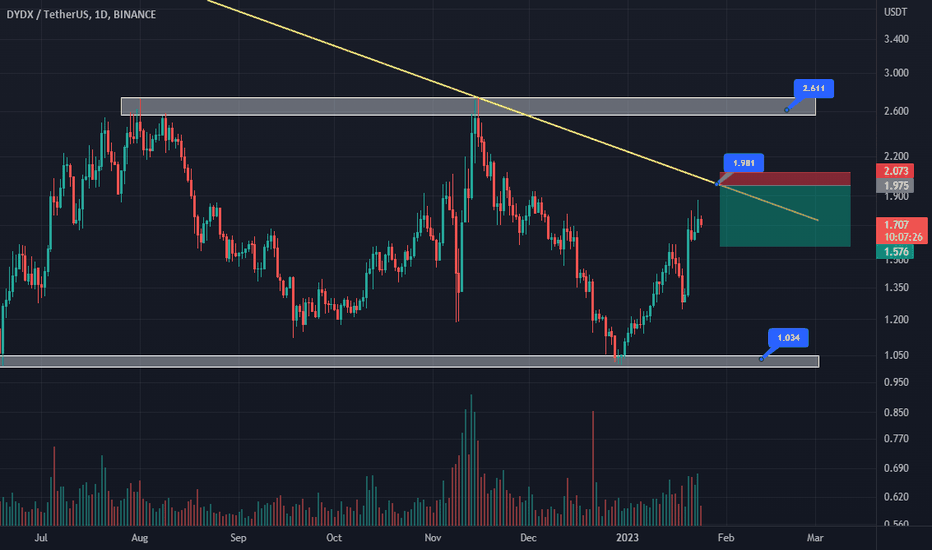
Here we can see that "DYDXUSDT" in 1 day time frame has a trendline resistance at "1.981" and you can see a good short opportunity. ENTRY - "1.981" TARGET - "1.576" STOPLOSS - "2.073" ENJOY!!!!!
Rivani2006
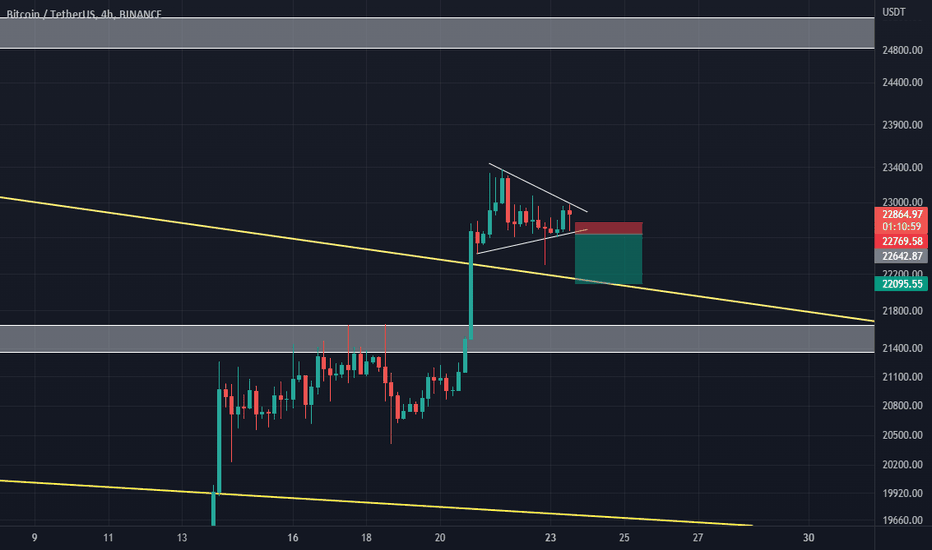
Here we can see that "BTCUSDT" is forming a penant and you can look for a good SHORT OPPORTUNITY if it takes breakout in downside and if it takes breakout from the upside you can go for a good long trade. ENJOY!!!!!!!
Rivani2006
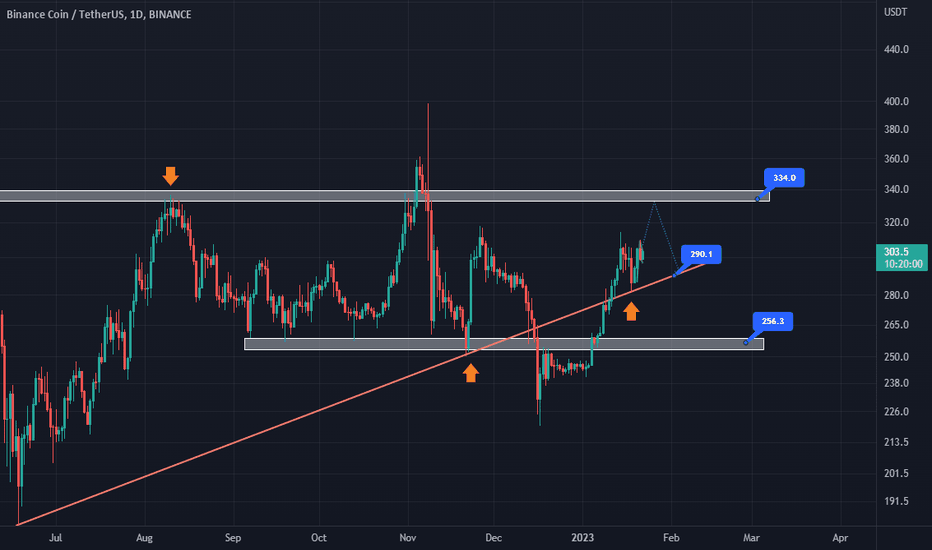
Here you can see the chart of "BNBUSDT" at different time frame. In the 1 day time frame the price has a major Resistance zone at "330" and a Trendline support at "290" and we are expecting the price to reach the resistance zone and take rejection from the point. Also you can see that the price is forming a BULLISH FLAG PATTERN in 4 hout time frame
Rivani2006
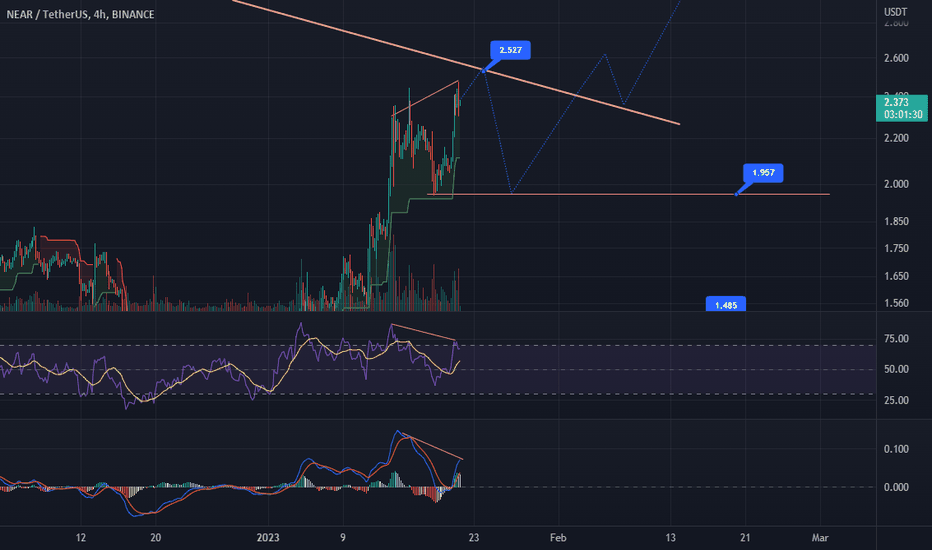
Here we can see that "NEARUSDT" in 1 hour time has a TRENDLINE SUPPORT and we are expecting the price to take rejection from that zone and we can look a GOOD SHORT OPPORTUNITY here. Also in smaller time fras we can see that the MACD indicator and the RSI indicator is forming a BEARISH DIVERGENCE. ENJOY!!!
Rivani2006
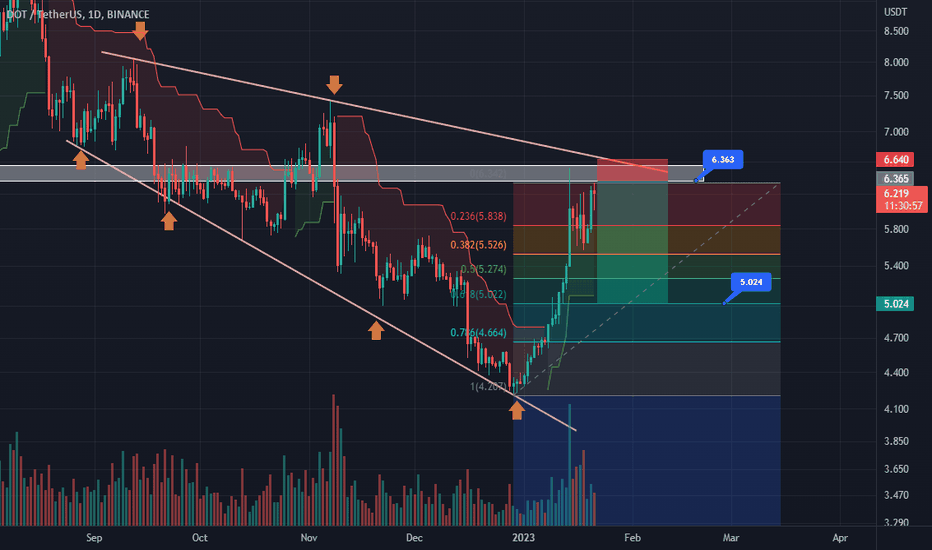
Here we can see that "DOTUSDT" in 1 day time frame has a RESISTANCE at the zone at "6.363" and it can take REJECTION from that zone. And it take correction to the zone "5.024" as there is a 0.6 fibbonachi level. ENJOY!!!!!!!!!!!!
Disclaimer
Any content and materials included in Sahmeto's website and official communication channels are a compilation of personal opinions and analyses and are not binding. They do not constitute any recommendation for buying, selling, entering or exiting the stock market and cryptocurrency market. Also, all news and analyses included in the website and channels are merely republished information from official and unofficial domestic and foreign sources, and it is obvious that users of the said content are responsible for following up and ensuring the authenticity and accuracy of the materials. Therefore, while disclaiming responsibility, it is declared that the responsibility for any decision-making, action, and potential profit and loss in the capital market and cryptocurrency market lies with the trader.