
RamiGamil
@t_RamiGamil

What symbols does the trader recommend buying?
Purchase History
پیام های تریدر
Filter
RamiGamil
XAUUSD-Gold Buys from 2,900 back up
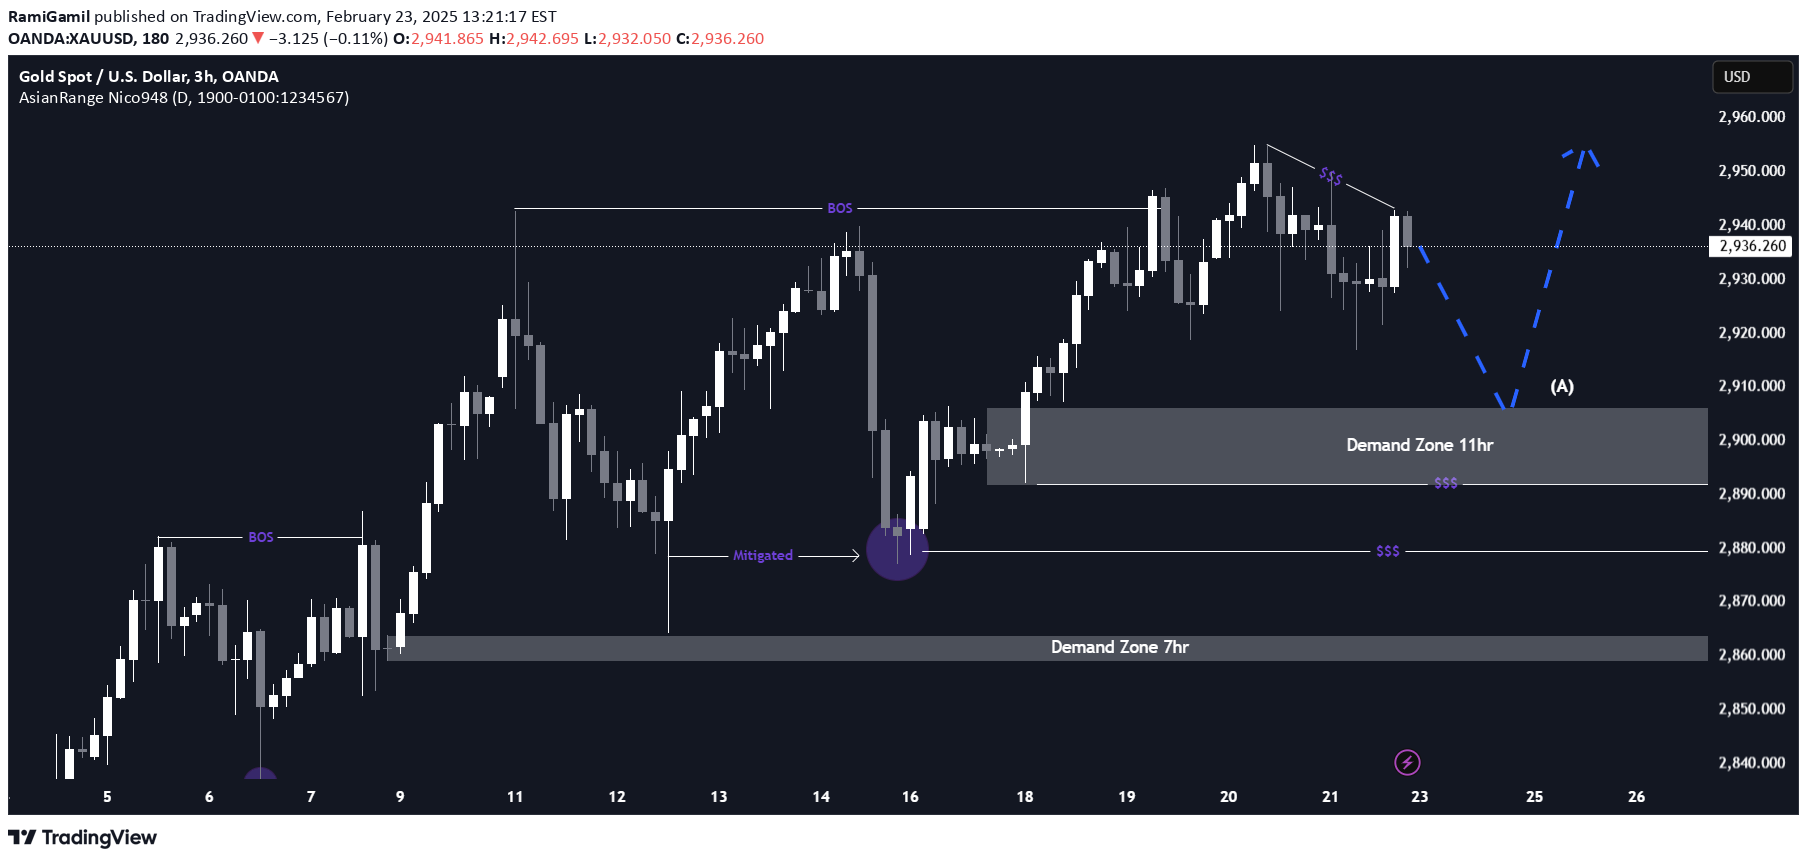
Gold has been in a strong bullish uptrend for the past few weeks, so I’m not surprised that price has once again reached all-time highs. As anticipated, price mitigated the demand zone and continued pushing upward.For this week, I expect price to accumulate and retrace back down to my 11-hour demand zone, where I anticipate signs of weakening before a new bullish move to the upside. Since this demand zone was responsible for the recent break of structure, it has become my point of interest (POI).Confluences for Gold Buys:✅ Price remains in a strong bullish trend, consistently forming higher highs and higher lows.✅ The clean 11-hour demand zone that initiated the last upside move remains unmitigated.✅ There is liquidity resting above, including the newly formed trendline, which is likely to be taken.✅ This setup aligns with the overall bullish trend, reinforcing my long bias.Alternative Scenario:If price fails to hold at the 11-hour demand zone and breaks the major low, we could see a temporary bearish phase or a potential reaction from the 7-hour demand zone insteadt.me/+-ArNrDzhu7swMzU8 Do you want to make your life better? Do you want your wealth to grow? Whether your account is losing money or you are a novice trader, you can contact me. I can bring you more than 400% profit every week. If you don't make money, we don't charge any fees. Click in and take a look. You won't lose anything. Come in and take a look to help you!!! Free channels to gain wealth: t.me/+-ArNrDzhu7swMzU8
RamiGamil
BTCUSDT- DAILY TIMEFRAME UPDATE

If you check the daily chart of #Bitcoin, you'll notice that #BTC has been ranging between $89,000 and $109,000 for approximately 88 days.On Tuesday, Bitcoin dipped below the previous weekly low before bouncing back up.Currently, #BTC is trading at $96,320, and my outlook remains bullish. I expect higher prices in the coming days. Target Levels:📌 Short-term: $97,000 - $97,760 - $98,870📌 Mid-term: $100,120 - $101,700 - $103,000📌 Long-term: $105,104 - $107,200Keep in mind that these targets are approximate—Bitcoin may reach them faster than expected, or it could take longer. Patience is key. 🔑However, if #BTC drops below $88,800, this bullish scenario will be invalidated.t.me/+-ArNrDzhu7swMzU8 Do you want to make your life better? Do you want your wealth to grow? Whether your account is losing money or you are a novice trader, you can contact me. I can bring you more than 400% profit every week. If you don't make money, we don't charge any fees. Click in and take a look. You won't lose anything. Come in and take a look to help you!!! Free channels to gain wealth: t.me/+-ArNrDzhu7swMzU8
RamiGamil
BTCUSD-seeking buyers on the 4hour MA100.

Bitcoin / BTCUSD made a decisive break out yesterday over both the 4hour MA100 for the first time in 20 days as well as the Falling Resistance.After topping today, the price pulled back to retest the 4hour MA100, this time as a demand level so that the market gets the confirmation that there are short term buyers there.1day RSI wise, we made a bullish breakout above the MA similar to January 14th, which was followed with an immense rally to the 109400 High.Buy and target the bottom of that Resistance Zone at 106500.
RamiGamil
Bitcoin-Reversal or Breakout Ahead?

Based on the current market structure, the nearest target for BTCUSDT is the $102,700 - $105,000 range. This level is a significant zone due to the presence of a price imbalance (FVG) and strong limit resistance on the daily timeframe. This level has previously acted as a selling zone, making it a key area for a potential pullback.From an Elliott Wave perspective, I consider the current upward movement as the final stage of Wave C within Wave D of a triangle. If BTCUSDT.P reaches this area, a downward retracement is possible to form the final Wave E before a larger breakout.Development Scenarios:1. Base Scenario (Reversal from $102,700 - $105,000):Expecting resistance in this zone and a reversal within Wave E.Possible retest of $96,000 - $94,000 before an upward breakout.2. Alternative Scenario (Breakout Above Resistance):If BTCUSD decisively holds above $105,000, the next target could be around $110,000 - $112,000.I am holding a long position up to the designated zone, partially taking profits within the target range. I am also considering opening a short position upon a confirmed rejection from this level.
RamiGamil
Bitcoin - Bullish Setup with Key Levels

BTC/USD is currently trading around $95,700, showing signs of a potential bullish continuation. The recent consolidation suggests that buyers are absorbing supply before the next leg up.Key Observations• Bullish Structure: The price is forming a potential higher low near support (green trendline), indicating strength.• Liquidity Grab & Reversal: A deeper pullback to the green support area could serve as a liquidity sweep before an impulsive move higher.• Targeting All-Time Highs: If price follows the projected yellow path, we could see a rally toward the $117,857 - $120,000 resistance zone, aligning with the red trendline.Trade Plan• Wait for a pullback toward the lower trendline (~90K - 92K).• Look for bullish confirmations (rejection wicks, bullish engulfing, etc.) before entering.• Target: $117,857 and possibly higher if momentum sustains.⚠️ Risk Management: If BTC loses key support (green trendline), bullish momentum could weaken, requiring a reassessment of market conditions.t.me/+-ArNrDzhu7swMzU8 Do you want to make your life better? Do you want your wealth to grow? Whether your account is losing money or you are a novice trader, you can contact me. I can bring you more than 400% profit every week. If you don't make money, we don't charge any fees. Click in and take a look. You won't lose anything. Come in and take a look to help you!!! Free channels to gain wealth: t.me/+-ArNrDzhu7swMzU8
RamiGamil
GOLD BULLISH TREND!

Gold Is Still In A Bullish Trend & POSSIBILITIES Of The CONTINUATION Is HIGH
RamiGamil

Bitcoin (BTCUSD) has been consolidating within roughly a 5000 range (100k - 94.1k) for the past 12 days. During all this time, it's been testing but never closed above the 1D MA50 (blue trend-line). There hasn't been a tighter consolidation of this duration in the past year and there is a technical explanation behind it.The 3-month pattern has been a Channel Up and the last sub-1D MA50 consolidation before the current one, has been its previous bottom formation on its Higher Lows trend-line. The 1D RSI sequences between the two bottom fractals are so far identical and it appears that we are now on the way to complete Leg (f), which is the final step before a Double Bottom is formed. A new 1D MACD Bullish Cross may come as confirmation of the new Bullish Leg.As a result, the market is close to its most optimal buy opportunity. Given that a 1.5 Fibonacci extension Target has been a fair expectation within this Channel Up, our medium-term Target on BTC after the new Bullish Cross would be $112000, which is still below the 1.5 Fib ext and very close to the top of the Channel Up.
RamiGamil
Gold will rally from support levels!

Not a long time ago, price reached support level and broke it, after which made a retest and started to grow in channel.In channel, Gold rose to $2880 level, but at once made correction to support line of channel and then continued to grow.Soon, price broke $2880 level and rose to resistance line of channel, where it turned around and started to decline.Gold exited of channel and continued to trades in a wedge, where it fell to support line and then bounced up.Later it reached resistance line of the wedge, but recently it dropped to support line and now it rising near this line.In my mind, Gold can bounce up from support line to $2950, thereby exiting from the wedge pattern.t.me/+-ArNrDzhu7swMzU8 Do you want to make your life better? Do you want your wealth to grow? Whether your account is losing money or you are a novice trader, you can contact me. I can bring you more than 400% profit every week. If you don't make money, we don't charge any fees. Click in and take a look. You won't lose anything. Come in and take a look to help you!!! Free channels to gain wealth: t.me/+-ArNrDzhu7swMzU8
RamiGamil

I think BTC trend after a bear trend will be upward to 125000 $.t.me/+-ArNrDzhu7swMzU8 As you can see, we have made huge profits recently by trading gold and Bitcoin. If your account is losing money and you want to recover your losses, you can contact me. No matter how much money you have, I can help you! Click to join us: t.me/+-ArNrDzhu7swMzU8
RamiGamil

Daily scenario: falling wedge, rising support. Oversold rising Stoch RSI, MACD nearing crossover.Long opportunity in case of a D close at about 98k (or over) can be achieved, within few days.Expect growing selling pressure close to such breakout level and close to 102k $ mark if the wedge is broken up.Nearing 102k would imply a further possibility to visit ATH area.Flio of the coin: short term scenario is invalidated on a D close below 92,5k $.t.me/+-ArNrDzhu7swMzU8 As you can see, we have made huge profits recently by trading gold and Bitcoin. If your account is losing money and you want to recover your losses, you can contact me. No matter how much money you have, I can help you! Click to join us: t.me/+-ArNrDzhu7swMzU8
Disclaimer
Any content and materials included in Sahmeto's website and official communication channels are a compilation of personal opinions and analyses and are not binding. They do not constitute any recommendation for buying, selling, entering or exiting the stock market and cryptocurrency market. Also, all news and analyses included in the website and channels are merely republished information from official and unofficial domestic and foreign sources, and it is obvious that users of the said content are responsible for following up and ensuring the authenticity and accuracy of the materials. Therefore, while disclaiming responsibility, it is declared that the responsibility for any decision-making, action, and potential profit and loss in the capital market and cryptocurrency market lies with the trader.