
Ralx-Gls
@t_Ralx-Gls

What symbols does the trader recommend buying?
Purchase History
پیام های تریدر
Filter
Signal Type
Ralx-Gls

The collapse of large gold? The gold pair against the US dollar (Xauusd) recently witnessed a strong upward movement. But I think this movement is about to end. The occurrence of a correction after this upward movement is very possible, as the price began to show early signs of sellers entry with caution. I target a level at about 3,400. But it is the price alone that will give us clear indications of the first sale pressure. And if the price gives us a confirmation sign here, this may be a sign of engagement: not only in the Japanese candles structure, but also in the trading volume behavior. The second possibility is the movement continued up, but this requires more effort than buyers.
Ralx-Gls

Bitcoin continues to climb towards the level of resistance Hello, traders, I would like to share your opinion on Bitcoin. It seems that the lengthy correction stage of Bitcoin is nearing completion, as the price movement indicates a significant transformation of the momentum. After a complex trip through different corrective patterns, the price was a strong support base at the 108800 area, and it has now achieved a decisive breakthrough from the last declining resistance line. Currently, after this penetration, the Bitcoin price is witnessing a strong bullish rush, confirming the new budget momentum and decisively away from the previous monotheism area. The main hypothesis is a long -term scenario that expects a short corrective movement before the next main height. The price is expected to decrease a little soon to re -test the broken resistance line recently, stressing that it is new dynamic support. A successful and certain reversation of this test can confirm the force of penetration and indicates that buyers are still controlling the market, which may lead to a continued apostasy towards height. Thus, the profit reaping point for this penetration and continuation is logical at the level of 115800, which is in line with the main horizontal resistance level and the seller area.
Ralx-Gls

Gold reaches 3500: purchase when declines is still the best strategy I stated last week that if gold exceeds the level of 3380, it will not be the level of 3400 obstacles, and we may witness an acceleration of about 3450, and even 3500. ✅ On Friday, the gold reached my goal at 3450. ✅ Last night, the market recorded the highest new standard above 3500. ______________________________________ The main question: After 6 consecutive days of semi -vertical height, did the correction finally start? ______________________________________ What is the reason for the possibility of correction: • Gold rose by more than 1000 points within a few days. • Every daily decrease has been bought strongly - a sign of the risk of fatigue. Technically, support areas now appear at 3470 and 3450. ______________________________________ Trading plan: The sale here is fraught with risks in light of this strong direction. Instead, the strategy is simple: 👉 Wait for the correction. 👉 Look for purchase when declines. ______________________________________ Conclusion: My favorite style is still buying when declines, as the upward trend is still strong. Gold can easily continue to rise above 3500 during the next few days. 🚀
Ralx-Gls

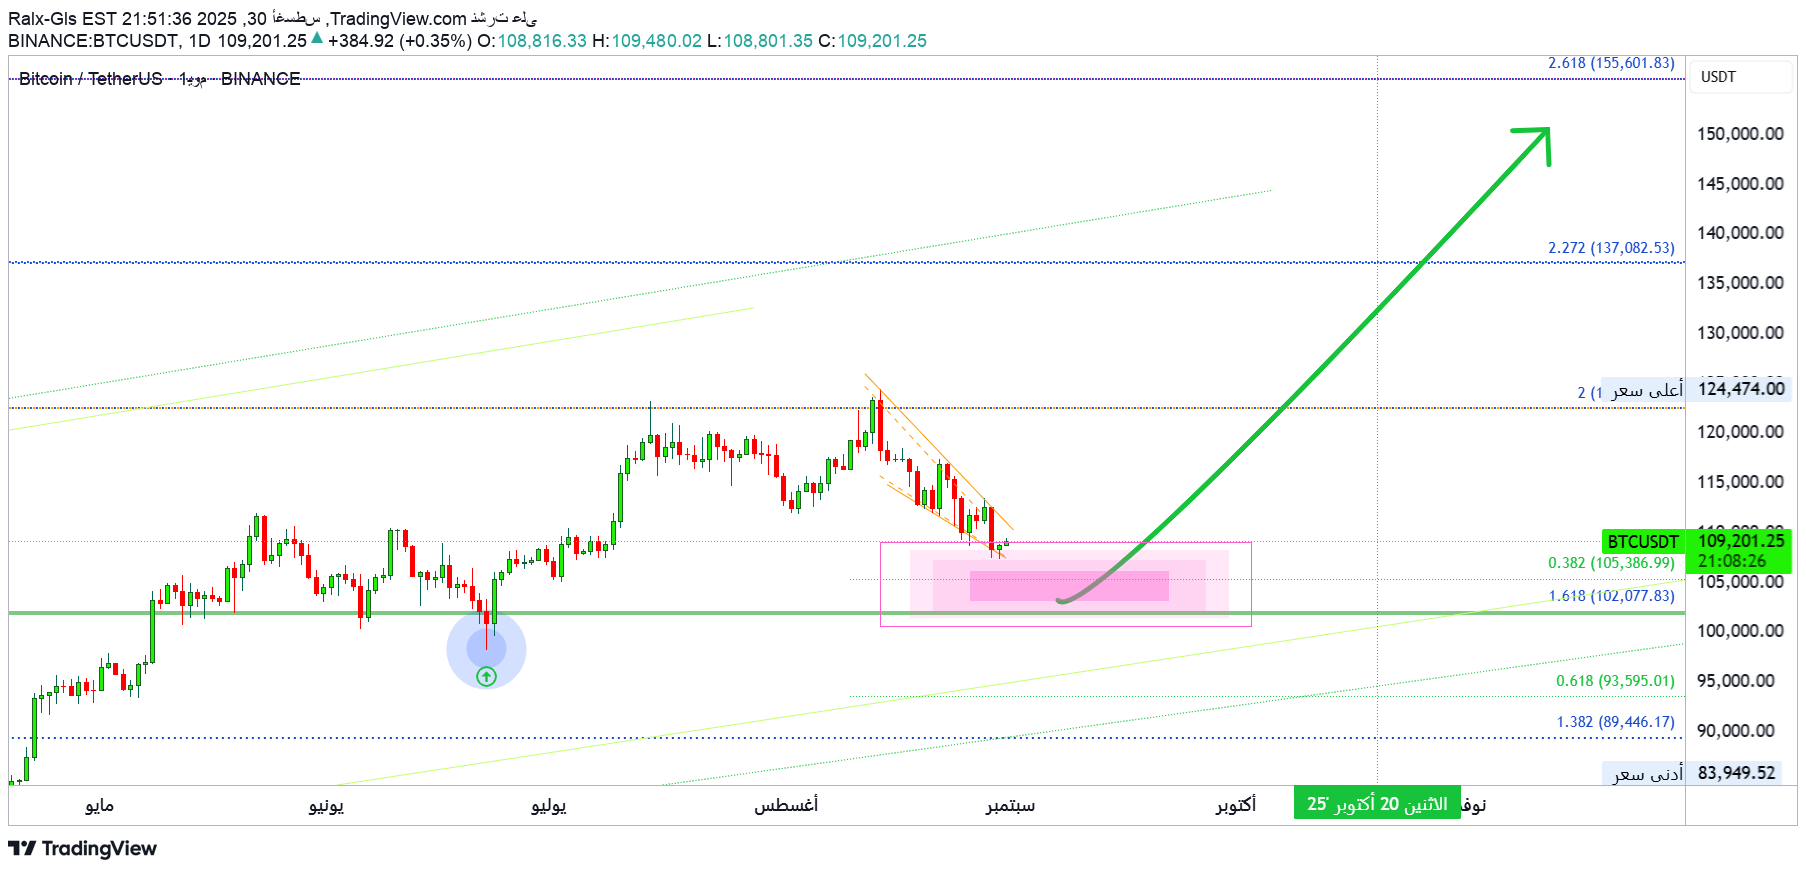
BTC/USDT graph analysis - one day! Bitcoin price is settled over the support area at $ 108,000 (green box). This area represented a demand area, which prevented a further decline. Temple: After breaking out of the prodigy pattern previously, the price is firm near the support, with a lower beam showing a defense for buyers. Ishimoko cloud: The price is still in the cloud area, indicating neutral expectations to upward. A strong daily closure above $ 110,000 may lead to an increase in momentum. The following goals: A bi -up penetration → move towards a region of $ 116,000 - 120 thousand US dollars (dropping the green arrow). In the event that support fails → the risk of re -testing about a region of $ 104,000 - $ 102,000. ⚡ Trends: The market is at a decisive level - maintaining the level of 108,000 USD may lead to a strong recovery; Its loss may lead to more correction.
Ralx-Gls

Bitcoin weekly graph: If the weekly candle is reflected from 109,061 thousand, the re -test of the broken support may be the next offer ceiling, and our goal in this sale will be 98,995 thousand. The probability of trading is 100%. Please manage your risks.
Ralx-Gls

3500! The price of gold returns, and purchasing power is still standing. Gold Information: Gold (Xau/USD) has regained its momentum in Asian trading on Monday, up to its highest level in five months near 3470 dollars, as the federal reserve expectations were warned of profit. The recent American inflation data has strengthened expectations by reducing interest rates in September, while GDP reports and positive unemployment requests supported the dollar last week for a short period, which limited alloys. Personal Reviews: The optimists dominate, and strong upscale momentum. The price of gold is awaiting return to the highest level ever 3500 ⭐️ Preparing the price of gold: Gold area: 3498-3501, stop loss: 3505 The first profit goal: $ 3490 The second profit goal: 3480 USD The third profit goal: $ 3470 🔥 Gold area buying: 3446-3444 USD, stopping the loss: $ 3439 The first profit goal: 3458 USD The second profit goal: $ 3470 The third profit goal: 3480 USD Technical analysis: Based on technical indicators (EMA 34 and EMA89) and support and resistance areas, we create a reasonable purchase order.
Ralx-Gls

A ritual bullish wave coming to gold Hello, traders, Since my last publication, gold has witnessed a bullish correction and another declining movement, as I mentioned in my previous expectations. It turned out that the wa wave was very driving. After the correction at the daily FVG index ended, I knew that we would witness an upcoming bullish wave. So, the climb may continue next week to reach the highest new standard. Let's see how the price will interact. The idea of trading: Wait for a slight correction on a lower time frame, and a change in the flow of orders to my rise, to circulate purchase deals.
Ralx-Gls
Oh my God, Bitcoin collapses · Buy when declining Oh my God, Bitcoin collapses. Note the validity of this graph. Doesn't it look strong? I mean, what do you see? Do you really see about $ 40,000? Do you really see this? Or do you see a simple classic or a market flow? The market flow is about $ 100,000. Oh my God, Bitcoin collapses. Today I looked at the price of Bitcoin and was 107,000 dollars. I thought: "Oh my God, this is a very high price." My God, Bitcoin collapses ... However, trading is still over $ 100,000. If all this strength is required to make a slight bounce, from $ 120,000 to $ 100,000, do you really think that pessimists will control the situation? Do you really think that the sellers will sell forever and that the price of bitcoin will drop below 80 thousand? This is not possible. "80,000 has already lost!" Do you remember? $ 100,000 has already lost. It does not look like a descending market, but rather a wave of flow. Remember this regarding the current market event: it happens and ends in one day. If the flow begins now, it will end later today. Once the price reaches the lowest level, this is the beginning of the next upward wave. How much time? One day, two days? It doesn't matter. We are ready to buy and keep. Buy when declining. The rise market has not yet ended. Change your point of view.
Ralx-Gls

Supporting an authentic retreat of Bitcoin/US dollar at 109,040 Bitcoin's pair/US dollar remains in a bullish direction, as the last price movement showed signs of a corrective decline in the broader upward trend. Support area: 109,040 - Main level of previous cohesion. The price is currently testing or approaching this level. The bullish reversion of the level of 109,040 will confirm the continuation of the upscale momentum, with possible goals at: 115,420 - Initial resistance level 117,400 - psychological and structural level 119,260 - stretch resistance level on long -term graph Detate scenario: Daily fracture and daily closure will weaken 109,040 ups, and indicates the risk of a deeper drop towards: 106,470 - secondary support 104,340 - stronger support and possible request area Expectations: The upward trend is still present as long as the Bitcoin/US dollar pair remains above the level of 109,040. Constant fracture without this level may lead to the transformation of momentum towards a short -term decrease.
Ralx-Gls

Gold/US dollar - a short -term decrease, a greater rise in the future This is what I see: We see that gold is currently trading around 3,404 USD, coherent after a strong upward movement within the upscale spinning model. This model has now penetrated up, and the price movement shows a potential head and shoulders near its summit. The head and shoulders: The left shoulder, the head and the right shoulder are optimized, and the neck line is located around the 3,399-3,400 USD. If the price decreases and re -test this neckline, we may witness a short -term declining movement towards the target of the head and shoulders around 3,399 USD. This is a positive decline after the last height. The broader image (wedge): Although we may witness a short -term correction, the penetration of the larger wedge model indicates the continuation of the rise. The scalp target indicates a level of $ 3,430, which corresponds to the next resistance level.
Disclaimer
Any content and materials included in Sahmeto's website and official communication channels are a compilation of personal opinions and analyses and are not binding. They do not constitute any recommendation for buying, selling, entering or exiting the stock market and cryptocurrency market. Also, all news and analyses included in the website and channels are merely republished information from official and unofficial domestic and foreign sources, and it is obvious that users of the said content are responsible for following up and ensuring the authenticity and accuracy of the materials. Therefore, while disclaiming responsibility, it is declared that the responsibility for any decision-making, action, and potential profit and loss in the capital market and cryptocurrency market lies with the trader.