
RSibayan
@t_RSibayan

What symbols does the trader recommend buying?
Purchase History
پیام های تریدر
Filter
RSibayan
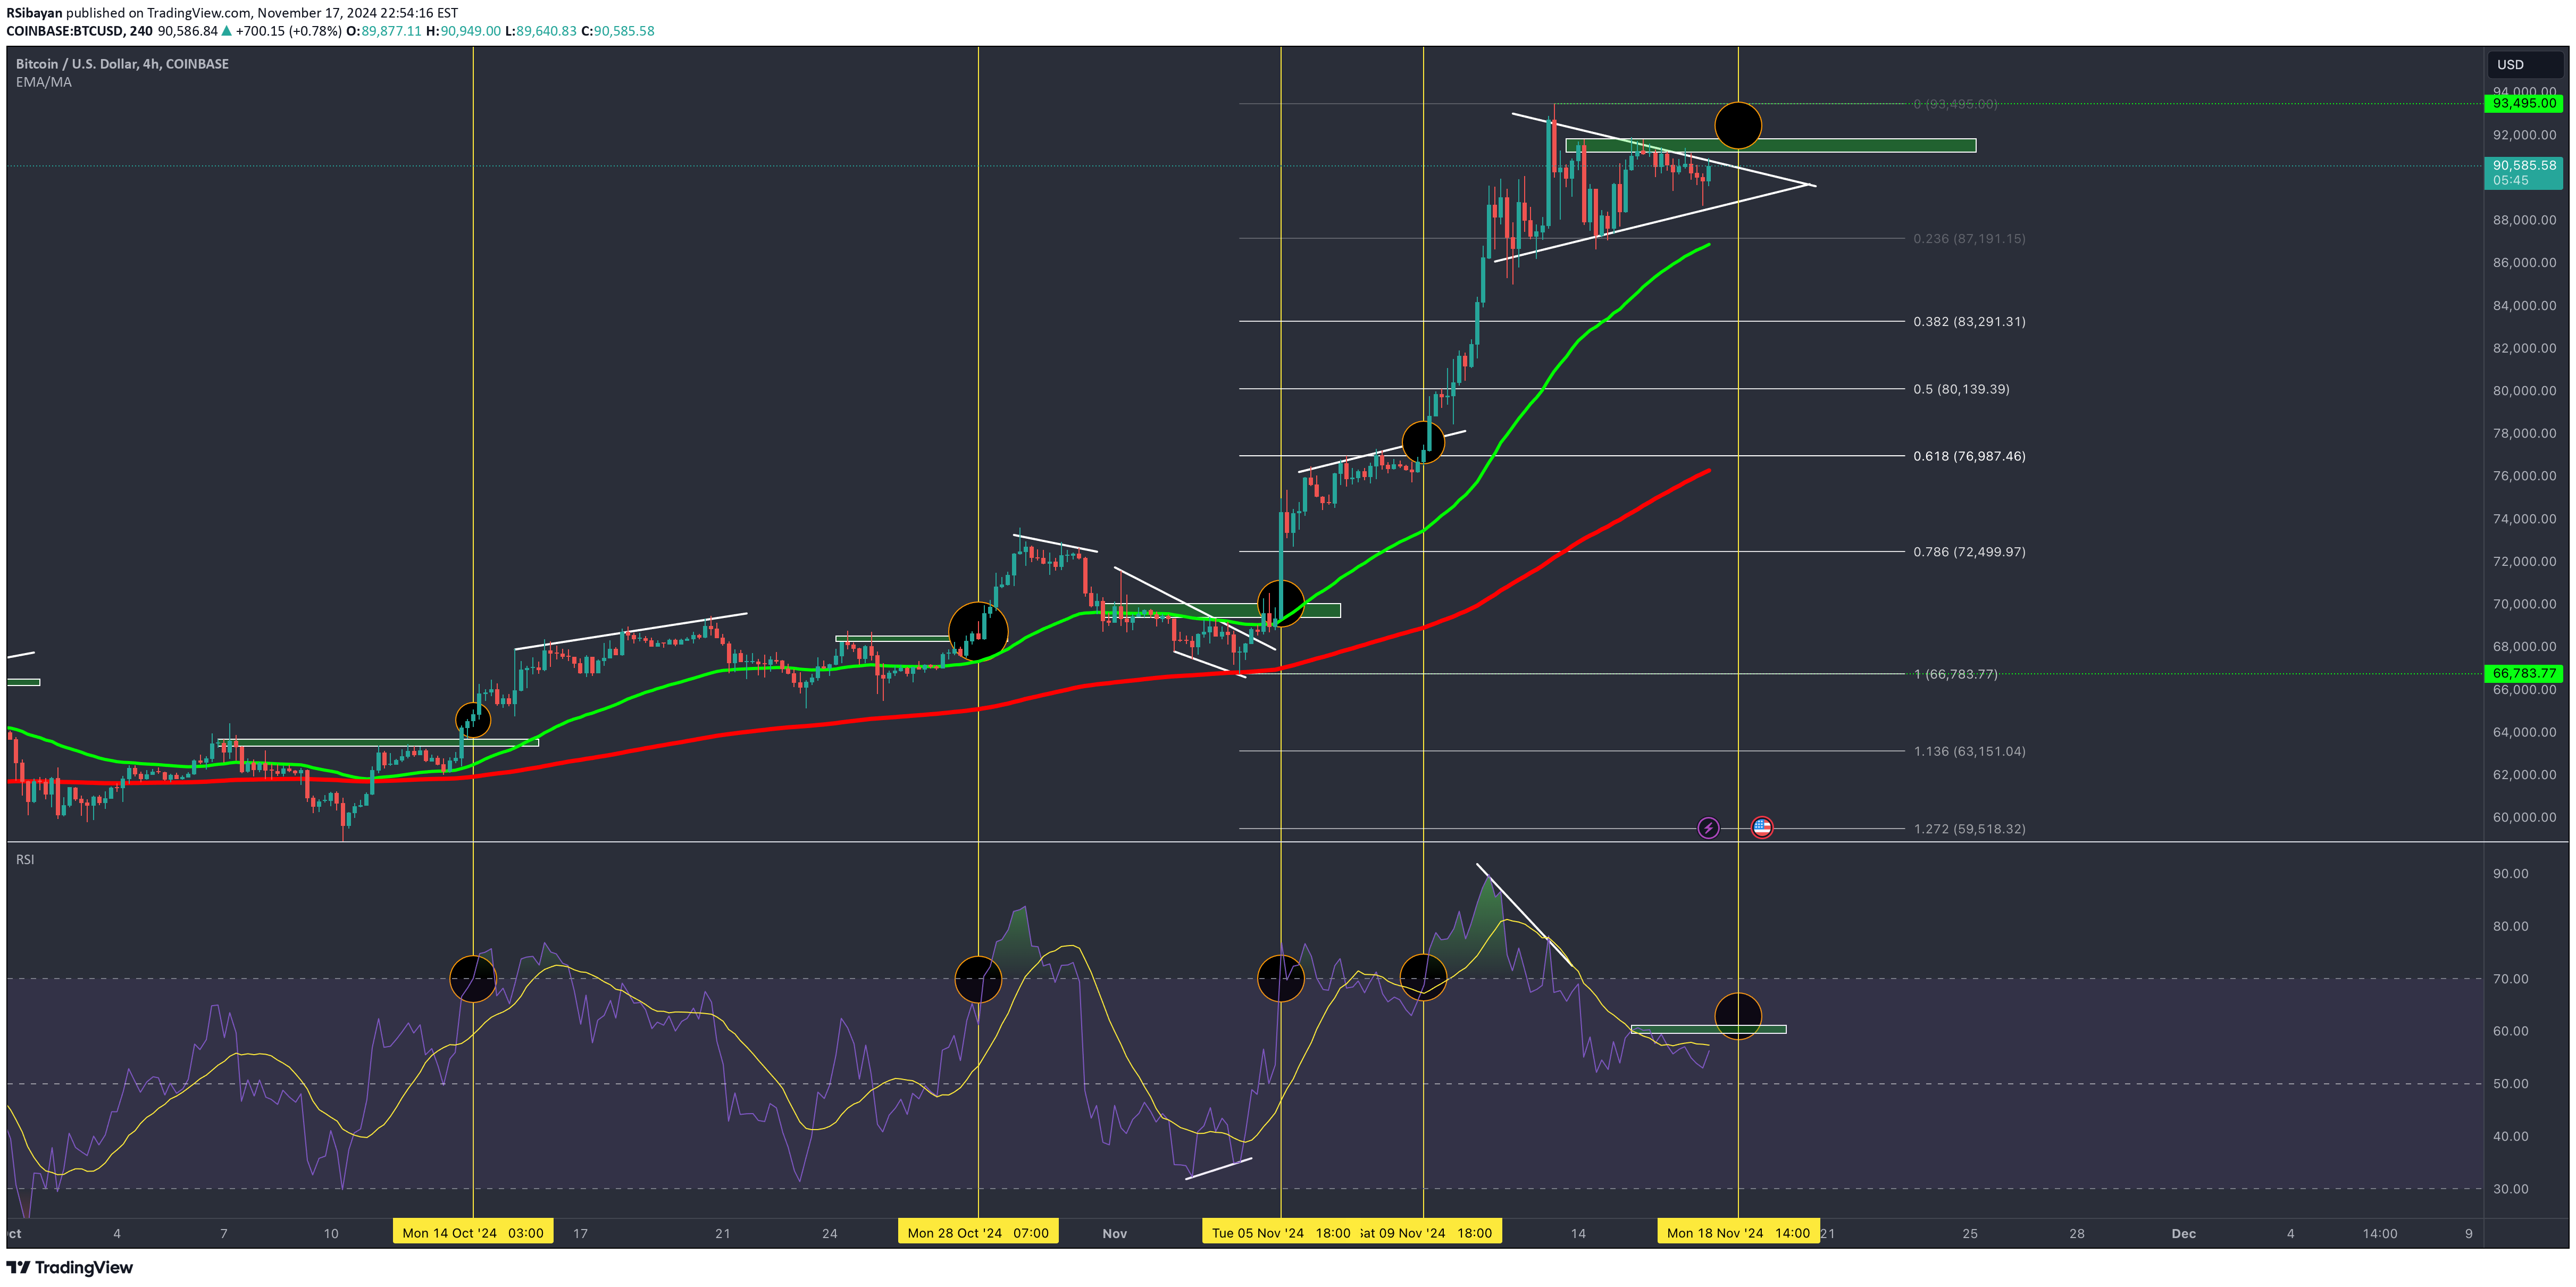
Bitcoin Triangle Breakout Looms Ahead

Hello traders, 4-hour BTC/USD (Bitcoin/US Dollar) chart. 🧠 Key Chart Elements 1. Chart Pattern A symmetrical triangle (white lines) "DIAMOND" - has formed near the top of the move following a double bottom breakout. The triangle indicates consolidation after a bullish move — often seen as a CONTINUATION pattern, but it can also break either way. 2. Double Bottom Clearly marked, confirming a reversal from bearish to BULLISH trend. The neckline breakout led to a strong push upwards, followed by this triangle pattern. 3. Targets Long Target: Above 91,000 to 93,000 zone — likely measured from the triangle breakout. Short Target: Around the 75,000-76,000 support zone — below key ascending trendline. 4. 50 EMA (Green Line) The price is above the 50 EMA, suggesting bullish momentum is intact unless the 50 EMA breaks down. 5. MACD Indicator The MACD lines are slightly bearish right now — potentially signaling a temporary pause or dip, but not a strong downward trend yet. 📊 Prediction: Two Likely Scenarios ✅ Bullish Scenario (Most Probable – 60%) Why: Price is above EMA, double bottom breakout, triangle after impulse move, volume likely compressing. Confirmation Needed: A breakout above the triangle resistance (around $85,000–$85,500). Target: Move toward the long target zone at 91,000–93,000. Support: Horizontal green zone and EMA provide a cushion. ❌ Bearish Scenario (Less Likely – 40%) Why: Weak MACD signal + triangle patterns can break either way. Bearish Trigger: A strong breakdown below triangle support and EMA, especially a candle close below ~$83,000. Target: Drop to the short target zone at $75,000–$76,000, possibly testing the trendline. 🔔 What to Watch For A volume spike to confirm breakout direction. MACD bullish crossover or continued divergence. Candle close outside the triangle — do not preempt without confirmation. 📌 Summary: The chart shows a strong bullish setup forming after a double bottom with consolidation in a symmetrical triangle. Most likely scenario is a bullish breakout targeting the 91K+ region, unless price breaks below ~ 83K , which would invalidate the bullish thesis and open room for a deeper pullback to $75K. More power to all your trades! Intrepid Trader
RSibayan
Bitcoin at a Crossroads: Will It Rebound or Dive Deeper?

Hello Intrepid Traders, Here is my analysis of the current 1-Day Bitcoin Chart Descending Resistance Trendline on RSI: The RSI still shows a clear descending resistance line. This reflects weakening momentum during each rally. If the RSI breaks above this trendline, it would be a leading indicator of a potential bullish breakout in price. Price Levels: The price is hovering near the first green support zone (~$93,000). This area aligns with horizontal support and could see short-term buying interest. If this zone is broken, the price could fall to the lower green zone (~$77,000-$80,000), where strong historical support lies. EMA Levels: The green EMA (50-day) is just below the current price and acts as dynamic support. Losing this EMA would confirm bearish momentum and increase the likelihood of further downside. The red EMA (200-day) near the lower support zone (~$80,000) offers long-term dynamic support. Bullish Scenario: A breakout above the descending resistance on RSI and the descending price trendline would indicate a reversal of the current downtrend. The immediate resistance for such a breakout would be around $100,000. Bearish Scenario: A confirmed breakdown below $93,000 could trigger a move to the $77,000-$80,000 zone. The lack of RSI recovery and a continued downtrend would suggest prolonged selling pressure. Momentum: RSI is near neutral but leaning bearish. Without a breakout, momentum remains weak, increasing the risk of further declines. Bitcoin is at a pivotal point. If the descending resistance trendline on RSI is broken, a bullish move to retest $100,000 is possible. However, failure to hold the $93,000 support and a continued RSI rejection may lead to a deeper correction toward $77,000-$80,000. --------------------------------------------------------------------------- Disclaimer The information provided herein is for educational and informational purposes only and should not be construed as financial or investment advice. Cryptocurrency trading involves significant risk and may result in substantial or complete loss of your investment. Past performance is not indicative of future results. Before engaging in trading or investing in cryptocurrencies, you should carefully evaluate your financial objectives, experience, and risk tolerance. It is strongly advised to consult with a qualified financial advisor or professional before making any investment decisions. The content provided does not constitute a recommendation, endorsement, or solicitation to buy, sell, or hold any cryptocurrency or related financial instruments. Market conditions can be highly volatile, and prices can fluctuate dramatically due to factors such as market sentiment, regulatory developments, or unforeseen events. You are solely responsible for your trading or investment decisions, and you assume full risk for any financial losses incurred. We are not liable for any direct or indirect damages arising from your use of this information or participation in cryptocurrency trading activities. By accessing or using this information, you acknowledge and accept this disclaimer in its entirety. --------------------------------------------------------------------------- Leave your question and or comments, I'd love to hear from you. More power to all your trades, my friends! Intrepid Trader
RSibayan
Bitcoin Nears $100K – Will It Break Out or Breakdown?

Hello again Intrepid Traders, Bitcoin’s price action is dancing along critical support and resistance zones, with the market approaching the psychological $100K level. Traders are eyeing Fibonacci retracement levels, EMAs, and RSI signals to forecast the next big move. With a rising wedge pattern forming and bullish EMA positioning, the market stands at a tipping point. Will Bitcoin break through, or is a pullback imminent? Analysis of Bitcoin 1-Hour Chart 1. RSI Analysis Current RSI Level: The RSI is hovering around 55, indicating mild bullish momentum, but it's not yet in overbought territory. This suggests that there’s room for upward movement, but a potential reversal could occur if resistance is met. Green RSI Bar: The green bar at the bottom of the RSI (around 20) highlights the oversold zone. The last time RSI dipped into this area, the price rebounded sharply, signaling a possible strong support zone if RSI revisits this level. 2. Price Action Support Zone: The price is currently above a major support area around $93,000 - $95,000. This zone has acted as a springboard for price bounces multiple times. Resistance Zone: The nearest resistance lies between $98,000 - $100,000, aligning with the Fibonacci 0.5 level ($99,841). This area has previously rejected price movements, creating short-term pullbacks. EMA Analysis: The 50 EMA (green) is crossing upwards, indicating bullish momentum, while the 200 EMA (red) sits lower, confirming an overall upward trend. Price action is currently following an ascending wedge pattern, hinting at potential consolidation before testing higher levels. Resistance Region: $98,000 - $100,000 Significance: This area aligns with the Fibonacci 0.5 retracement level ($99,841), marking a critical psychological and technical barrier. Historically, this region has acted as a strong rejection zone, preventing Bitcoin from breaking higher on multiple attempts. Current Price Action: Bitcoin is approaching this resistance while trading within an ascending wedge. The combination of rising price action and declining volume could indicate a potential false breakout or pullback from this area. Breakout Potential: If Bitcoin successfully breaks and holds above $100,000, the next target is the 0.618 Fibonacci level ($101,863), suggesting further bullish momentum. Failure to break this resistance could lead to a correction, reinforcing it as a short-term ceiling for price action. Key Observation: The convergence of EMAs and the wedge pattern near this resistance makes it a critical inflection point. A breakout could signify the start of a new bullish leg, while rejection could trigger a retest of lower support zones. Support Region: $93,000 - $95,000 Strength of Support: This area coincides with the 0.236 Fibonacci retracement level ($95,337) and has proven to be a solid bounce zone. The 200 EMA (red) is trending within this support, further reinforcing its strength. Market Reaction: Price action shows multiple rebounds from this area, highlighting buyer accumulation and demand. This region could serve as a buying opportunity on pullbacks, particularly for swing traders looking to enter long positions. Breakdown Risk: A break below this support could invalidate the bullish wedge structure, pushing Bitcoin toward the next major support around $91,000 - $93,000. Key Observation: As long as Bitcoin holds this support, bullish momentum remains intact. However, multiple retests weaken support over time, increasing the risk of eventual breakdown. Overall Sentiment Resistance Focus: Monitor price action closely near $98,000 - $100,000. A breakout could confirm bullish continuation, while failure may indicate consolidation or short-term correction. Support Zone: Consider accumulating on dips near the $93,000 - $95,000 region, with stop-losses below $93,000 to minimize downside risk. Potential Scenarios Bullish Scenario: If the price sustains above $96,000 and RSI stays above 50, expect a retest of the $98,000 - $100,000 resistance zone. A breakout from this region could propel the price toward $101,800 (Fib 0.618) and beyond. Bearish Scenario: Failure to break resistance near $98,000 - $100,000 could lead to a pullback to $95,000. If this level breaks, expect further declines toward the $93,000 support zone. Neutral Zone: A price squeeze between the ascending wedge and resistance could lead to sideways movement until a breakout occurs. Final Thoughts Bitcoin’s current trajectory reflects strength, but the market could face resistance at the $98,000 - $100,000 zone. A decisive move above this level signals bullish continuation, while a rejection might lead to a retest of lower supports near $95,000. Traders should monitor the RSI for divergence and watch price action near the ascending wedge’s upper boundary. As always, trade with caution. Leave your questions and respectful comments below. More power to all your trades! Intrepid Trader
RSibayan
Bitcoin’s $100K Showdown: Will Bulls Hold the Line?

Hello Intrepid Traders , We have here the 1 Hour Chart of BTC/USD pair on Coinbase. Bitcoin is navigating a critical point in its 1-hour chart, trading within a well-established ascending channel while hovering near the psychological $100,000 mark. The RSI has dipped near its oversold support zone, historically signaling potential reversals, but bearish divergence looms. With the 50 and 200 EMA providing dynamic support, is Bitcoin primed for a breakout or a deeper pullback? This analysis dives into the RSI, price action, and critical support and resistance levels to uncover what lies ahead for the king of crypto. 1-Hour Chart Analysis Key Observations RSI: The RSI is near 50, indicating market indecision. The green RSI zone marks historical oversold levels, signaling potential bullish reversals if touched. Price Action: Bitcoin is trading within an ascending channel with clear higher highs and higher lows. Support Levels: $100,000: Strong support near the channel's lower trendline and 200 EMA (red). Resistance Levels: $103,000 - $105,000: Key channel resistance and short-term target. EMA Analysis: The 50 EMA (green) is above the 200 EMA (red), signaling short-term bullish momentum. The 200 EMA ($100,000) acts as critical support. Scenarios and Suggested Actions Bullish Scenario: If RSI moves above 50 and the price holds above the 50 EMA, Bitcoin is likely to test $103,000 - $105,000. A breakout above the channel could push the price to $107,000 or higher. Bearish Scenario: If Bitcoin breaks below $100,000 and the RSI dips into the green oversold zone, expect a retracement toward $97,000 - $98,000 or lower. Action Plan: Short-Term Traders: Buy on a breakout above $101,000 with a target of $103,000 - $105,000. Sell or short on a breakdown below $100,000, targeting $97,000. Long-Term Investors: Hold or buy more at $97,000 - $100,000 for long-term gains. Final Thoughts Bitcoin is at a crucial juncture. While the ascending channel and the RSI’s green zone suggest potential for a bullish rebound, the indecisive RSI near 50 and critical support around $100,000 mean the market could swing in either direction. Traders should monitor the RSI closely—if it rebounds above 50, expect bullish continuation toward $105,000 or higher. Conversely, a breakdown below the channel’s support near $100,000 would signal bearish pressure, with targets around $97,000 or lower. Whether you’re bullish or bearish, this is a time for careful planning. Dynamic supports like the 50 and 200 EMA can provide good entry points, but risk management is key in this volatile zone. Leave your questions and comments below. More power to all your trades! Intrepid Trader Disclaimer: This analysis is for educational purposes only and should not be considered financial or investment advice. Trading cryptocurrencies involves significant risk. Always conduct your research or consult a professional advisor before making trading decisions.
RSibayan
Bitcoin Near $100K: Consolidation or Correction?

Hello Intrepid Traders, We have here the 1 Hour Chart of BTC/USD pair on Coinbase. Analysis of Bitcoin 1-Hour Chart 1. Support and Resistance Levels Support Levels: $93,000 - $94,000: This level aligns with a previous consolidation zone and the 200 EMA (red). It's a significant support level where the price has previously bounced. $96,000: This is a near-term support zone where the price consolidated before the recent breakout. Resistance Levels: $100,000: A key psychological resistance level that the price briefly touched before pulling back. Breaking above this level would likely attract further buying momentum. $108,000: The next likely resistance zone if $100,000 is broken, based on the height of the previous breakout. 2. RSI (Relative Strength Index) Current RSI: The RSI has fallen sharply below 50, suggesting bearish momentum in the short term. This indicates a cooling off after the recent rally. Overbought and Oversold Conditions: The RSI was previously in overbought territory above 70 during the rally to $100,000. If the RSI approaches the oversold region near 30, it could signal a potential reversal or bounce from support. 3. Price Action Consolidation: The price formed a symmetrical triangle before breaking out strongly upward. The recent pullback suggests a potential retest of the breakout zone (around $96,000). Consolidation between $96,000 and $100,000 is possible before a clear direction is established. Retracement: The price is retracing after the sharp move upward. It is currently near the 50 EMA (green), which could act as short-term support. If this retracement deepens, the next target would be the 200 EMA (red) at around $94,000. 4. EMA Analysis The 50 EMA (green) is above the 200 EMA (red), confirming a bullish trend on the 1-hour chart. A pullback to the 50 EMA or 200 EMA could provide potential buying opportunities if the price rebounds. Possibilities Bullish Scenario: If the price holds above the 50 EMA (green) and consolidates around $96,000, a bounce back toward $100,000 is likely. A breakout above $100,000 with strong volume could target the next resistance at $108,000. Confirmation of a bullish move would include the RSI moving back above 50. Bearish Scenario: If the price breaks below the 50 EMA, it could test the $93,000 - $94,000 support zone near the 200 EMA (red). A break below $93,000 would signal further downside, with the next support likely around $90,000. Disclaimer: This analysis is for educational purposes only and should not be considered financial or investment advice. Trading cryptocurrencies involves significant risk. Always conduct your research or consult a professional advisor before making trading decisions. Final Thoughts The Bitcoin 1-hour chart is at a critical juncture, with the price consolidating after a strong rally toward the key psychological resistance of $100,000. The symmetrical triangle breakout suggests bullish potential, but the current retracement and falling RSI indicate short-term weakness. Key Levels to Watch: Support: $96,000 (short-term), $93,000 (major support with the 200 EMA). Resistance: $100,000 (psychological) and $108,000 (measured breakout target). What to Look For: If the price holds above the 50 EMA and RSI moves back above 50, it could indicate renewed bullish momentum, potentially leading to another breakout attempt. A break below $93,000, however, would signal a deeper correction and a possible trend shift. Trading Strategy: For Bulls: Look for confirmation of support at $96,000 or $93,000 before entering. Watch for a breakout above $100,000 to ride the next leg up. For Bears: Wait for a clear breakdown below $93,000 with RSI staying below 50 to target lower support levels like $90,000. This is a time for patience and disciplined observation. Both scenarios—continued bullish breakout or deeper retracement—are plausible, so managing risk and waiting for confirmation are essential for any trade decision. Leave your questions and comments below. More power to all your trades! Intrepid Trader
RSibayan
Bitcoin Technical Buy Signal Setup
Hello Intrepid Traders , We have here the 4 Hour Chart of BTC/USD pair on Coinbase. This analysis evaluates Bitcoin's buy signals using the 50-EMA, 200-EMA, RSI, and Fibonacci retracement tool. Notably, the 200-EMA aligns with the 0.618 Fibonacci level, enhancing its significance as a key support. We’ll explore bullish and bearish scenarios while outlining a precise buy trade setup. Disclaimer: This analysis is for educational purposes only and should not be considered financial or investment advice. Trading cryptocurrencies involves significant risk. Always conduct your research or consult a professional advisor before making trading decisions. Analysis of Key Buy Signals Price Action Insights: Previous buy signals occurred near the 200-EMA (red), which correlates with the 0.618 Fibonacci retracement level (~$76,987). This confluence highlights the area as a critical support zone. The 50-EMA crossover above the 200-EMA confirmed upward momentum after price bounces at support zones. RSI Divergence: Buy signals coincide with bullish RSI divergences, where RSI shows higher lows despite price forming lower lows. RSI above 50 has consistently confirmed bullish momentum after reversals. Triangle Formation: Price is currently consolidating within a symmetrical triangle. Breakout direction will determine the next significant move. Scenarios Bullish Scenario: Conditions: Price breaks above the upper triangle boundary (~$93,000), confirming bullish momentum. RSI rises above 50, and the 50-EMA remains above the 200-EMA. Target Levels: First target at $93,495 (previous high). Second target at $95,000-$97,000. Bearish Scenario: Conditions: Price breaks below the triangle's lower boundary (~$87,000) and moves toward the 200-EMA (red) near the 0.618 Fibonacci level ($76,987). RSI falls below 40, confirming bearish momentum. Target Levels: Immediate target at $83,000. Deeper targets at $80,139 and $76,987 (0.618 retracement). Setup for the Next Buy Trade Entry Conditions: Breakout Setup: Enter above $93,000 if price breaks out of the triangle's upper boundary, with confirmation from RSI > 50 and bullish EMA alignment. Pullback Setup: Enter near $76,987 (200-EMA and 0.618 Fibonacci confluence) if price retraces but shows bullish RSI divergence or bounces at this critical support. Entry Points: Breakout Entry: $93,000. Pullback Entry: $76,987. Stop-Loss: For breakout: Below $90,000. For pullback: Below $74,000 (to account for false breakdowns). Take-Profit Targets: First target: $93,495 (breakout) or $83,000 (pullback recovery). Second target: $95,000-$97,000. Final Thoughts: This analysis highlights the critical alignment of the 200-EMA with the 0.618 Fibonacci retracement level as a robust support zone, alongside a symmetrical triangle signaling potential breakout opportunities. By combining key technical indicators, traders can prepare for both bullish and bearish scenarios with clear entry, exit, and risk management strategies. Remember, patience and discipline are essential to capitalize on these setups effectively. Leave your questions and comments below. More power to all your trades! Intrepid Trader
RSibayan
Strategic Buy Signal Analysis: High-Probability ETH/USD Trades

Hello Intrepid Traders , In identifying buy signals in ETH/USD pair we have to align key technical indicators with price action. This analysis focuses on support zones, EMA crossovers, RSI divergences, and a potential breakout from a descending channel to predict the next bullish move. By combining these factors, we can create a strategic setup for a high-probability trade. Let's dive into the details and prepare for the next opportunity. Analysis of Buy Signals The chart indicates several buy signals marked by circles, which align with the following key elements: Price Action: The buy signals occur near key support levels, as highlighted by green zones. The price often respects these areas, rebounding upward when combined with bullish signals from the RSI and EMA. RSI Correlation: Buy signals correspond to RSI levels showing bullish divergence or oversold conditions, indicating a potential reversal. The vertical lines highlight points where RSI and price action align, confirming the signals. EMA Interaction: A crossover of the green EMA (50) above the red EMA (200) often confirms a bullish momentum shift. These crossovers align with price action breaking out from a consolidation phase or a downtrend. Descending Channel Breakout: The latest part of the chart shows a descending channel forming. A breakout above this channel could signify the next bullish move. Scenarios Short-Term Outlook: The price is consolidating within a descending channel near a support zone. If the RSI begins to show bullish divergence and the price starts breaking above the upper trendline of the channel, it could signal the next upward movement. Mid-Term Outlook: If the price continues to hold above the green support zone (~$2,817), the next target would be the prior resistance near the $3,115-$3,300 range, as shown by the red zone. Setup for the Next Buy Trade Entry Conditions: Monitor for a breakout above the descending channel accompanied by a green 50 EMA maintaining its position above the red 200 EMA. RSI should confirm the move with a bullish divergence or a rise above the 50 level. Entry Point: Enter near the breakout of the descending channel, ideally close to the green 50 EMA line (~$2,850-$2,900). Stop-Loss: Place a stop-loss just below the nearest support level (~$2,800), accounting for potential false breakouts. Take-Profit Targets: First target: $3,115 (prior resistance). Second target: $3,300 (upper resistance zone in red). Adjust stop-loss to breakeven after the first target is hit. Confirmation Indicators: Look for increasing volume during the breakout. Ensure the RSI continues upward momentum without divergence as the price moves higher. This setup aligns technical signals (price action, RSI, and EMA crossovers) with strong support and resistance levels to create a high-probability trade. Disclaimer: This analysis is for educational purposes only and should not be considered financial or investment advice. Always conduct your own research and consult with a professional financial advisor before making any trading or investment decisions. Trading cryptocurrencies involves significant risk, and past performance does not guarantee future results. Leave your questions and comments below. More power to all your trades! Intrepid Trader
RSibayan
Ethereum Support & Resistance Analysis

Hello Intrepid Traders , Here's an Analysis of Support, Resistance, RSI, and Price Action for the ETH/USD pair. Support and Resistance Levels: Resistance Zone: Around the $3,400 - $3,500 range, marked by the red horizontal line. The price recently tested this level and pulled back, indicating strong resistance. Support Zones: Key support is visible in the $2,700 - $2,800 range, with multiple bounces in the past. Another potential support level lies around $2,400 - $2,500, which has previously held the price during downward movements. Moving Averages (50 EMA and 200 EMA): The 50 EMA (green) has crossed above the 200 EMA (red), forming a "Golden Cross." This crossover often signals bullish momentum and can suggest further upside if the price holds above these levels. The price is currently above both EMAs, indicating a bullish trend. However, the recent pullback toward the $3,000 level shows a need for caution in case of a deeper retracement. RSI Analysis: The RSI is around 58, suggesting mild bullish momentum but not yet overbought, meaning there’s room for upward movement if the buying pressure resumes. If the RSI remains above 50, it would indicate sustained bullish momentum . However, a dip below 50 might signal a shift towards a bearish trend or further consolidation. Price Action: Recent price action shows a pullback from the $3,500 resistance level, suggesting that sellers are active at this price point. If the price finds support around the $3,000 level or the 50 EMA, there could be a bullish rebound . However, a breakdown below this level might signal a deeper correction toward the $2,700 support zone. Psychological Levels are likely as follows: $3,000: This is a significant psychological level as it’s a round number and close to the current price action. It serves as a key support level, and holding above this could reinforce bullish sentiment. If the price drops below $3,000, it may indicate a shift in market sentiment, potentially leading to a deeper correction. $3,500: This level marks recent resistance and is another strong psychological level. Breaking above $3,500 would likely trigger increased buying interest, as it could signal a continuation of the bullish trend and indicate that the price is moving towards higher targets, like $3,800 or $4,000. $2,500: Serving as a lower support, $2,500 is also a round number and previously held as a support level. If Ethereum were to drop down to this level, it would be a major test of market sentiment, as a break below could lead to further declines toward $2,000. $4,000 (Upper Target Level): Although not shown in the immediate price action, $4,000 would be a major psychological milestone if the price continues to rise. Reaching or breaking above $4,000 would likely attract considerable interest and could signify strong bullish momentum. Potential Scenarios Bullish Scenario: If the price finds support around the $3,000 level or near the 50 EMA and bounces, it may retest the $3,400 - $3,500 resistance zone. A breakout above $3,500, confirmed by RSI staying above 50 and strong volume, could signal further upside with a potential target around $3,800. Bearish Scenario: If the price breaks below the $3,000 level and the RSI falls below 50, a deeper correction is likely. In this case, the price could test the next support around $2,700 - $2,800. A break below this support would open the path toward the $2,400 level. Leave your own predictions in the comments. More power to all your trades! Intrepid Trader
RSibayan
Ethereum Buy Signal Strategy Analysis

Hello Intrepid Traders, Here’s a method you can use to monitor for the next buy signal in Ethereum: Monitor the 50 EMA Keep an eye on the current price in relation to the 50 EMA (green line). For a buy signal, the price should move above the 50 EMA and remain there. Watch the RSI Level Look for the RSI to cross above 50. This indicator suggests buying momentum and provides additional confirmation if the price is also above the 50 EMA. Combined Trigger When both the price is above the 50 EMA and the RSI crosses above 50, it would generate the next buy signal according to the criteria. Key Observations from the Chart Trend Analysis: The price is currently above both the 50 EMA (green) and the 200 EMA (red), indicating a bullish trend. This trend suggests that any new buy signals may likely succeed if the bullish momentum continues. Support Zone: There is a horizontal support zone highlighted around $2,700 - $2,800, which has held strong. The price has previously tested this area, indicating a potential area of support where buyers may step in if the price retraces. Previous Buy Signals: The marked buy signals align with instances where the RSI was above 50, and the price crossed above or stayed above the 50 EMA, supporting a successful entry strategy. RSI: Currently, the RSI is above 50 but trending downward. If the RSI approaches 50 and then bounces, this could signal continued bullish strength if the price remains above the 50 EMA. Trade Prediction Strategy To find the next profitable trade, consider the following scenarios: Bullish Scenario (Continuation of Bullish Trend): Wait for RSI Bounce Above 50: If the RSI approaches but holds above the 50 level and starts to rise again, it suggests buying momentum. Confirm Price Above 50 EMA: Ensure the price remains above the 50 EMA during this time for added confirmation of bullish conditions. Entry Point: Buy when the RSI bounces off 50 and the price stays above the 50 EMA with solid momentum. Target: Use the recent high near $3,200 as a target or consider an extended target based on further trend analysis if momentum is strong. Stop Loss: Place a stop loss slightly below the support zone around $2,700 to protect against a false move. Bearish Scenario (Breakdown Below Support Level): Break Below 50 EMA and Support: If the price breaks below the $2,700 - $2,800 support zone and the 50 EMA, and the RSI drops below 50, this could indicate a trend reversal or correction. Confirm RSI Below 50: Wait for the RSI to stay below 50 to confirm bearish momentum. Entry Point: Consider a short position if the price drops below both the support zone and the 50 EMA. Target: Use a target derived from the height of the recent uptrend, measuring a potential retracement. Stop Loss: Place a stop just above the $2,800 level in case the breakdown is false and the price reverses. Additional Considerations Volume Confirmation: Look for increased volume on either the breakout or breakdown. Higher volume supports the validity of the move. Wait for Candle Close: Ensure the price closes above the descending trendline for a breakout (in the bullish scenario) or below the support level (in the bearish scenario) to avoid a false move. This setup offers a structured approach for monitoring Ethereum's price action to identify the next profitable trade based on current indicators. Leave your own predictions in the comments. More power to all your trades! Intrepid Trader
RSibayan
Bitcoin Trade Signal Analysis

Hello Intrepid Traders, Here’s a method you can use to monitor for the next buy signal: Monitor the 50 EMA: Keep an eye on the current price in relation to the 50 EMA (the green line on your chart). For a buy signal, the price needs to move above the 50 EMA. Watch the RSI Level: Look for the RSI to cross above 50. This indicator suggests buying momentum and adds confirmation to the price being above the 50 EMA. Combined Trigger: When the price is above the 50 EMA and the RSI crosses above 50, that would be your next buy signal based on the criteria you've been using. To identify the next potentially profitable trade use the following strategy and general technical analysis principles: Key Observations from the Chart Trend Analysis: The price is above both the 50 EMA (green) and the 200 EMA (red), indicating a strong bullish trend. This suggests that any buy signals are more likely to be successful if the trend continues. Support Zone: There appears to be a horizontal support level marked around $87,000. The price has tested this level multiple times without breaking below, which shows strong support in this area. Descending Triangle: A descending triangle pattern is forming with a series of lower highs converging towards the support level. This pattern typically suggests that a breakout (either up or down) may occur soon. RSI: The RSI is currently above 50 but not in overbought territory, which indicates some room for upward movement if buying pressure resumes. Trade Prediction Strategy To find the next profitable trade based on these conditions, consider the following scenarios: Bullish Scenario (Breakout Above Descending Triangle): Wait for a clear breakout above the descending trendline in the triangle pattern. Confirm that the RSI remains above 50 after the breakout and that the price stays above the 50 EMA. Entry Point: Buy on the breakout of the descending trendline if there is strong bullish momentum and volume support. Target: Use recent highs as target points, or measure the height of the triangle and add it to the breakout point for a price target. Stop Loss: Place a stop just below the support level around $87,000 in case of a false breakout. Bearish Scenario (Breakdown Below Support Level): If the price breaks below the $87,000 support level and the RSI drops below 50, this could indicate a shift in trend. Entry Point: Consider a short position if the price falls below the 50 EMA and the RSI remains below 50, signaling potential selling momentum. Target: Measure the height of the triangle and subtract it from the breakdown point to estimate a target. Stop Loss: Place a stop just above the $87,000 level in case the breakdown is false and the price reverses. Additional Considerations Volume Confirmation: Watch for a volume spike during the breakout or breakdown. Higher volume confirms the move and increases the likelihood of a profitable trade. Wait for Candle Close: Ensure the price closes above the descending trendline (for a breakout) or below the support level (for a breakdown) to avoid entering on a false move. This setup provides an approach for either a continuation of the bullish trend or a potential reversal. Monitor these conditions closely to make an informed decision based on the chart's developments. Leave your own predictions in the comments. More power to all your trades! Intrepid Trader
Disclaimer
Any content and materials included in Sahmeto's website and official communication channels are a compilation of personal opinions and analyses and are not binding. They do not constitute any recommendation for buying, selling, entering or exiting the stock market and cryptocurrency market. Also, all news and analyses included in the website and channels are merely republished information from official and unofficial domestic and foreign sources, and it is obvious that users of the said content are responsible for following up and ensuring the authenticity and accuracy of the materials. Therefore, while disclaiming responsibility, it is declared that the responsibility for any decision-making, action, and potential profit and loss in the capital market and cryptocurrency market lies with the trader.