
RP_cryptotrader
@t_RP_cryptotrader

What symbols does the trader recommend buying?
Purchase History
پیام های تریدر
Filter
RP_cryptotrader
MOVE hughe FW breakout incomming?
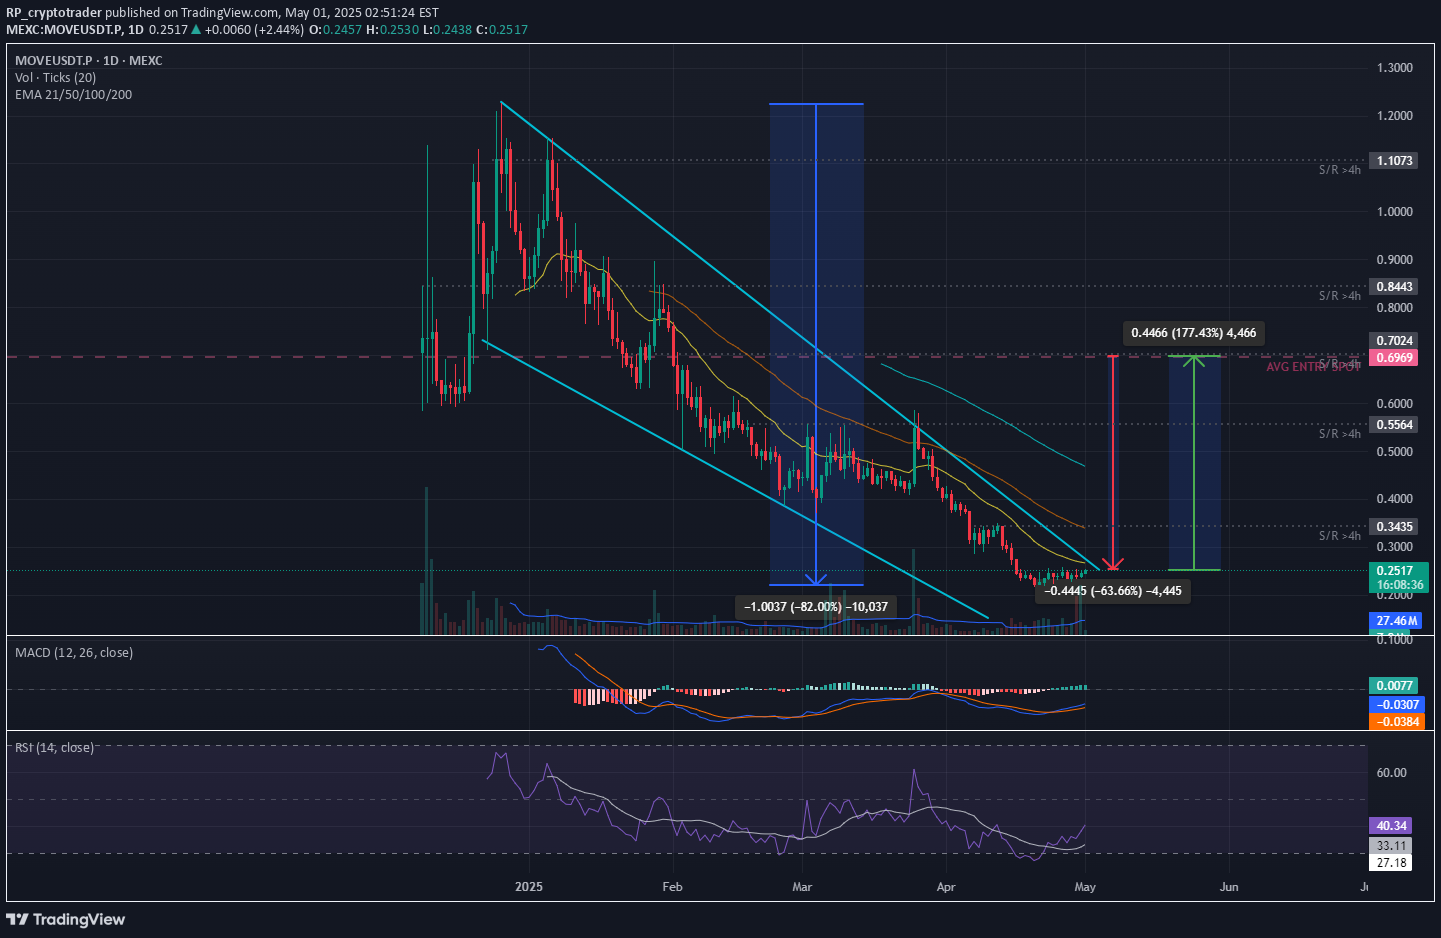
MOVE has been dropping over 80% from it's ATH. This looks like bearmarket scenario's. But as I did mention before in other posts. This bull cycle is different and especially for ALTCOINS. The massive growth in number of ALTS makes it hard to stand out and gain momentum. The money and social attention is widely spread over milions of coins now. The 1875 active accounts holding MOVE is reasonable for a relative new project jet it doesn't signal mass adoption. MOVE is a Layer1 / 2 and ZK coin in the smart contracts. It's also in the World Liberty Financial portfoilio and made in the USA. These fundamentals are bullisch for MOVE. A breakout from the FW pattern could make it take off at rocket pace towards the former highs. Allong the way we can see and identify several major S/R line that have to be broken first. Indicators: The rounded bottom / consolidation could mark the bottom. Stoch indicator: The STOCH shows signs of recovery Golden Cross: The short term MA has been crossing the Long term MA signaling recovery. Volume: The low volume is typical for the consolidation. CONSOLIDATION above support and below resistance The level where we find MOVE right now looks like consolidation and bottom possibility. With support at 0,218 a small resistance at 0,34 and a major resistance at 0,56. My trading plan for now: I will open a new bigger SPOT position in order to lower my AVG ENTRY that has lost over 60% in the last months. A run up from this level to the S/R level 0,56 means a 177% profit.
RP_cryptotrader
SUI A&E or pullback first
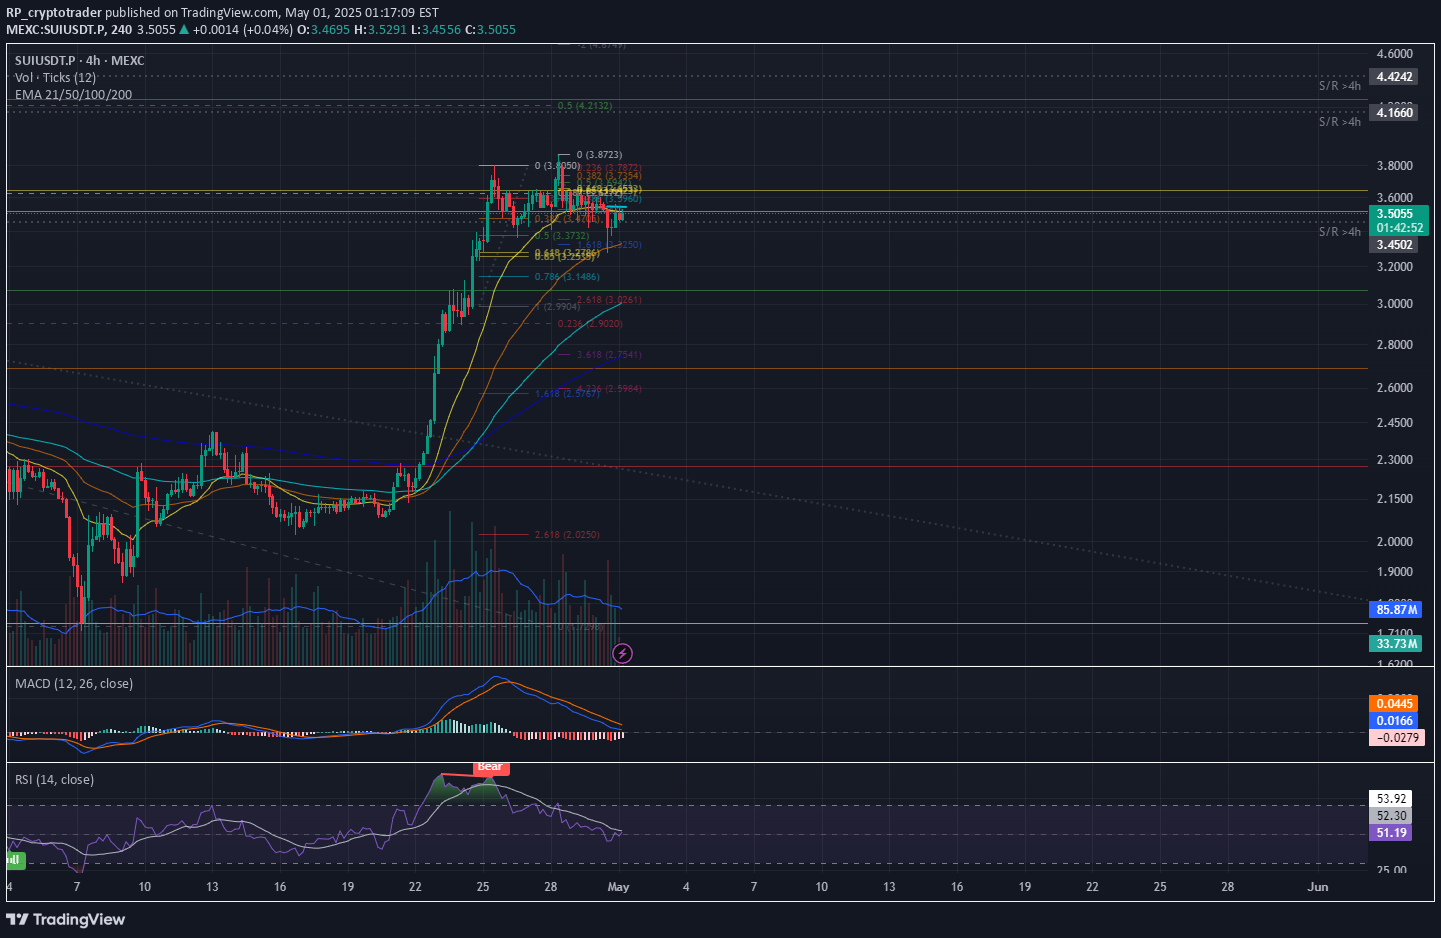
As BTC is keeping the line it looks lik it will pump towards 100K. In that level we can see a pull back to cool off the RSI. SUI is looking strong and made u huge revovery from the $1,70 level from the 7th of april. In teh 4 h Charts we cab see an Bull Flag pattern, wit a deviation of the high in this pattern. We need to see the recovery of the $3,86 level that must get support in orde to stay bullisch on the short term. Isn't this leven in soon then we can expect more retracement in the price alle the way towards the MA100 around $2,95 or even the MA200 at a level of $2,55.
RP_cryptotrader
JSMY A&E after the IH&S
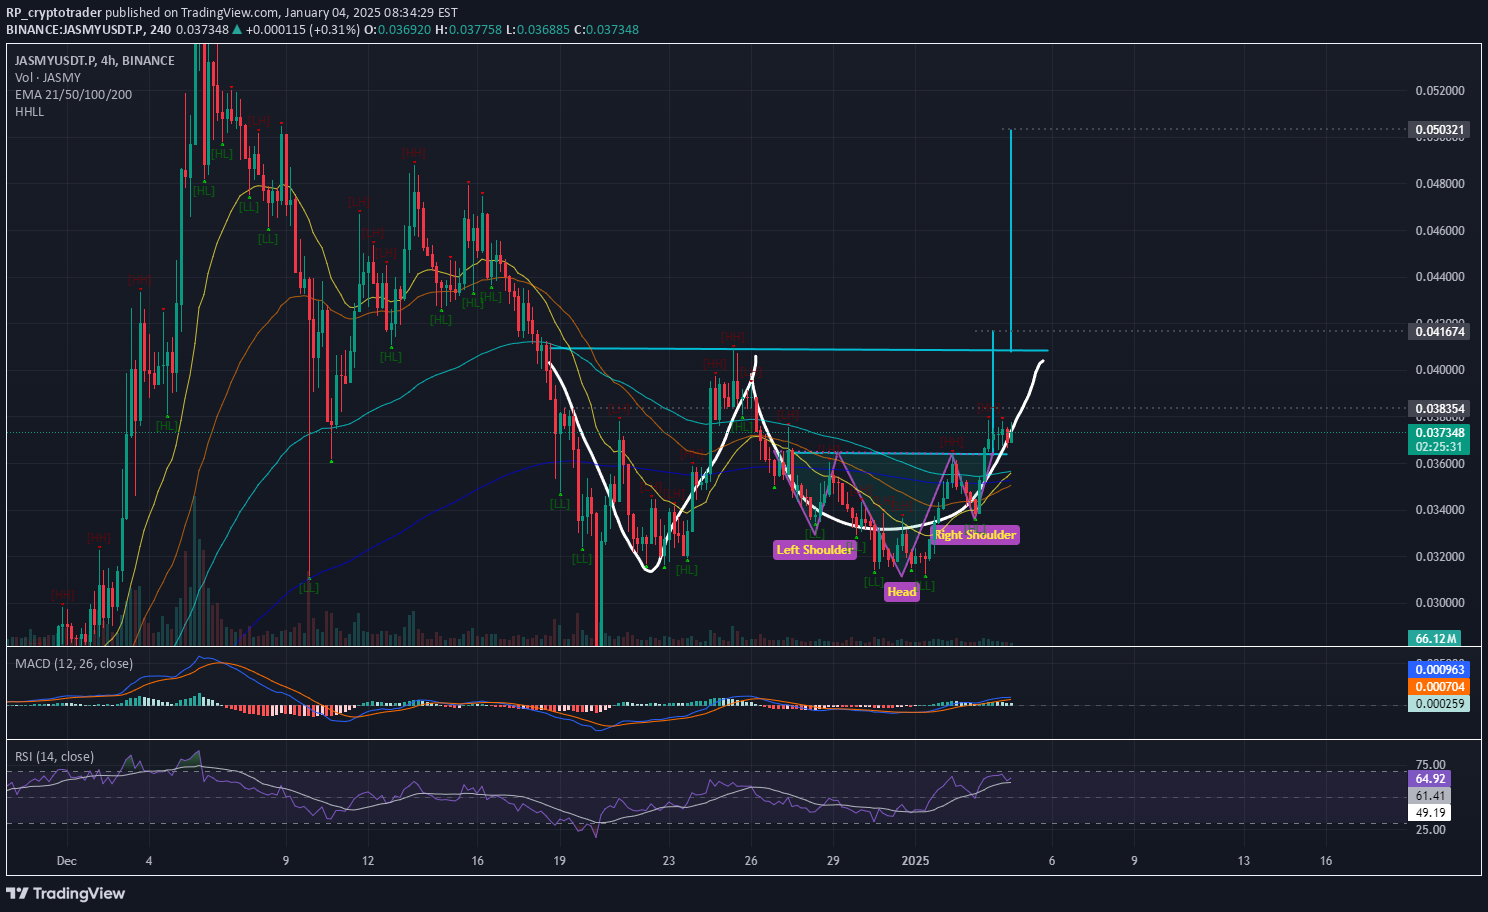
JASMY looks for a way up J JASMY Has broken the neckline of the IH&S (Inverse head & shoulders) and that target is the baseline for the A&E (Adam and Eve) drawn in white. The TT (technical target) of this Adam and Eve could jumpstart the revival of JASMY here. The top of the TT could reach the $0.05. And if it's coincidence that happoens to be a major S/R line. So reaching that target and breaking it would bring new highs for $JASMY. DYOR and use the fibonacci tools to see the potential targets and take profit on the way up. Are you i with leverage then check the potential pullbacks and place the stop loss accorinding to that data. HH and HL wil give you new places for the SL so use that if you want to secure your profits.
RP_cryptotrader
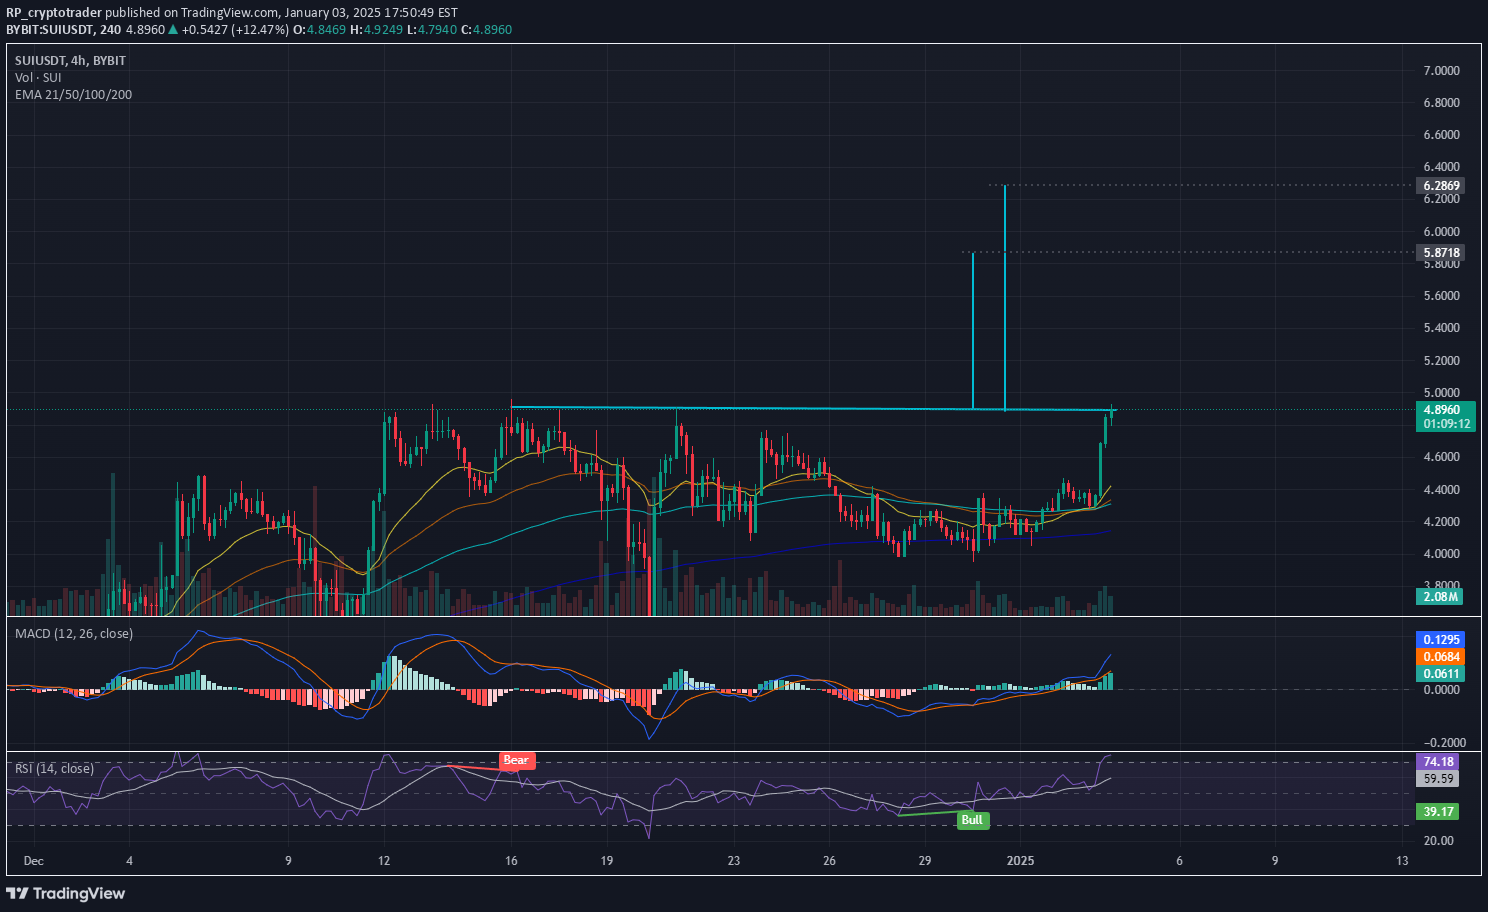
SUI 6th try was perfect trade
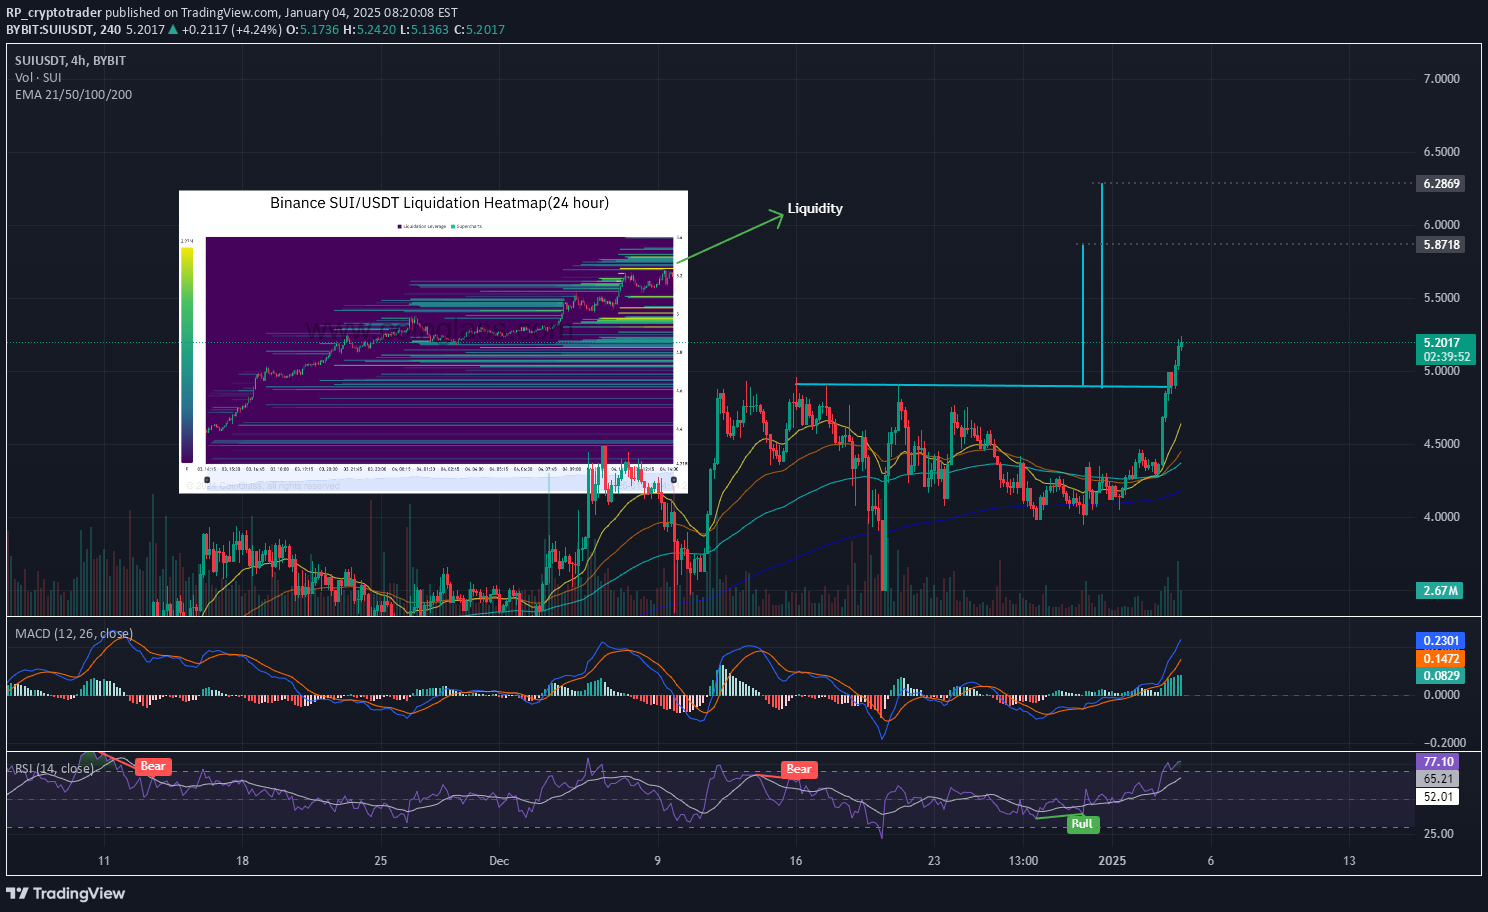
6th try was spot on for SUI As mentioned in my previous post SUI was testing the highs for the 6th time. Sooner or later one of these tests should make it. Most of the time i check them from the 4th on. Every try after has a higher probabillity for succes if the older test failed. SUI mad a clean breaktrough and retested the line of resistance making it support. Volume is good but we can also see that the bear volume is rather high in the red candles. Due to the new ATH there will be more and more people taking proffits at certain levels of the fibonacci trend for example. DYOR and take proffits along the way or move the Stop loss towards lows that should not break anymore. Next lever should be between $5,24 and $ 5,34 because that is where the next liquidity is hiding.
RP_cryptotrader
SUI takes a 6th try
SUI is trying to break the ATH. For the 6th attempt it looks a long shot. A cool down from here could force a 7th try before the resistance can be made support. TIP: set allerts so you won't miss out on this nice possible pump.
RP_cryptotrader
CPOOL Hanging man CS more red to come?
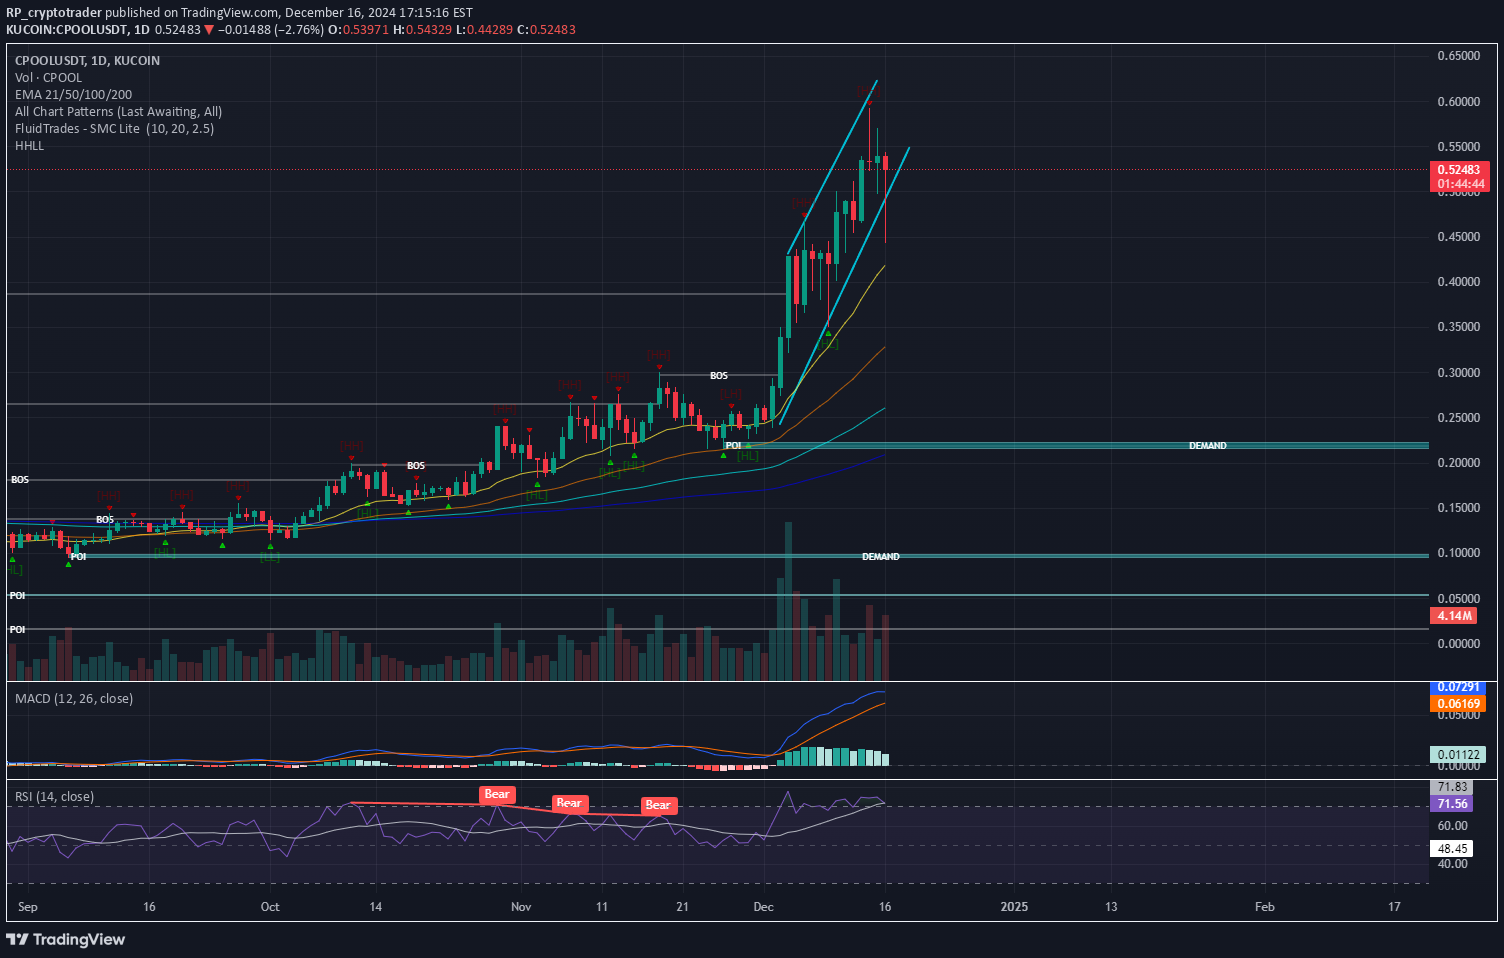
CPOOL on daily The chart on CPOOL looks rather bearisch with high wicks and a massive hanging man candlestick. After a nice run up this could signal the cool down for CPool. The RSI was overbought for a few days and did withdraw with a small way into the higher mid range before popping up again. With BTC making new ATH the market is awaiting the storm as it seems. Can we get a nice cooldown from here and see a nice entry or will CPOOL pick up the uptrend and steam on to new highs? I would be carefull with leverage longs at this point
RP_cryptotrader
Faling Wedge $PNUT major breakout ahead?!
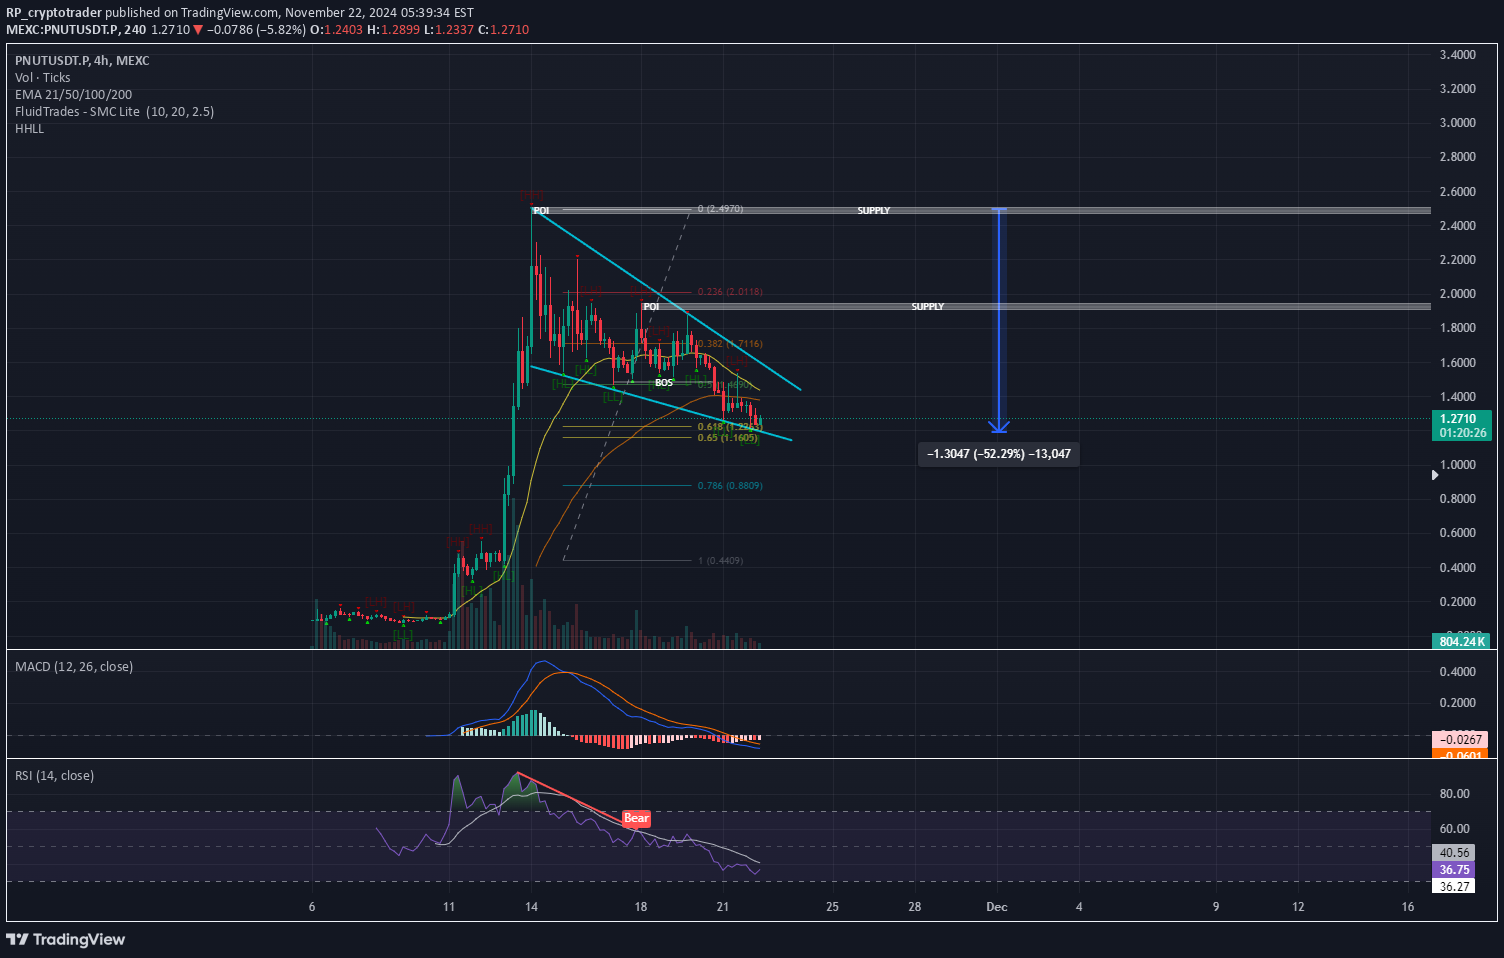
PNUT is gaining momentum by accumalation. Since it's all time high it has set of in a downtrend and lost 52% of the ATH price. An easy gain of 100% if the ATH gets reached again. The Faling wedge is a bullisch pattern that in most cases breaks out to the upside. On the lower timeframe we can identify a bottom and that could suggest that the break out is getting fuel for it's momentum. As long as BTC dominance is high we can see some more accumulation but that's just fine for the extra power in the way up. You can trade the FW on breakout and retest. The breakout preferably has larger volume then the last average volume. The second green candle after the retest is you signal to buy. Check this retest and confirmation on de the lower time frames so you'r not missing the sweetspot. If traded with leverage place a SL just a bit below the former low.
RP_cryptotrader
Does BTC go down even more? And what would that do with ALTS
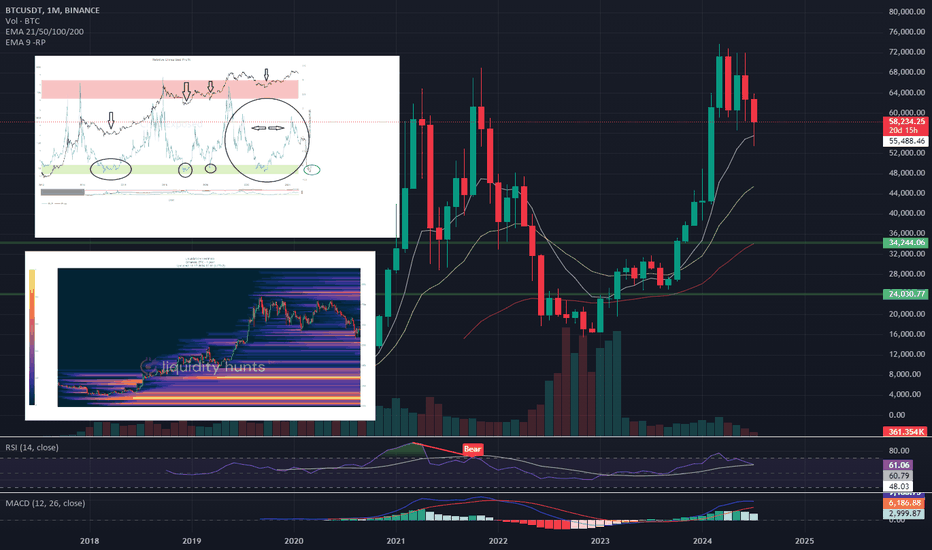
Did BTC make it bottom yet or will we see more red? If we look at the charts and the strong rejection of the current lows we would like to think we have seen the bottom. Relative Unrealized Profit That made me look into the RUP chart (Relative Unrealized Profit) on Chainexposed. If we analyse that chart we can see that the RUP in the green zone has been bottom signs. If we look in the red zon ther was always a top if we got there. The in the big circle we see a mirror image of 2022 vs 2024 and both can be seen as a H&S structure. Both have the same TT in the green zone. If we take this chart as leading sign we can sugest a uptrend from the current lows to form the right shoulder as drawn in the chart. The break of the shoulder and neckline would be the sign that we will go down towards the liquidity below the lows. Now this is nothing special in a regular bullmarket. But what if i was too tell you that the first real liquidity for BTC is as far down as 32k... Yes you did read it correctly. Almost all liquidity between the 56k and 42k where it was for a week or two ago is gone now. So in my opinion there ar two main scenarios possible here. Scenario 1: We will see new liquidity from retail investors building up just below the current lows and that will bring enough fuel for the bulls to proceed with the bull run and break the ATH. Scenario 2: Retail is so affraid (by FUD and the loses on alts) that they will not have the believe in the uptrend now. Then that would mean they are not likely to buy or go long now. Then the liquidity range below stays rather thin and there is lack of fuel for the bulls. Will that trigger a flash sale all the way down towards the 32k? What are your thoughts on these scenarios? Please let me know in the comments.
RP_cryptotrader
ATH - Aether accumulating
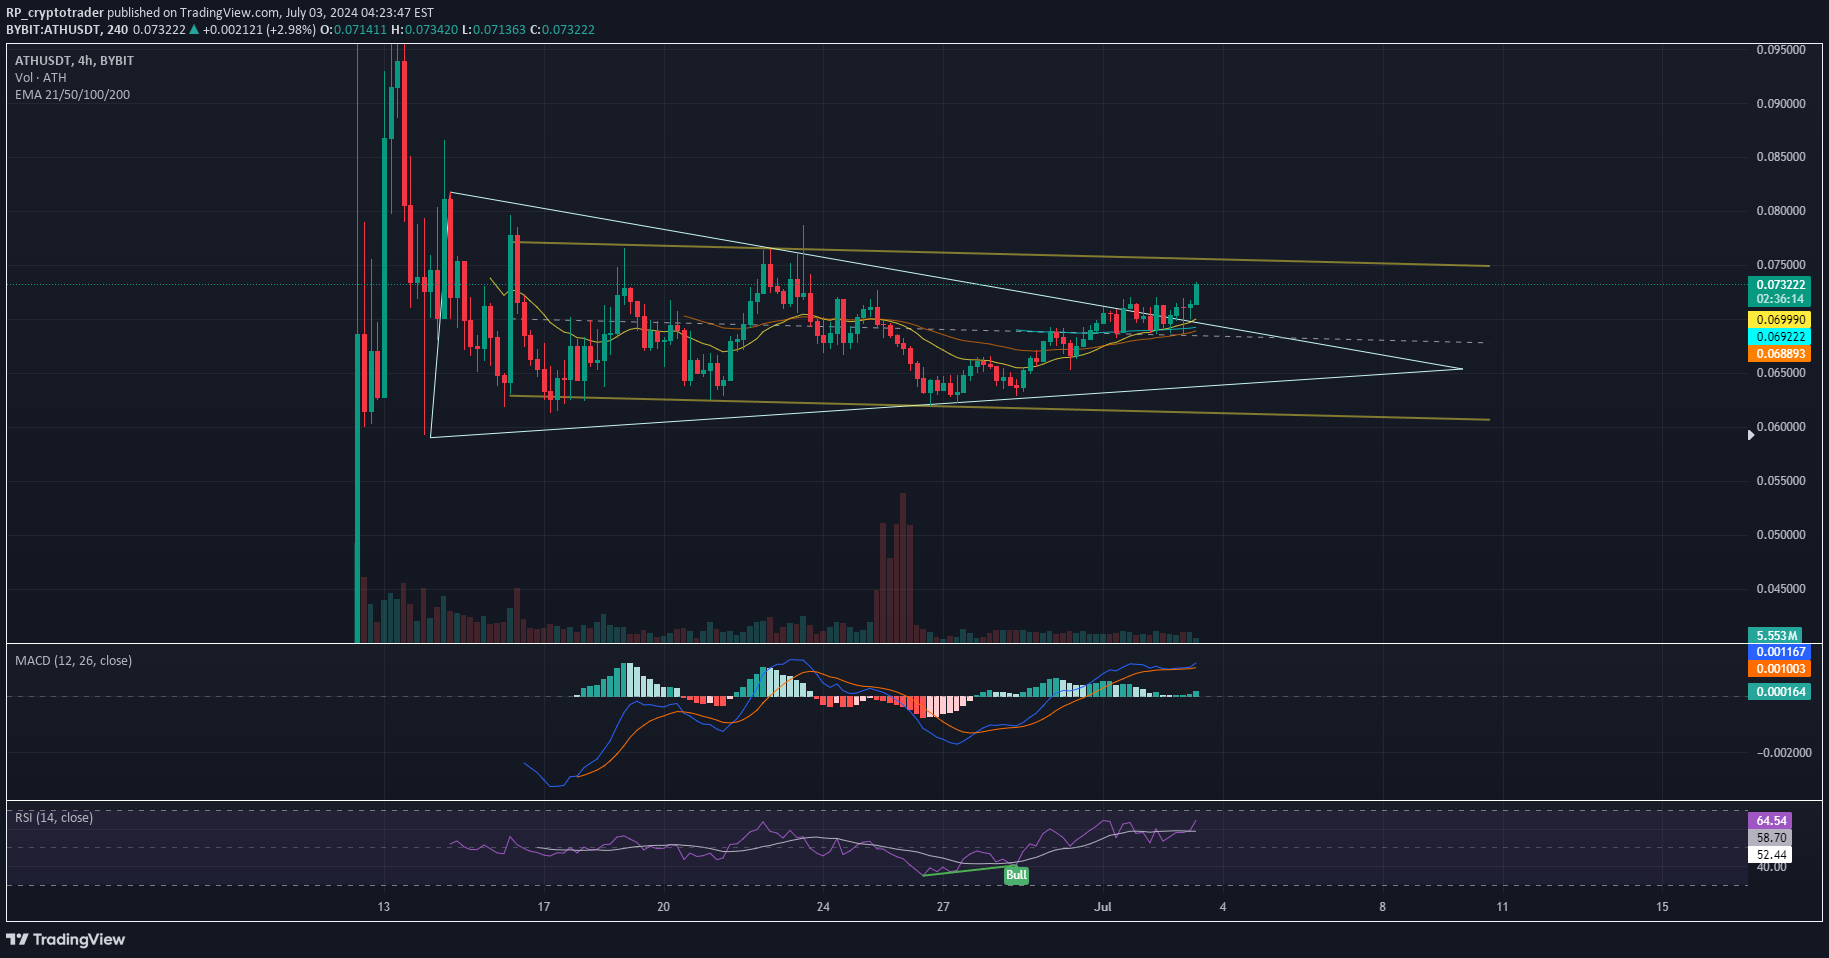
ATH is one of my favo coins. With a real usecase and great potential in the AI narrative and a huge community its building up momentum. The former EQ i drew has been broken on the upside. But due to lack of volume i also drew a PC in yellow. This is less bullisch but still ATH is outperforming BTC for now. This coin could easy outperform RNDR for example. So I did set some alerts and try to buy the bottom. The Aether ( ATH ) coin has a promising upside potential based on various predictions. Analysts forecast that the price of Aether could see significant growth over the next few years. Short-term Prediction: Over the next 30 days, Aether is expected to increase by approximately 51.36%, potentially reaching $0.105226 by late June 2024 (CoinCodex). Medium-term Outlook: By 2025, Aether could trade within a range of $0.06952 to $0.343487, representing a potential increase of up to 370.31% from its current value (CoinCodex). Long-term Forecast: By 2030, Aether could reach as high as $0.52, with further growth expected in subsequent years. By 2033, it is predicted to hit $1.34 to $1.59 These predictions suggest substantial upside potential for Aether ATH, driven by positive market sentiment and anticipated growth in its use case and adoption. #NOFINANCIALADVISE
RP_cryptotrader
I rest my case
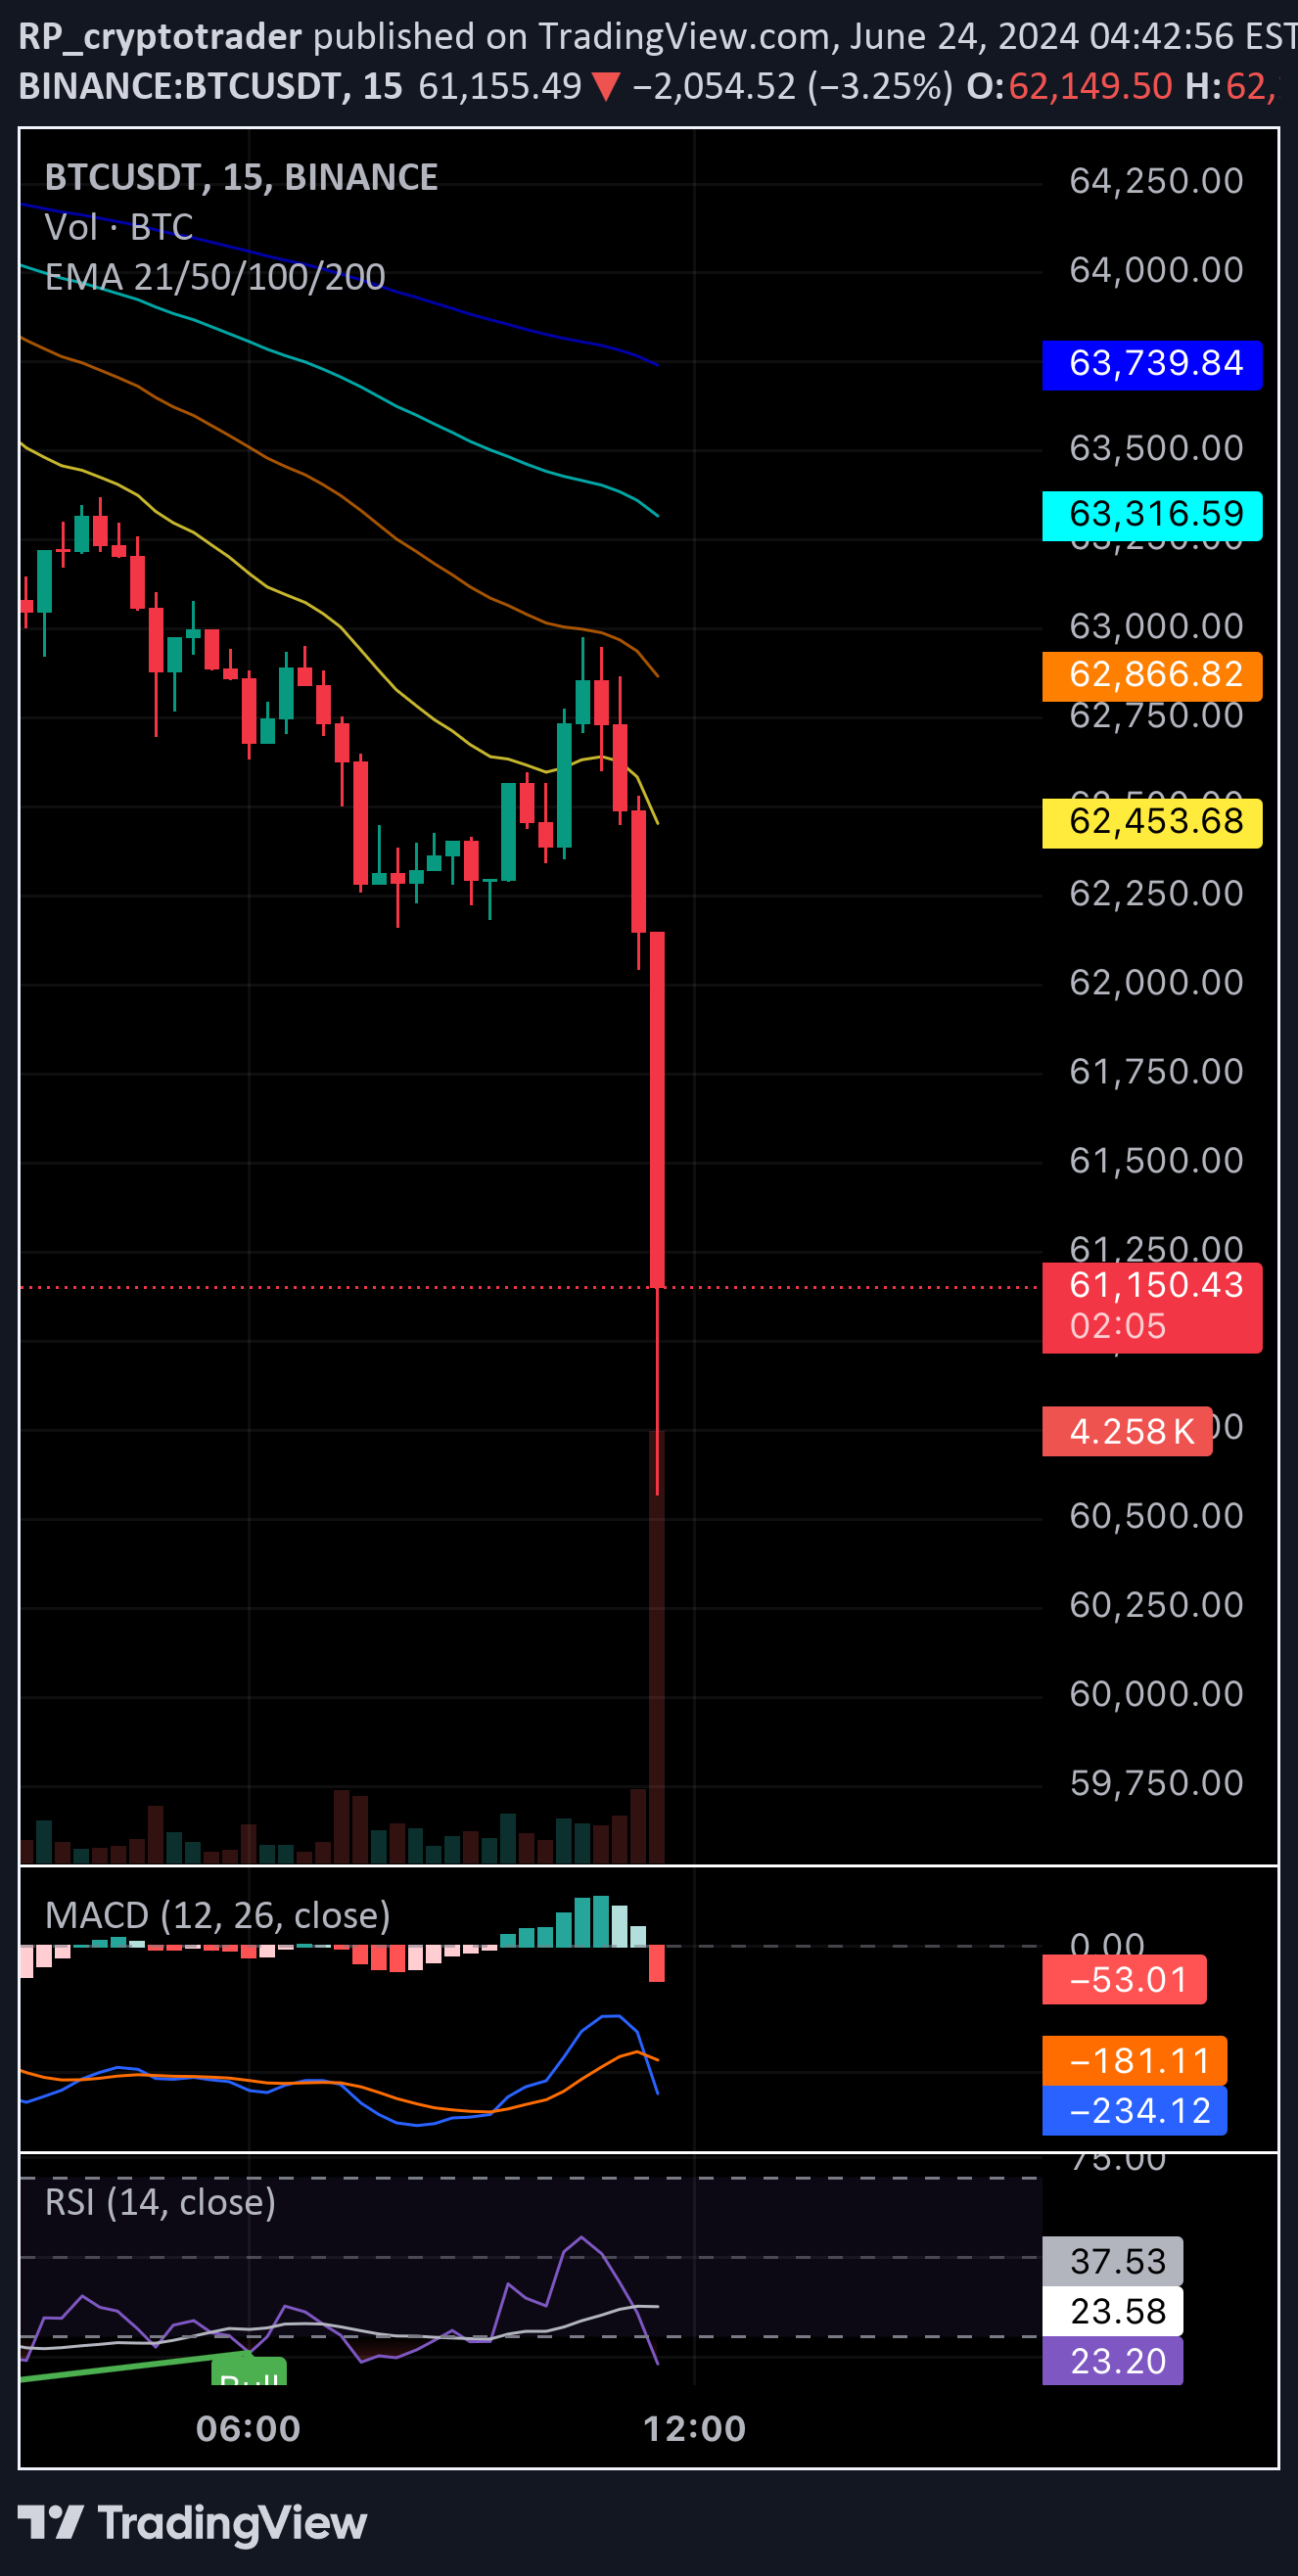
Nothing to ad…. There we go almost 60k zone liquidations. O.I. will spike from here on. Now a short squeeze and then looking for continuation patterns
Disclaimer
Any content and materials included in Sahmeto's website and official communication channels are a compilation of personal opinions and analyses and are not binding. They do not constitute any recommendation for buying, selling, entering or exiting the stock market and cryptocurrency market. Also, all news and analyses included in the website and channels are merely republished information from official and unofficial domestic and foreign sources, and it is obvious that users of the said content are responsible for following up and ensuring the authenticity and accuracy of the materials. Therefore, while disclaiming responsibility, it is declared that the responsibility for any decision-making, action, and potential profit and loss in the capital market and cryptocurrency market lies with the trader.