
QuantumTraderPro
@t_QuantumTraderPro

What symbols does the trader recommend buying?
Purchase History
پیام های تریدر
Filter
تحلیل بیت کوین 4 ساعته: آیا ریزش جدید در راه است؟ (سطوح حمایت و مقاومت کلیدی)

- Take note of the Support and Resistance Zones outside the Fair Value Gaps (which serves as price magnets) - When reaching the Support Area, the Liquidity Zone that were obsorbed could fuel a sharp bounce up towards the Fair Value Gap above before heading to the Resistance Area. - I think the Resistance Area will be strong enough to form a lower high in the 4H timeframe and head back down creating a lower low.

- The second half of September has shown stronger red candles compared to the green candles in early September, indicating increased downward momentum. - Based on the descending channel pattern, the price appears to be approximately halfway through its downward movement. - The price is likely to clear the liquidity zones in Zone 1 and Zone 2 before advancing toward an order block. - My target is where the lower border of the descending price channel converges with the price zone of the order block.
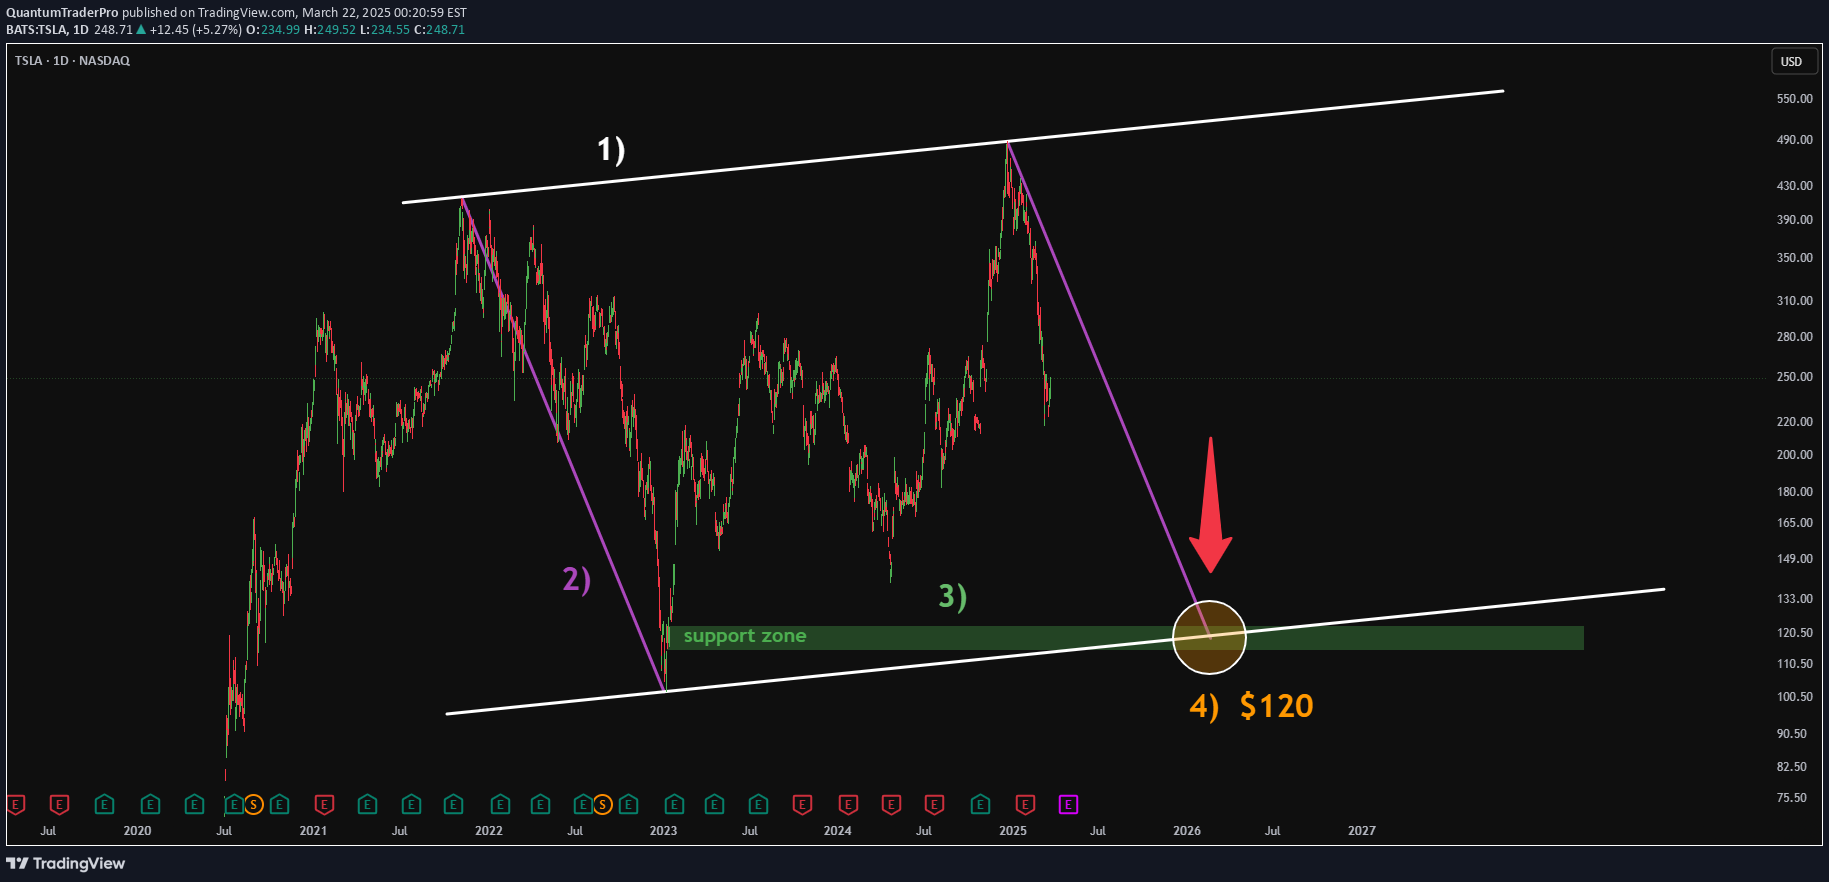
1) The price channel (white) reveals that we’re only halfway to the next major bounce on the daily chart. With boycotts gaining traction and sales projections looking bleak, the stage is set for more downward pressure. 2) Looking back at the last significant downward swing ( purple ) within this channel, history could repeat itself with a drop of similar magnitude. The pattern is hard to ignore. 3) A critical support zone ( green ) lies beneath an unresolved price imbalance, still waiting to be tested. It’s like a magnet pulling the price lower. 4) When you weave these factors together—channel dynamics, past swings, and untouched support—they converge ominously around the $120 mark. Coincidence? I think not... Let me know what you guys think.

Hey traders,- As you can see, the price recovery from March 11 to March 18 ( blue line ) has experienced a challenging rally, taking significantly longer than expected and still failing to fully recoup the losses from the price drop between March 9 and 11 ( purple line ). - During this period, there were minor rallies, but the bears consistently clawed back most of the gains. - Once the price breaks out of this triangle formation (white), I believe there's a strong likelihood that the bears will grow even more confident.

Interesting Bitcoin price is forming a fractal pattern.As above so below?Let me know what you guys think and comment below.
Disclaimer
Any content and materials included in Sahmeto's website and official communication channels are a compilation of personal opinions and analyses and are not binding. They do not constitute any recommendation for buying, selling, entering or exiting the stock market and cryptocurrency market. Also, all news and analyses included in the website and channels are merely republished information from official and unofficial domestic and foreign sources, and it is obvious that users of the said content are responsible for following up and ensuring the authenticity and accuracy of the materials. Therefore, while disclaiming responsibility, it is declared that the responsibility for any decision-making, action, and potential profit and loss in the capital market and cryptocurrency market lies with the trader.