
PurpleCrypto
@t_PurpleCrypto

What symbols does the trader recommend buying?
Purchase History
پیام های تریدر
Filter
Signal Type
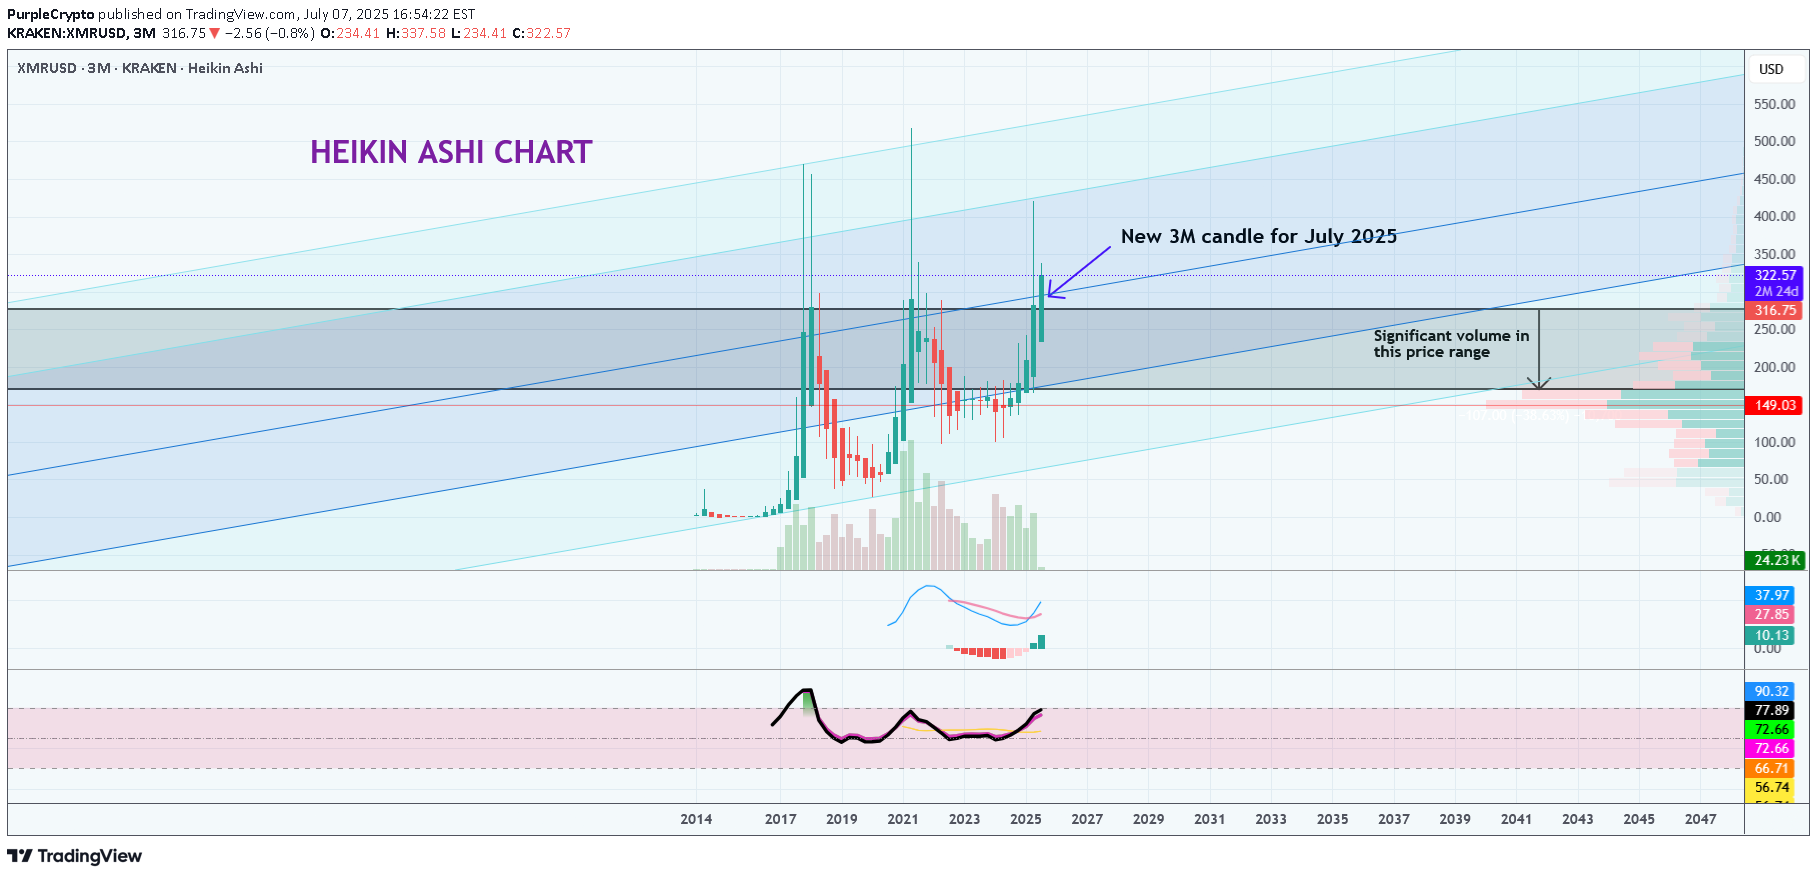
We have here a trend outlook chart for Monero on a 3 monthly timeframe (Heikin Ashi candlestick chart). XMR is one of a handful of high market cap coins which have showed signs of strength on a variety of indicators (despite high volatility with various other high market cap coins), including the positive MACD and RSI indicators as shown in this chart.In addition, there has been significant buy volume in the 170 - 277 price range, as can be seen in the Price-Volume indicator to the right of the chart, keeping the price up.Monero has withstood the political and economic turmoil in recent months making it a strong contender against some of the largest market cap coins. With the current price sitting at approximately USD$315, there is potential for further upside in the long-term._____________This publication and the information contained in it are for educational purposes only, and is not meant to be nor does it constitute financial, investment, trading or other types of advice or recommendations.
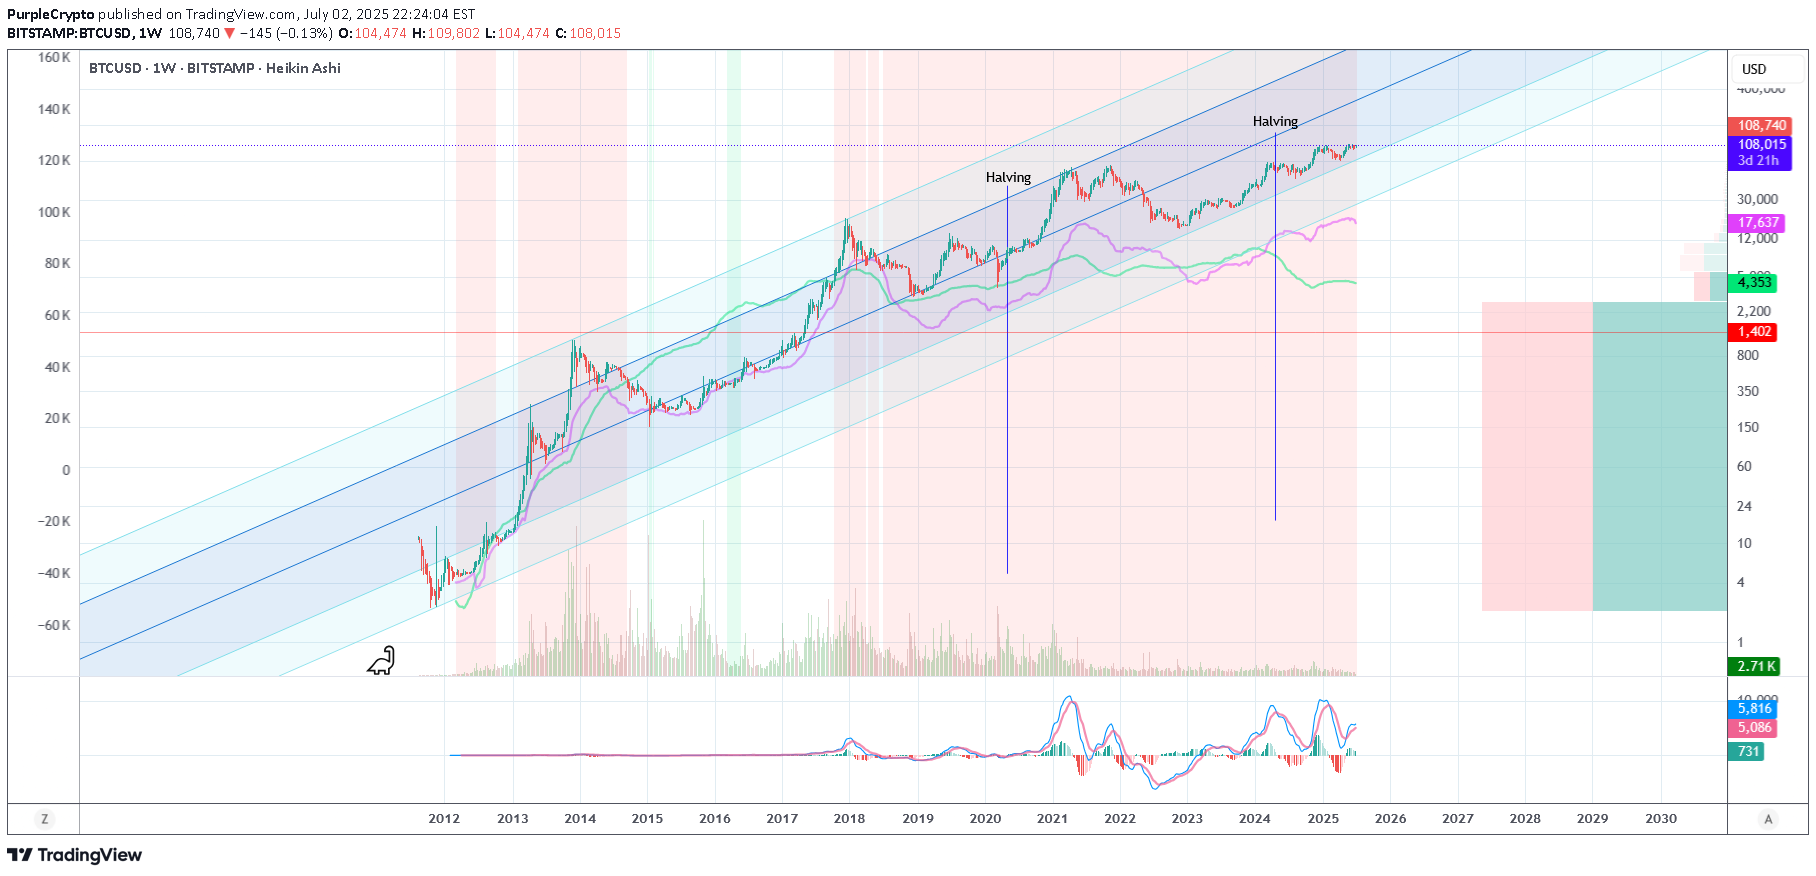
Hello TV Community,I am back with this and more insightful charts coming soon.This chart was first published back in 2020 (linked below) and this is an update to BTC's trajectory over the past few years.This chart demonstrates that BTC's price action has been steadily following the mid 50% of my "right" channel (see idea linked below to understand what I mean by "right channel"). The last time BTC's price broke out of the mid 50% range was back in December 2017's high.The most up to date volume profile indicates that the majority of the trading volume was pre-2017. The MACD indicator is a great example of BTC's highly volatillity since the Dec 2017 high.If BTC's price breaks into the bottom 25% of the channel, I would expect a touch of the lower end of this channel. If the price bounces off the lower end of the mid 50% of this channel, we can expect higher highs in the not too distant future.'Til next time.__________________________________I let my charts do the talkin'.
Disclaimer
Any content and materials included in Sahmeto's website and official communication channels are a compilation of personal opinions and analyses and are not binding. They do not constitute any recommendation for buying, selling, entering or exiting the stock market and cryptocurrency market. Also, all news and analyses included in the website and channels are merely republished information from official and unofficial domestic and foreign sources, and it is obvious that users of the said content are responsible for following up and ensuring the authenticity and accuracy of the materials. Therefore, while disclaiming responsibility, it is declared that the responsibility for any decision-making, action, and potential profit and loss in the capital market and cryptocurrency market lies with the trader.