
ProR35
@t_ProR35

What symbols does the trader recommend buying?
Purchase History
پیام های تریدر
Filter
ProR35
29/12/25 Weekly Outlook

Last weeks high: $90,597.02 Last weeks low: $86,423.04 Midpoint: $88,510.03 As 2025 draws to a close, BTC is currently -6% from yearly open ($93,300). Can the yearly candle be flipped green? Last weeks price action was very much more of the same as the previous few weeks. Clearly defined range with overlapping candles from start to end. That has been the story for the entirety of December and I expect the same for this week also. The struggle is still liquidity based and until that changes this chart pattern will persist. At this stage in the year a lot of Banks and Institutions are window dressing for the end of the year so this is just a waiting game until the new year now in my opinion. Broadly speaking altcoins are the same, BTC.D is relatively flat so the across the entire crypto market the trend is flat with a few outliers. For me the bullish target should be to flip the yearly open $93,300 with acceptance. For the bears a breakdown below $84,000 opens the door to a further drawdown into the $74,500 level.
ProR35
22/12/25 Weekly Outlook
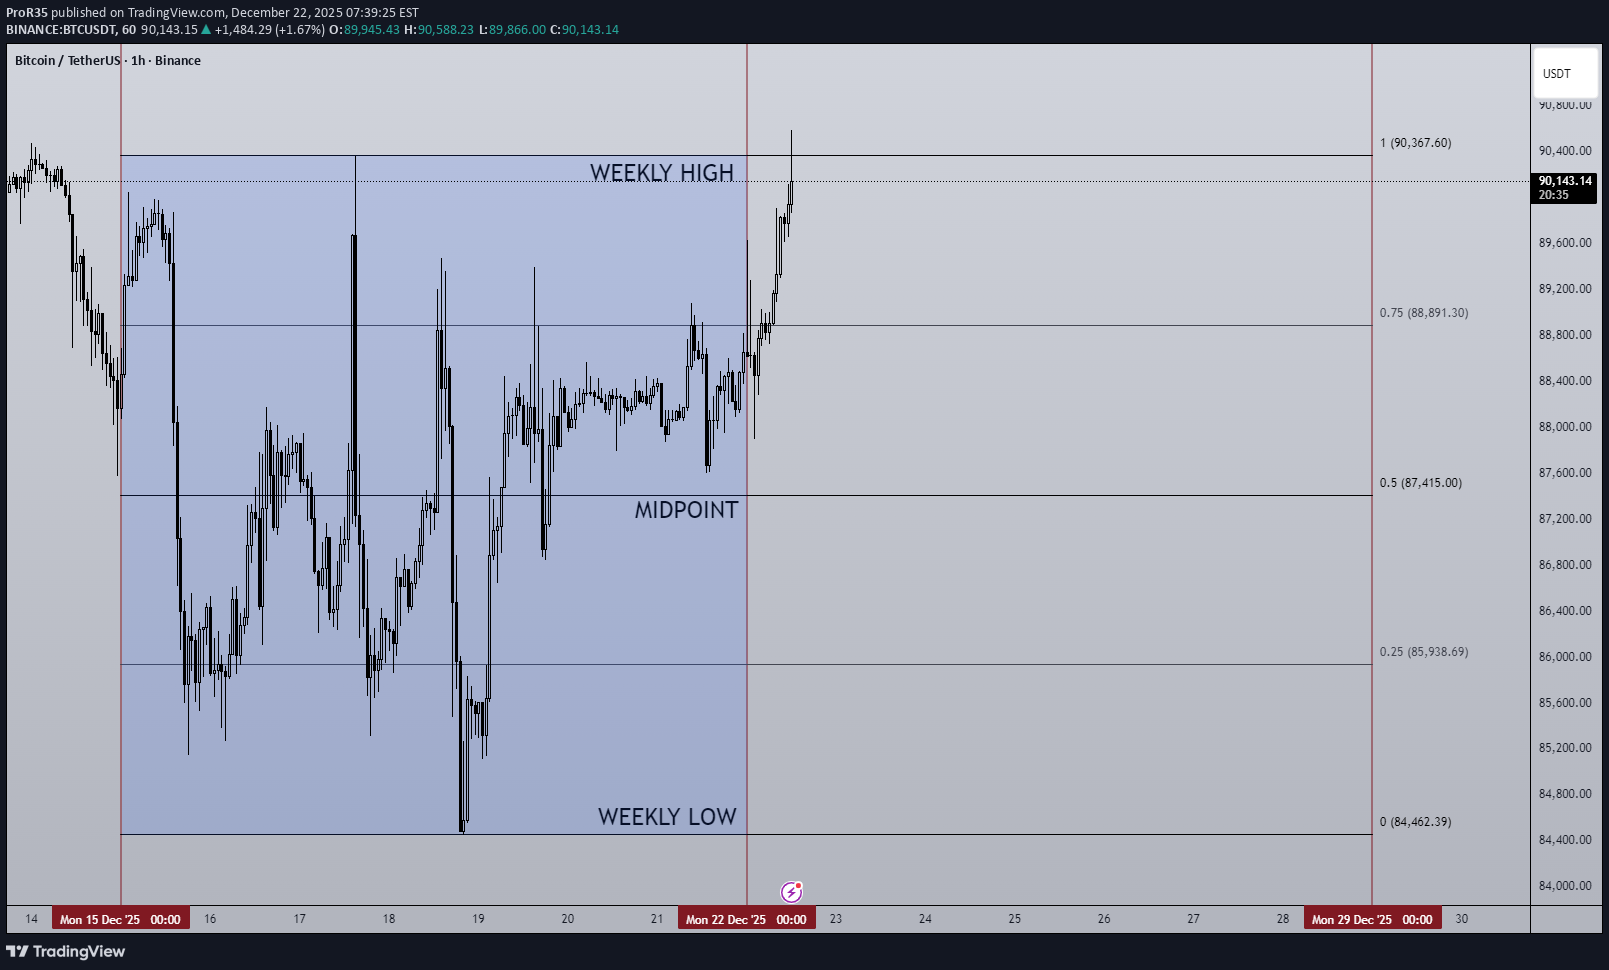
Last weeks high: $90,367.60 Last weeks low: $84,462.39 Midpoint: $87,415.00 Last week volatility was high but a directional trend still absent. Clear rejection around 0.75 line ($89,000) and support at 0.25 ($86,000) keeping price choppy but contained. A thin orderbook due to lower liquidity can often produce these violent moves and I expect this to continue into the new year. As Christmas is just around the corner we have a disrupted week ahead with many public holidays. Going off of last weeks price action I would continue to play the range until proven otherwise. That would be a breakout above the weekly high with acceptance for the bulls, targeting $94,000 resistance level . The same goes for the bears, should price breakdown below weekly low and accept under, then continuation lower looks probably with $74,500 being the target for me.
ProR35
15/12/25 Weekly Outlook
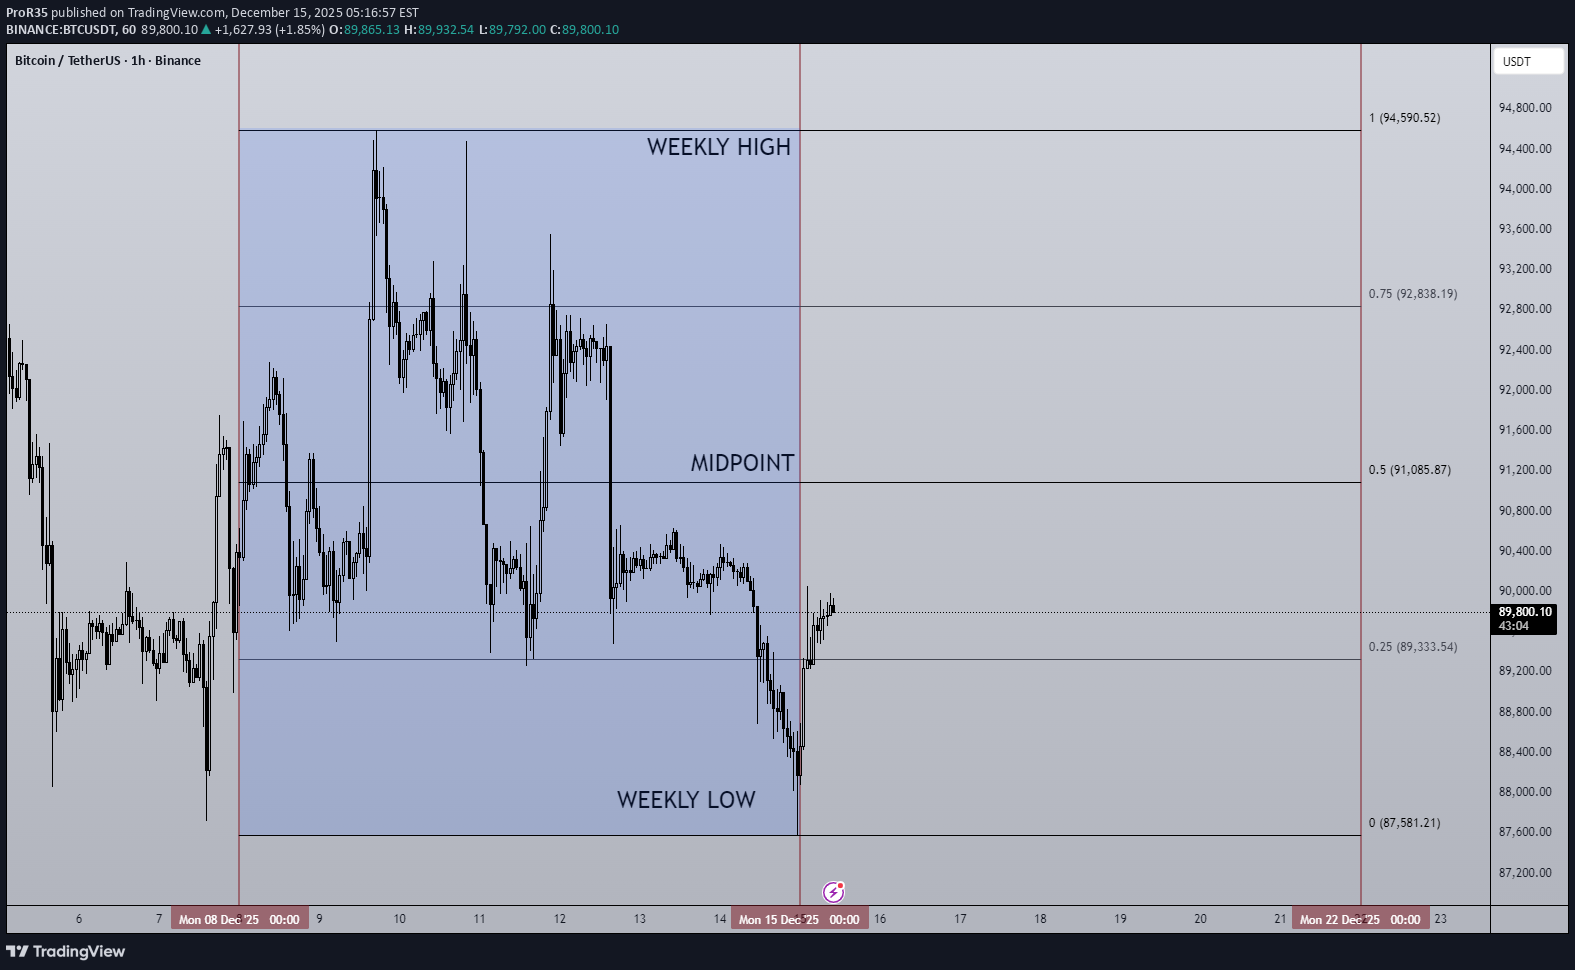
Last weeks high: $94,590.52 Last weeks low: $87,581.21 Midpoint: $91,085.87 A volatile yet directionless FOMC week comes to a close and a new week begins. As forecast the Fed cuts interest rates by 25bps, now at 3.75% (a 3-year low). Bitcoin reacted to the news with LTF volatility but in the end no direction as this cut had been forecast and priced in. The weekly clearly capping any bullish move, multiple rejections from $94,500 with higher lows compressing price. Historically this compression pattern leads to an impulse move in a given direction. given what we have seen around the weekly high, if price cannot flip this level ($94,500) a continuation of the downtrend may be next as the bears are looking stronger as it stands. My key levels to look for are $84,000, $80,000 and $74,000. Should the weekly high be flipped and reclaimed $100,000 is the major test of resistance. I am not sure if this week is too early to get our answer but I am planning for what the chart tells me. Until we get a confirmation on HTF direction the range is clear on the LTF.
ProR35
08/12/25 Weekly Outlook
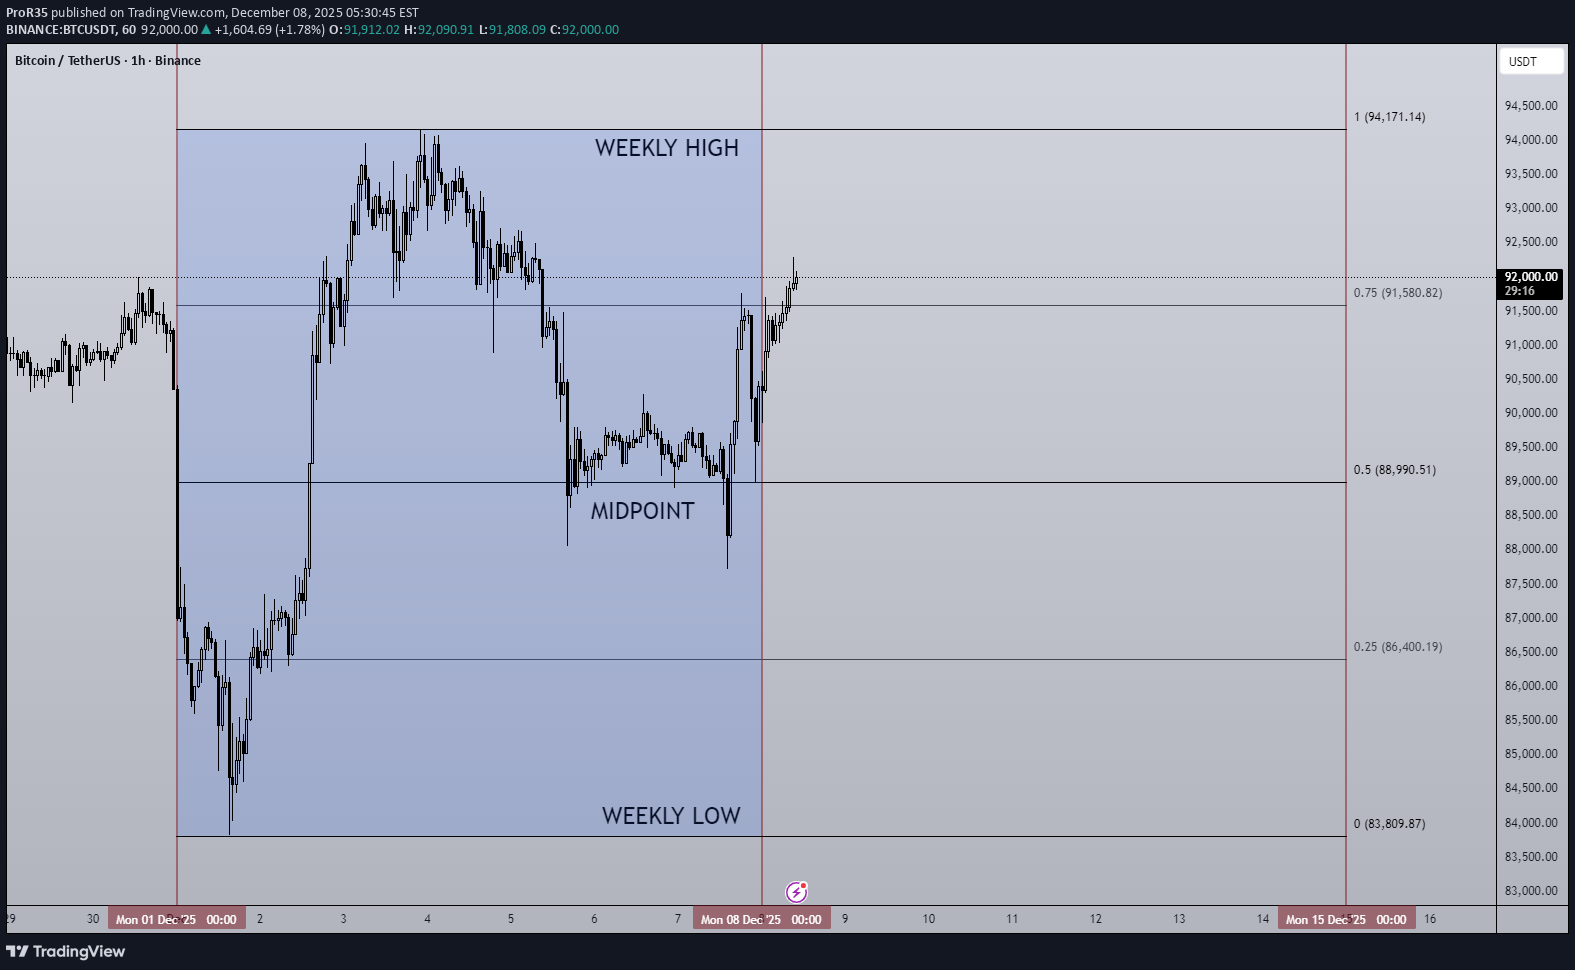
Last weeks high: $94,171.14 Last weeks low: $83,809.87 Midpoint: $88,990.51 Bitcoin performs a double Swing Fail Pattern (SFP) as price sweeps both extremities of the range before closing out near the midpoint. After such a dramatic drawdown during Q4 so far, the possibility of a V-shape reversal as the year comes to a close was never going to be a high probability. With that we have seen a steady base being built and a higher low printed, certainly a more bullish structure than last weeks opening. This week we have FOMC on Wednesday: Previous: 4.0% Forecast: 3.75% (-25bps) Actual: ?% A 25bps cut is forecast with an 87% chance. Could this finally reignite some buyside volume? The timing of year end doesn't help, I think volume stays relatively subdued until 2026 where the Fed ending QT & lowering rates help risk-on assets. For now I will maintain that a $80,000-$100,000 range is where Bitcoin stays for some time, thin orderbooks creating short term volatility but not necessarily strong moves in either direction.
ProR35
تحلیل هفتگی بیت کوین: آیا کف جدید در راه است؟ (پیشبینی بازار ۰۱/۱۲/۲۵)
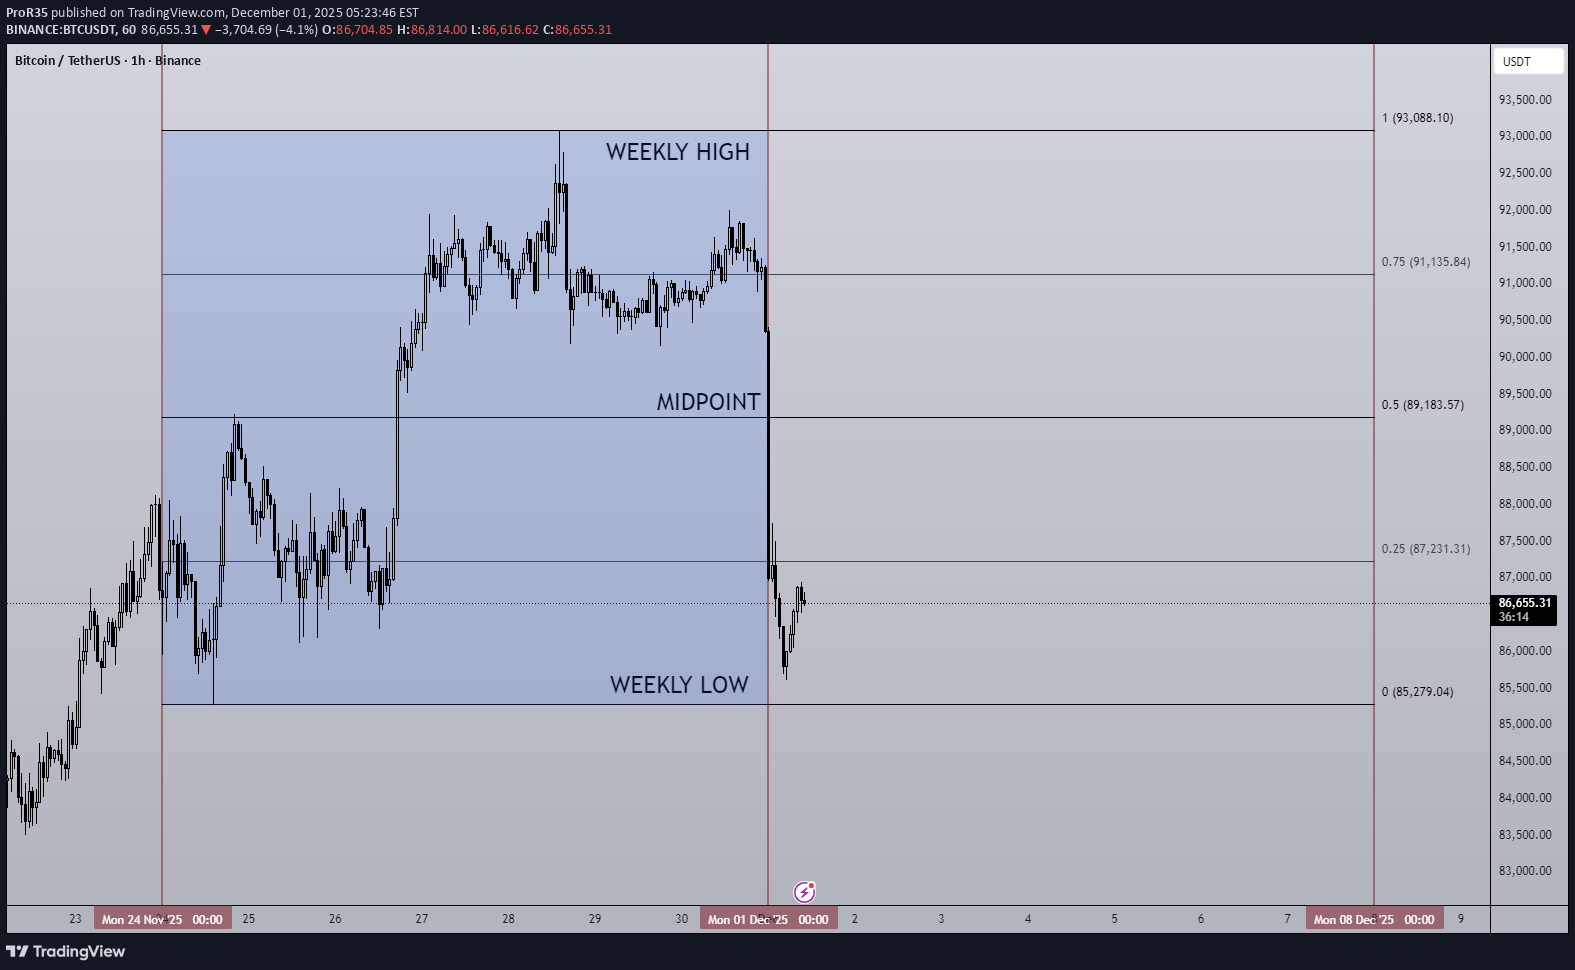
Last weeks high: $93,088.10 Last weeks low: $85,279.04 Midpoint: $89,183.57 A brutal start to the week for the bulls here. A -6% move to the downside as soon as the Month of December opens rejecting off the range weekly high. Across the high time frame this confirms a new lower high and a failure to get back within the trend that has stayed consistent throughout this bull market. All of last weeks recovery bounce has been wiped out in a matter of hours, so now the question is where does the buy side pick up, if at all? FOMC interest rate decision is predicting another rate cut (80% probability) as well as the end of quantitative tightening and the beginning of quantitative easing on paper should bring more liquidity into risk-on markets such as Bitcoin, but that is on a longer timescale. In the more immediate time frame I think the range broadly $80,000-$100,000 with this weeks range seeing a lot of the noisy PA. Midpoint is a key S/R level to gauge sentiment and conviction, a reclaim of the level may open the door to a stop loss hunt around weekly high but for now the momentum is definitely with the bears.
ProR35
تحلیل هفتگی بیت کوین: آیا کف بازار رسیدیم یا منتظر سقوط بیشتر باشیم؟
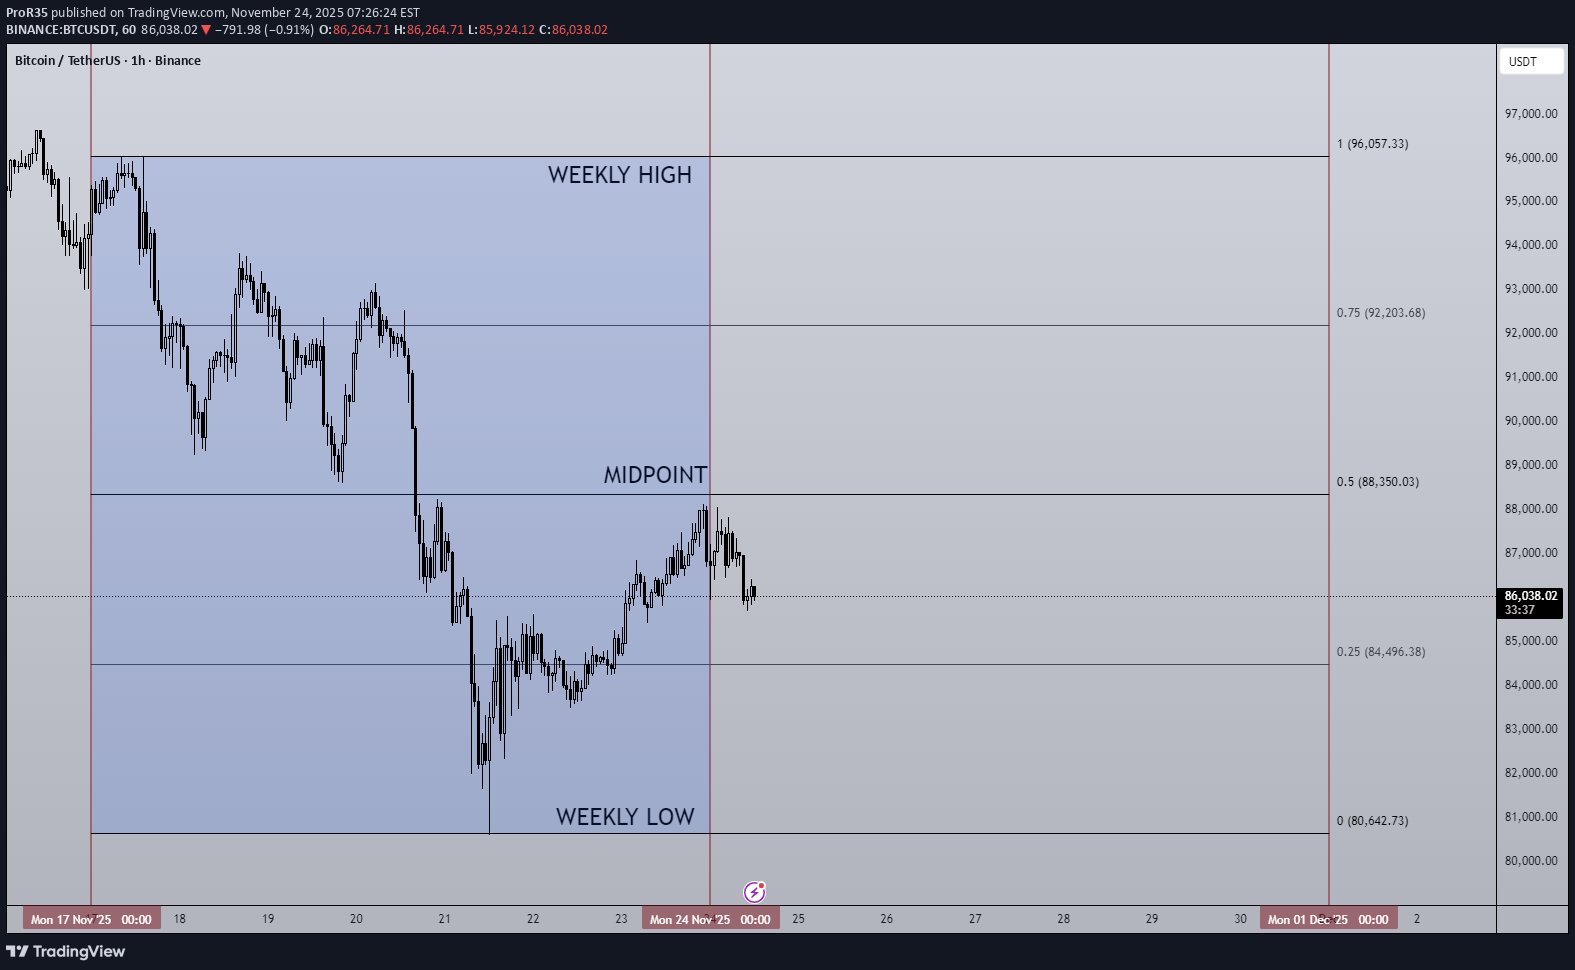
Last weeks high: $96,057.33 Last weeks low: $93,034.53 Midpoint: $80,642.73 Has Bitcoin found its low, or is there more downside to come? After yet another brutal week of downtrend BTC tags $80,000 before bouncing back towards the weekly range midpoint at $88,000, a +10% bounce. It's important to note that back in April during the Tariff War sell-off, the $80,000 area was the origin of the subsequent move up to $110,000. So historically this area should provide support when retested as it has initially. What this does mean to me, the high time frame trend has shifted from bullish with areas of choppy rangebound consolidation before the next leg up, to now a new lower high ($108,000 rejection) which confirmed the 1d 200 EMA as resistance, and much lower low ($80,000 last weeks low) which confirms a bearish flip. For me this week it's about finding out if the bottom is already in or if not, where will it be? In terms of bullish target should the bottom already be in, it's the $98,000-$100,000 area. This key s/r level has been an important battleground since December '24, it's a big even level too so psychologically important, and the origin of this 20% sell-off. Fear & Greed Index currently sits at 19 but hit as low as 11 over the weekend, the lowest so far this bull run. These factors have me leaning towards the local bottom is in. However, if the bottom is not in then $74,000 comes into play, the Tariff war low. That would complete a full retrace of this years move up to $126,000 (-40% from high). The current weekly low sits at -36% move which is the largest of the bull run so far but not uncommon in previous cycles. Good luck this week everybody!
ProR35
پیشبینی هفتگی بیتکوین: آیا روند نزولی ادامه دارد؟ (تحلیل قیمت و سطوح کلیدی)
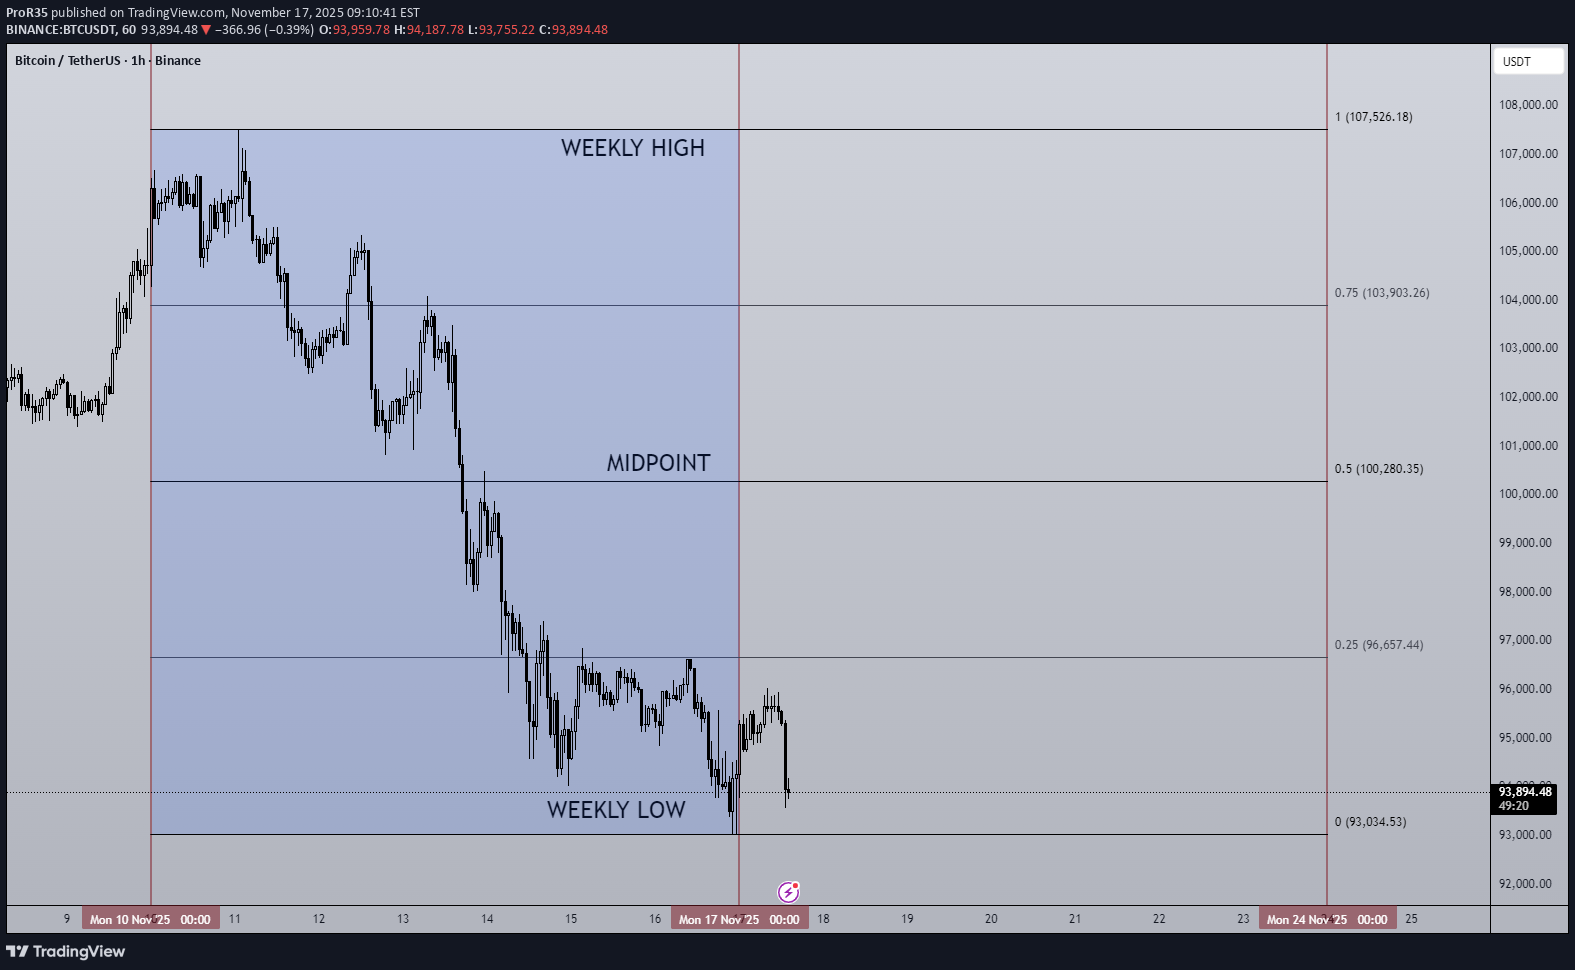
Last weeks high: $107,526.18 Last weeks low: $93,034.53 Midpoint: $100,280.35 Bitcoins downtrend continues as price reaches a 6-month low of $93,000. This price action came as a result of a failed attempt to flip the $107,000-$108,000 level, as this area rejected the bears gained momentum sending BTC sub $100k big even level and the most worrying part of all for the bulls losing the $97,000-$98,000 level. On the Higher timeframes this new lower low sets up for a trend shift. Should any reaction from the bulls fail to flip the weekly high and rollover, I would then have confirmation of a bearish trend and trade accordingly. Despite the US Government shut down coming to an end, it appears this has not been enough to get the market in a risk-on mood, at least not yet. This compounded with Nvidia earnings in midweek and the larger question mark about the AI industry as a whole has meant buyers are just not will to step in yet. My opinion is that IF Bitcoin trades into the $89,000-$92,000 area that is where support may be found, that's because we have an area of imbalance that broke the previous downtrend in April earlier this year during the tariff war. This week I expect Wednesday 19th November to be a day of volatility, and some formation of a local bottom in Bitcoin, at least in the short term. Good luck this week everybody!
ProR35
تحلیل هفتگی بیت کوین: آیا صعود ادامه مییابد یا سقوط به ۹۲ هزار دلار؟
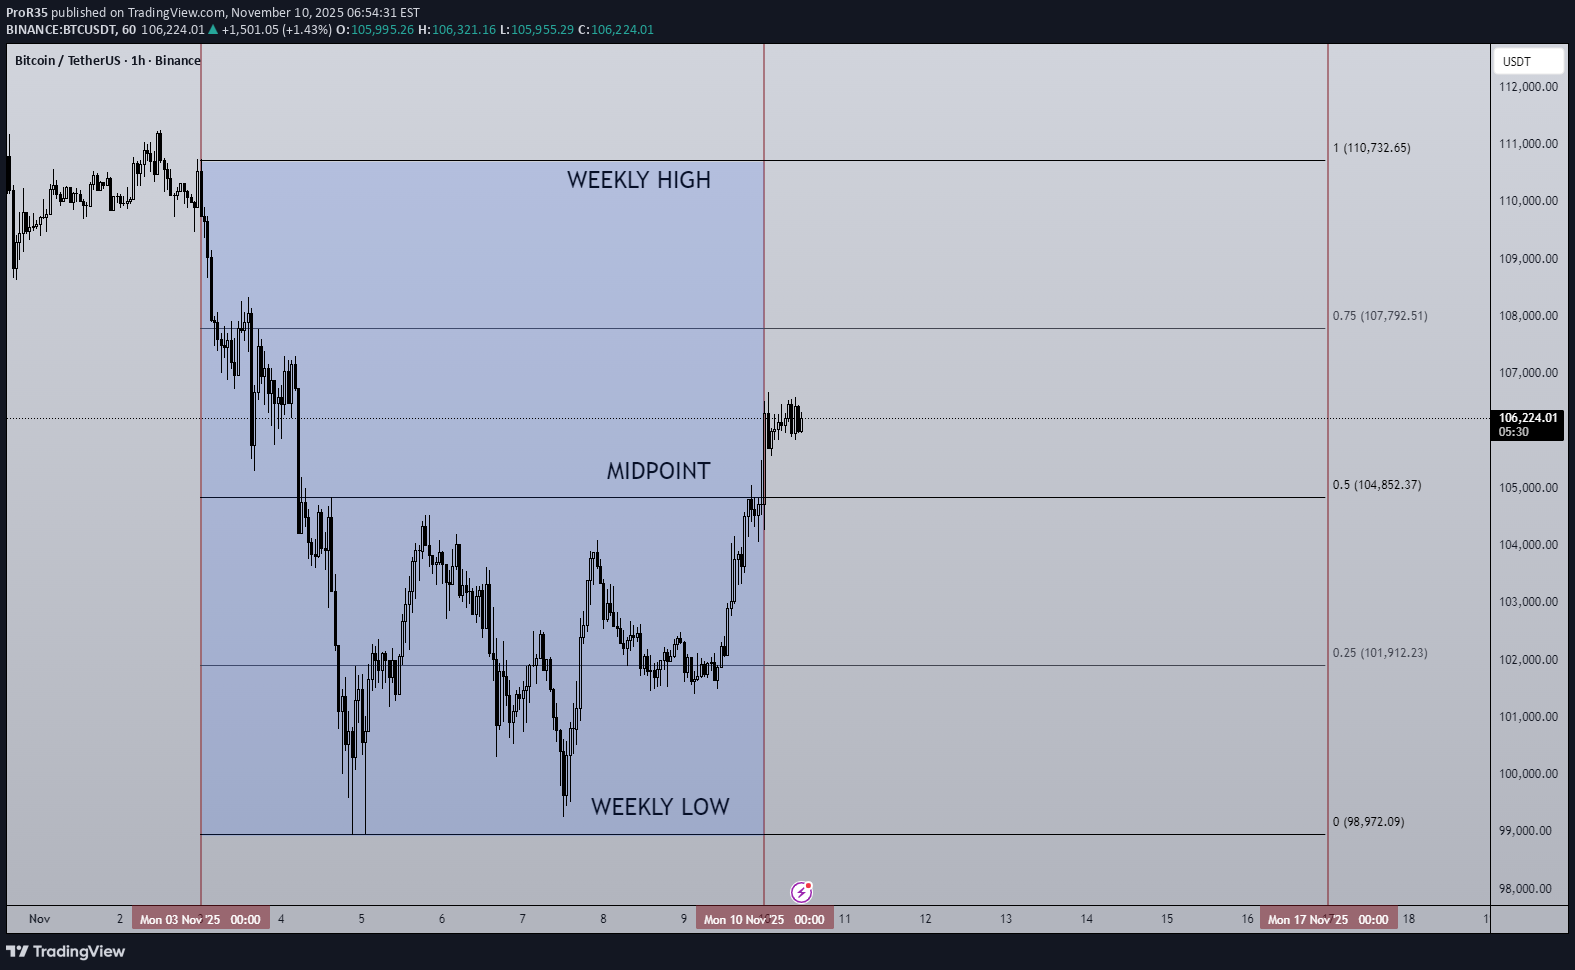
Last weeks high: $110,732.65 Last weeks low: $98,972.09 Midpoint: $104,852.37 Bitcoins price action of last week tells an interesting story. The first trading hour of the week marked the weekly high, a sharp decline towards HTF support at $99,000 marked the weekly bottom, to finish the week a late surge recovered some of the losses to end the week at the range midpoint. The double bottom at range low is a good sign for the bulls in a must win contested area around the $100,000 mark, not only is it a big even level but a HTF key S/R level too. Should the bulls lose this weekly low it opens the door to a $92,000 retest. For the bulls should this rebound persist a flip of $108,000 is key but there is certainly a lack of spark in the markets at the moment. I don't see the bulls making any significant ground until the US Government shutdown is announced to be coming to an end. This announcement could happen at any time and so this week that's what I am making plans for, how will the market react, volatility on announcement etc... Good luck this week everybody!
ProR35
اتریوم در آستانه سقوط؟ تحلیل سطح حیاتی و سناریوهای صعودی و نزولی پیش رو
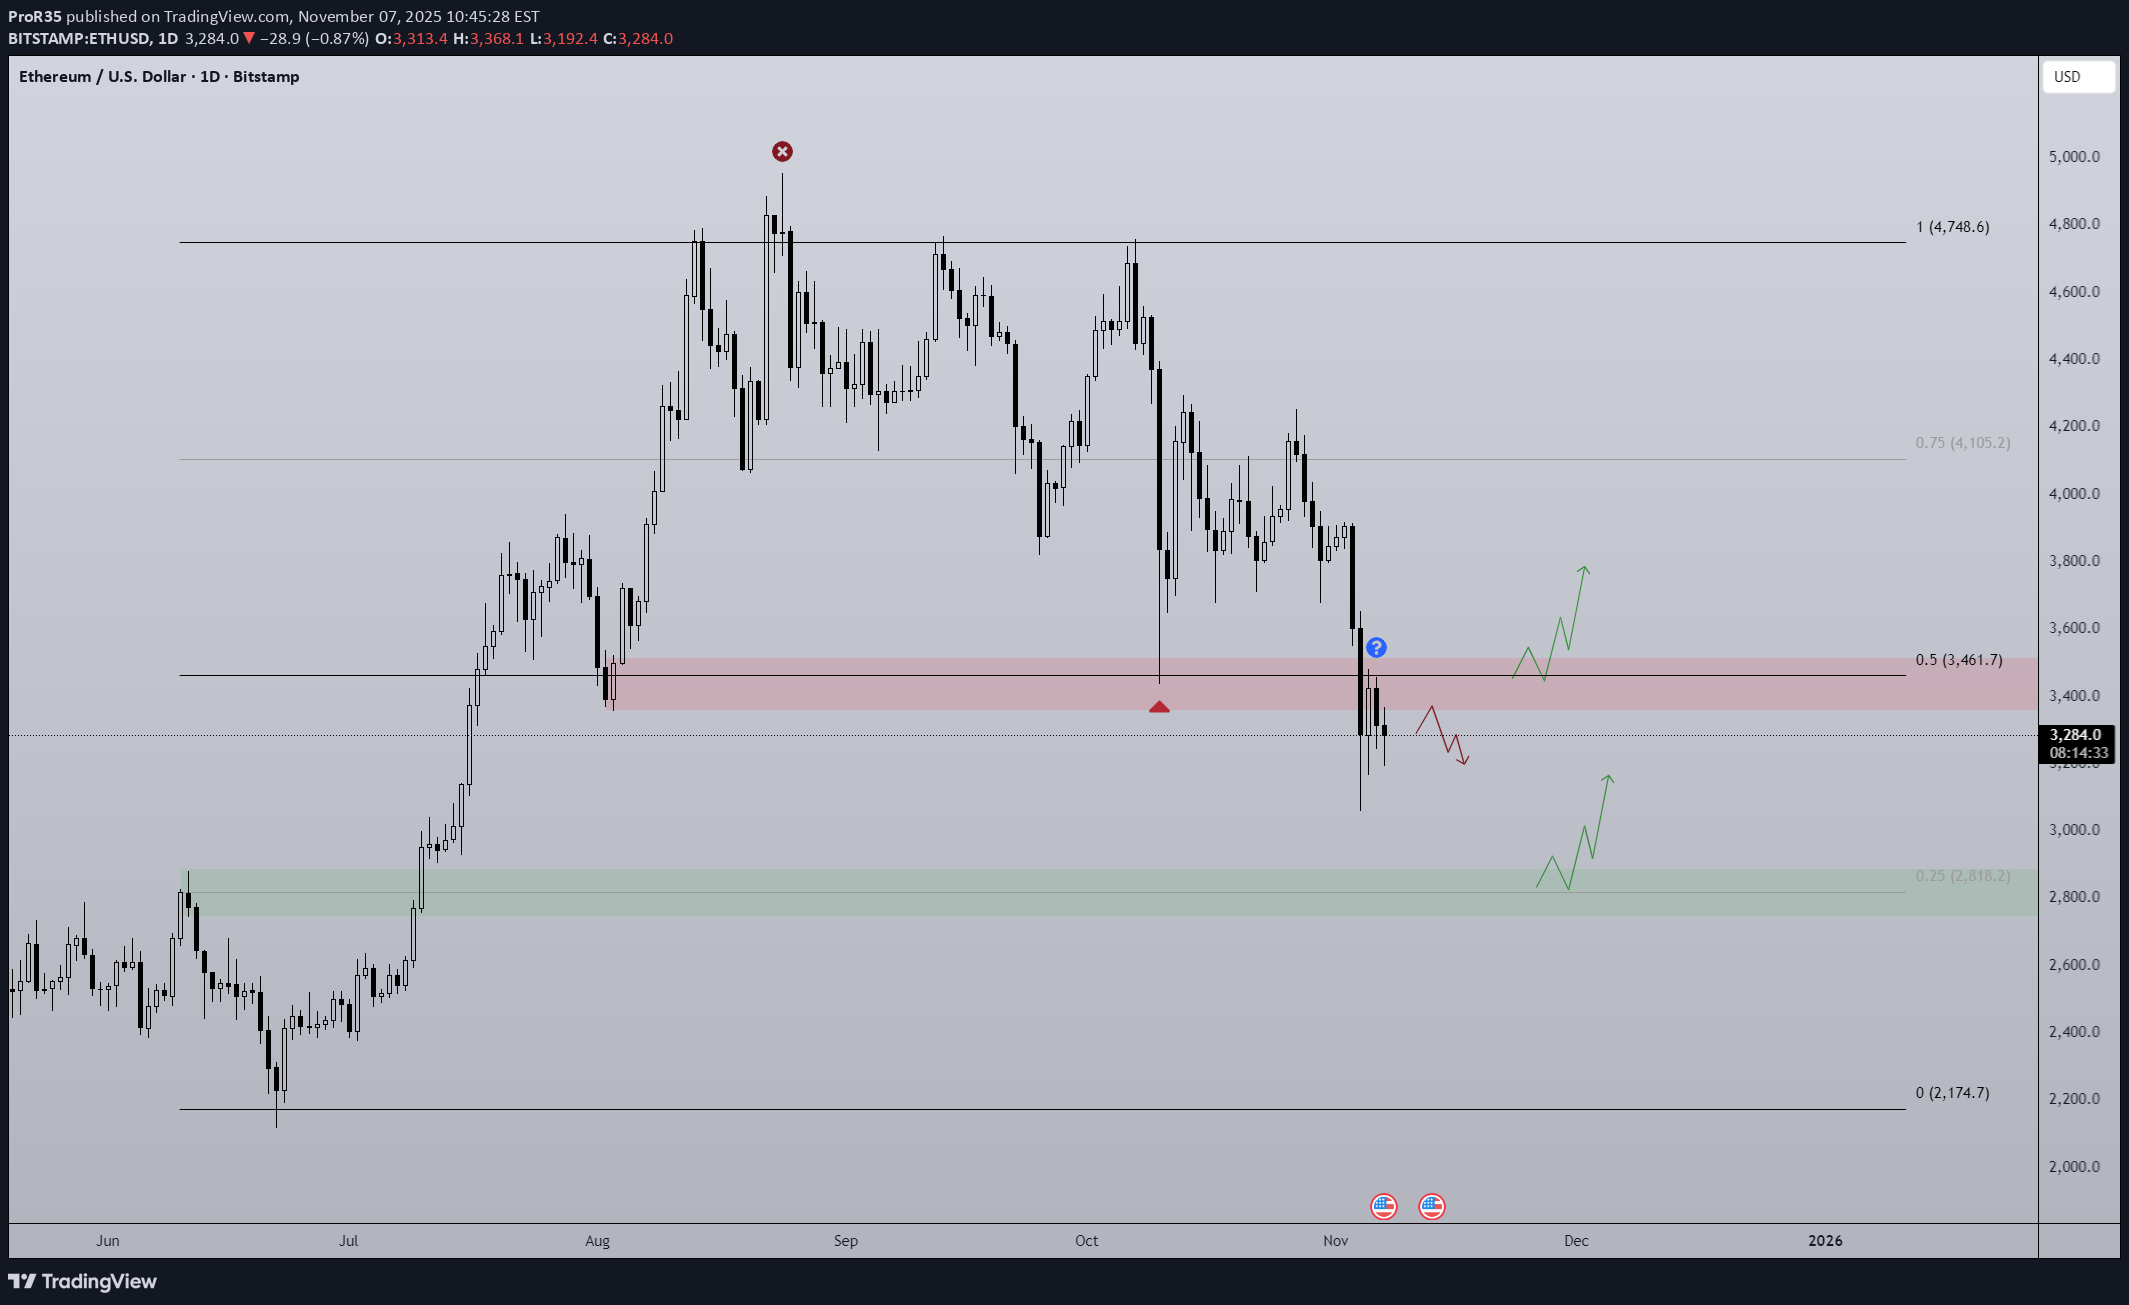
Similarly to Bitcoin, Ethereum finds itself around the midpoint of the high time frame range, only ETH has already lost the level and has rejected when retesting. Such a lack of strength is concerning for the project as well as the broader altcoin market. So there are a few actionable moves I'm looking out for: Bullish scenario is we maybe chop for a while around/under the midpoint then with high volume the midpoint gets flipped with conviction. That would open the door for the top half of the range to be accessible again. I think this scenario relies on the US Government shutdown coming to an end and QT also ending. Right now there just isn't the liquidity needed to prop up prices hence the slow bleed. Bearish scenario is a simple continuation of the local bearish trend where 0.25 ($2,800) is the target. This area signaled the break in structure responsible for the previous rally and so I believe it will provide support but is also the target for the bears to reach.
ProR35
پیشبینی هفتگی بیت کوین: آیا تب صعودی فروکش کرده است؟ (تحلیل سطح مقاومت و نقدینگی)
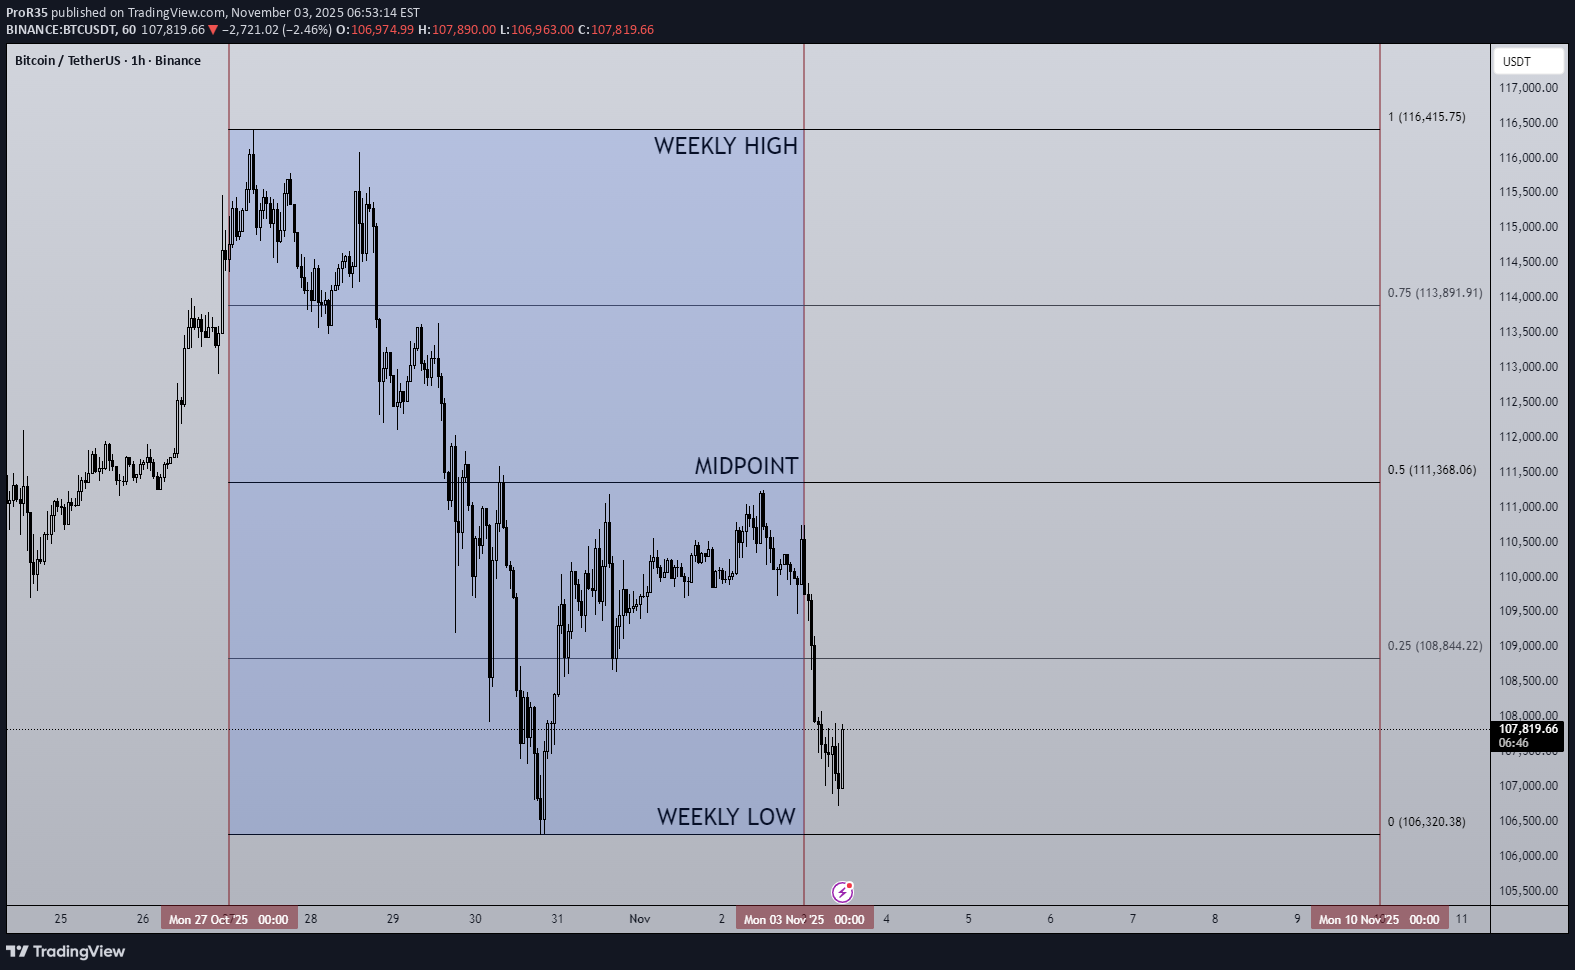
Last weeks high: $116,415.75 Last weeks low: $106,320.38 Midpoint: $111,368.06 This week will be the third week in a row where ~$116,000 is acting as weekly high and a major resistance level. Last weeks price action was clear, the bulls are incapable of flipping that level and making it new support. As a result the bulls retreated back towards strong support at weekly low ~106,000 completing the SFP. Also this pattern is a mirror image of the previous weekly outlooks price action. No clear trend bias at all here but what is obvious is bull market momentum is dying out. Bitcoin has always been hyper sensitive to liquidity, as always month end window dressing by the banks have a negative effect on liquidity, it usually takes a few days to get over this and resume normal levels again. The Government shutdown in the US does not help this as spending from the Treasury General Account has stopped with approximately $150Bn coming out of the market in October alone as a result. Should Bitcoin push higher it can only do so once Government operations resume IMO. FOMC resulted in a 25bps cut and QT (Quantitative tightening) is ending on 1st December, all bullish signs for the future but currently and for this week I think chop/ gradual drawdown continues. Good luck this week everybody!
Disclaimer
Any content and materials included in Sahmeto's website and official communication channels are a compilation of personal opinions and analyses and are not binding. They do not constitute any recommendation for buying, selling, entering or exiting the stock market and cryptocurrency market. Also, all news and analyses included in the website and channels are merely republished information from official and unofficial domestic and foreign sources, and it is obvious that users of the said content are responsible for following up and ensuring the authenticity and accuracy of the materials. Therefore, while disclaiming responsibility, it is declared that the responsibility for any decision-making, action, and potential profit and loss in the capital market and cryptocurrency market lies with the trader.