
Portfolio_Punt
@t_Portfolio_Punt

What symbols does the trader recommend buying?
Purchase History
پیام های تریدر
Filter
Portfolio_Punt
بیت کوین به سقف جدید میرسد؟ پیشبینی صعودی تا ۹۴ هزار دلار قبل از پایان هفته!
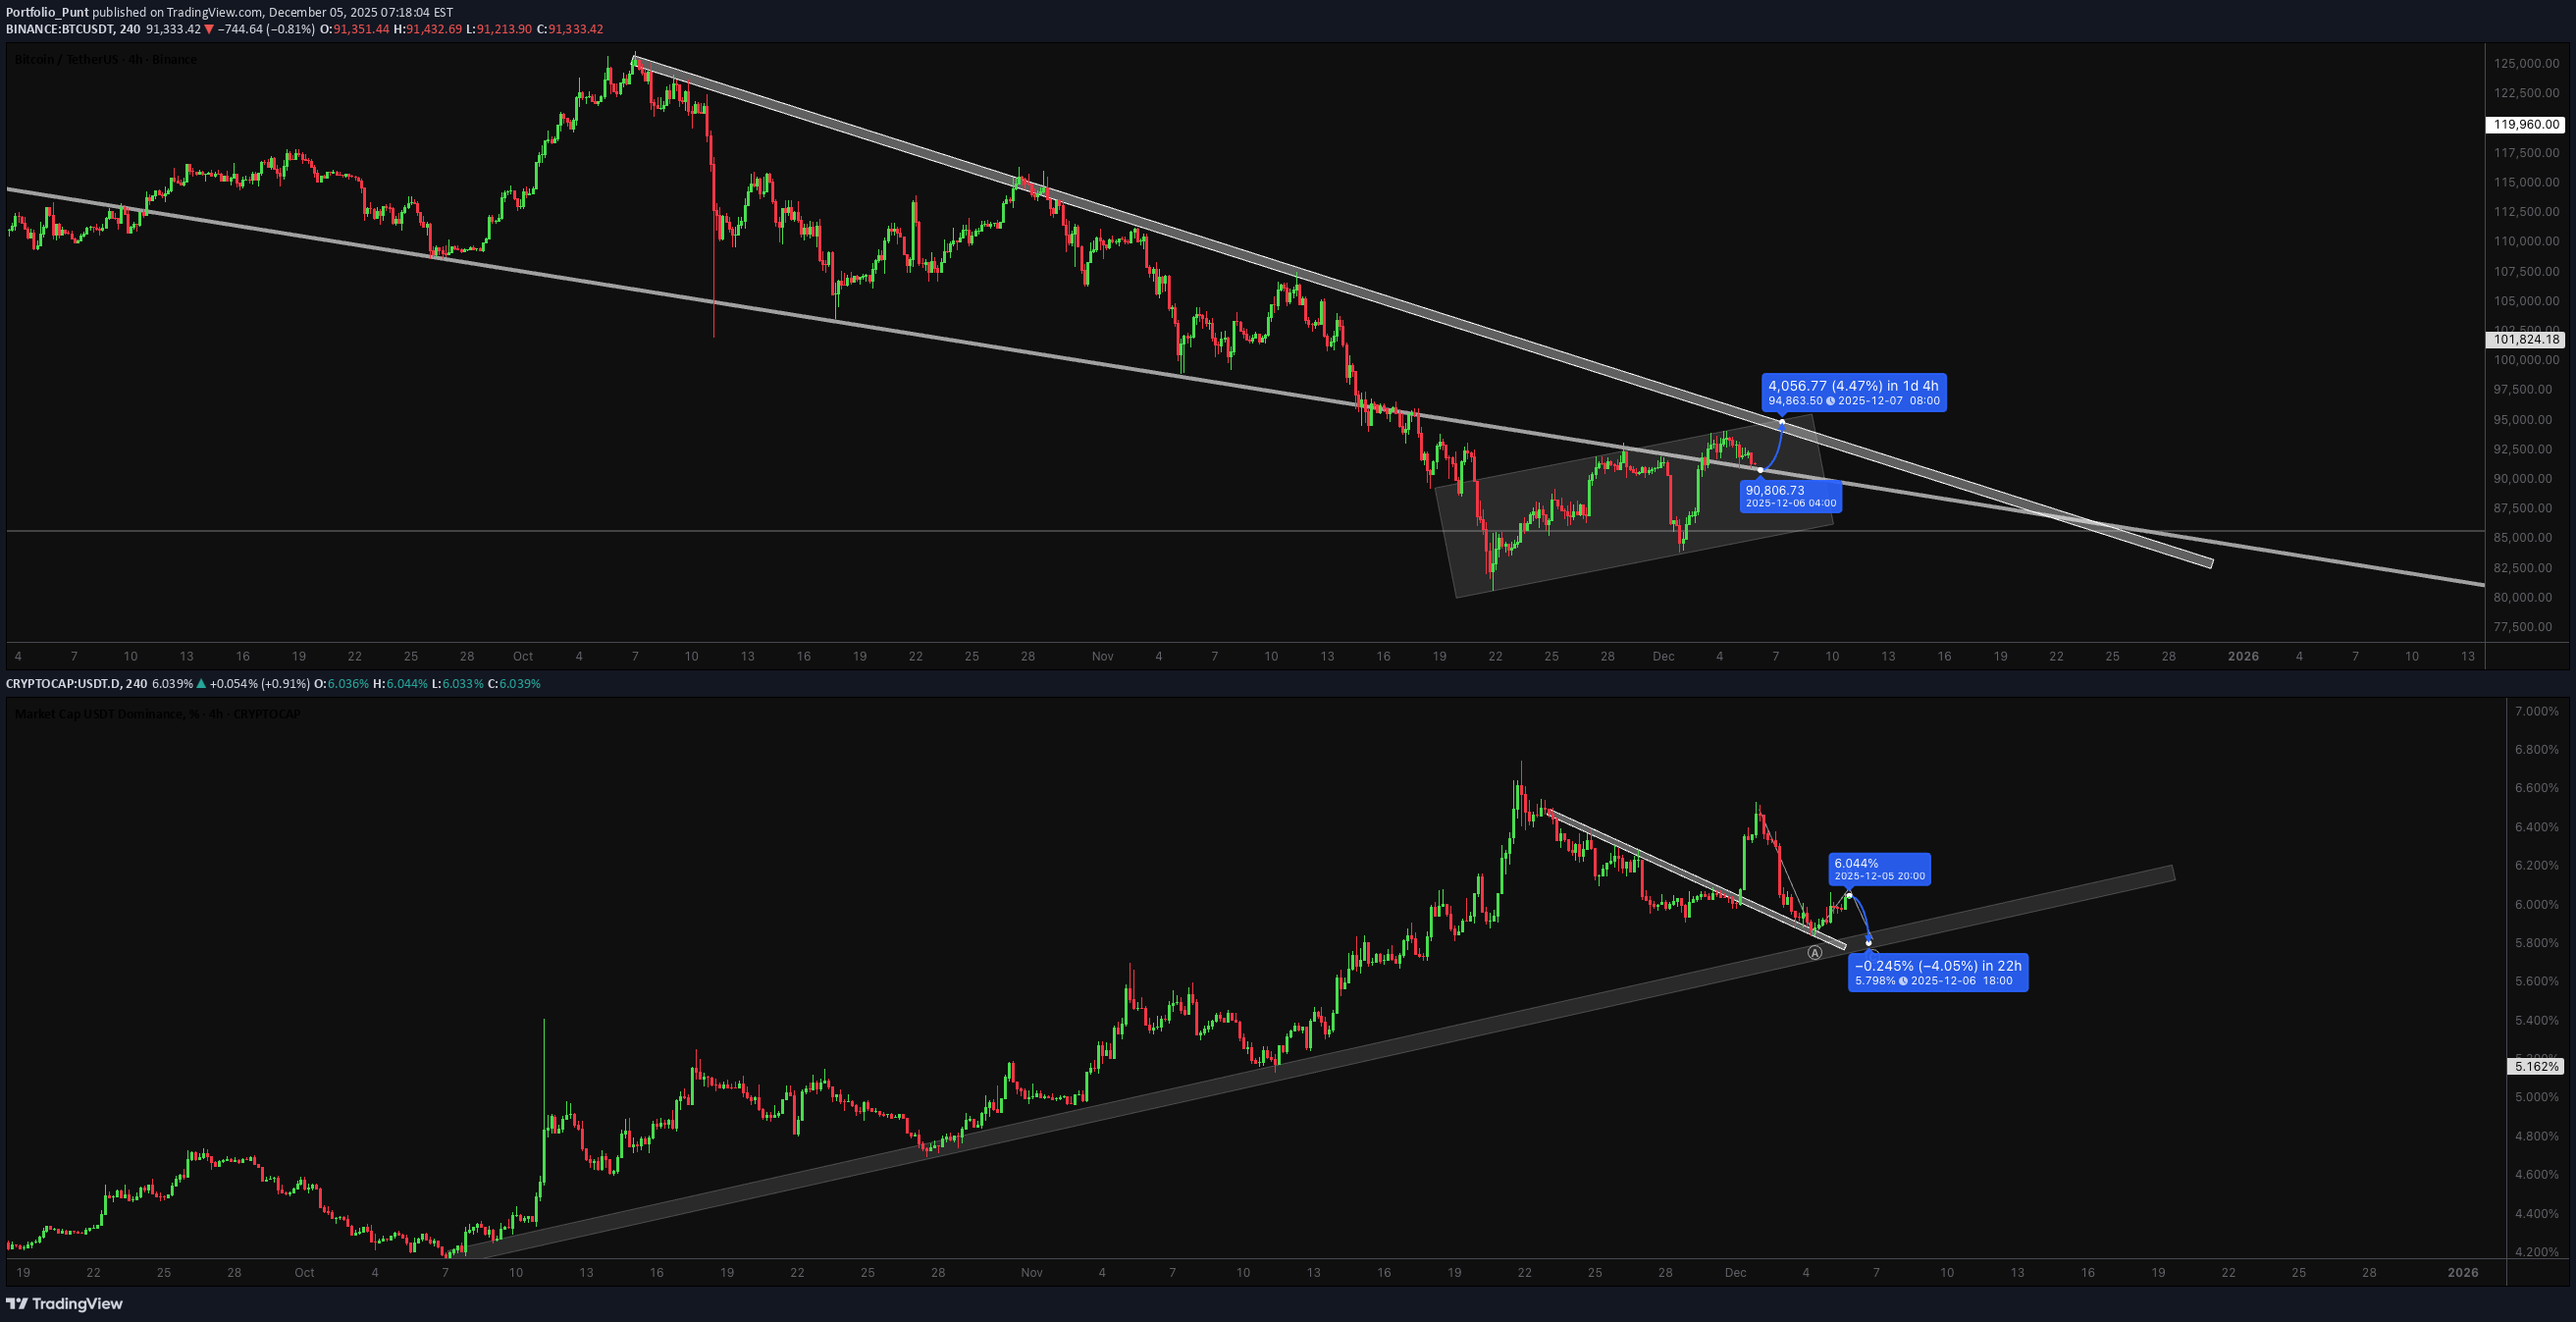
BTC: One More Push to 94K Before Potential Reversal? 📊 USDT.D Elliott Wave Analysis: Currently tracking Wave B of an ABC corrective pattern on USDT Dominance. This suggests we're in a counter-trend bounce before the final Wave C decline, which historically correlates with one more leg up in BTC. BTC Technical Setup: Successfully retested the descending trendline (visible on 4H) Breaking out of the converging triangle pattern Target: ~94,000 zone Timeline: Expecting the move to complete by Sunday night/Monday Key Observations: USDT.D showing signs of exhaustion in its corrective bounce BTC maintaining structure above support Trendline retest providing confluence for the next impulse move Trade Considerations: Watch for momentum slowdown approaching 94K Monitor USDT.D for Wave C initiation signals Potential distribution zone forming into Monday session Risk Management: This could be the final push before a deeper correction. Consider: Taking partial profits near target Trailing stops on remaining positions Reducing exposure ahead of the weekend/Monday transition
Portfolio_Punt
بیت کوین سیلور به کجا میرود؟ شکست مقاومت کلیدی و صعود انفجاری!
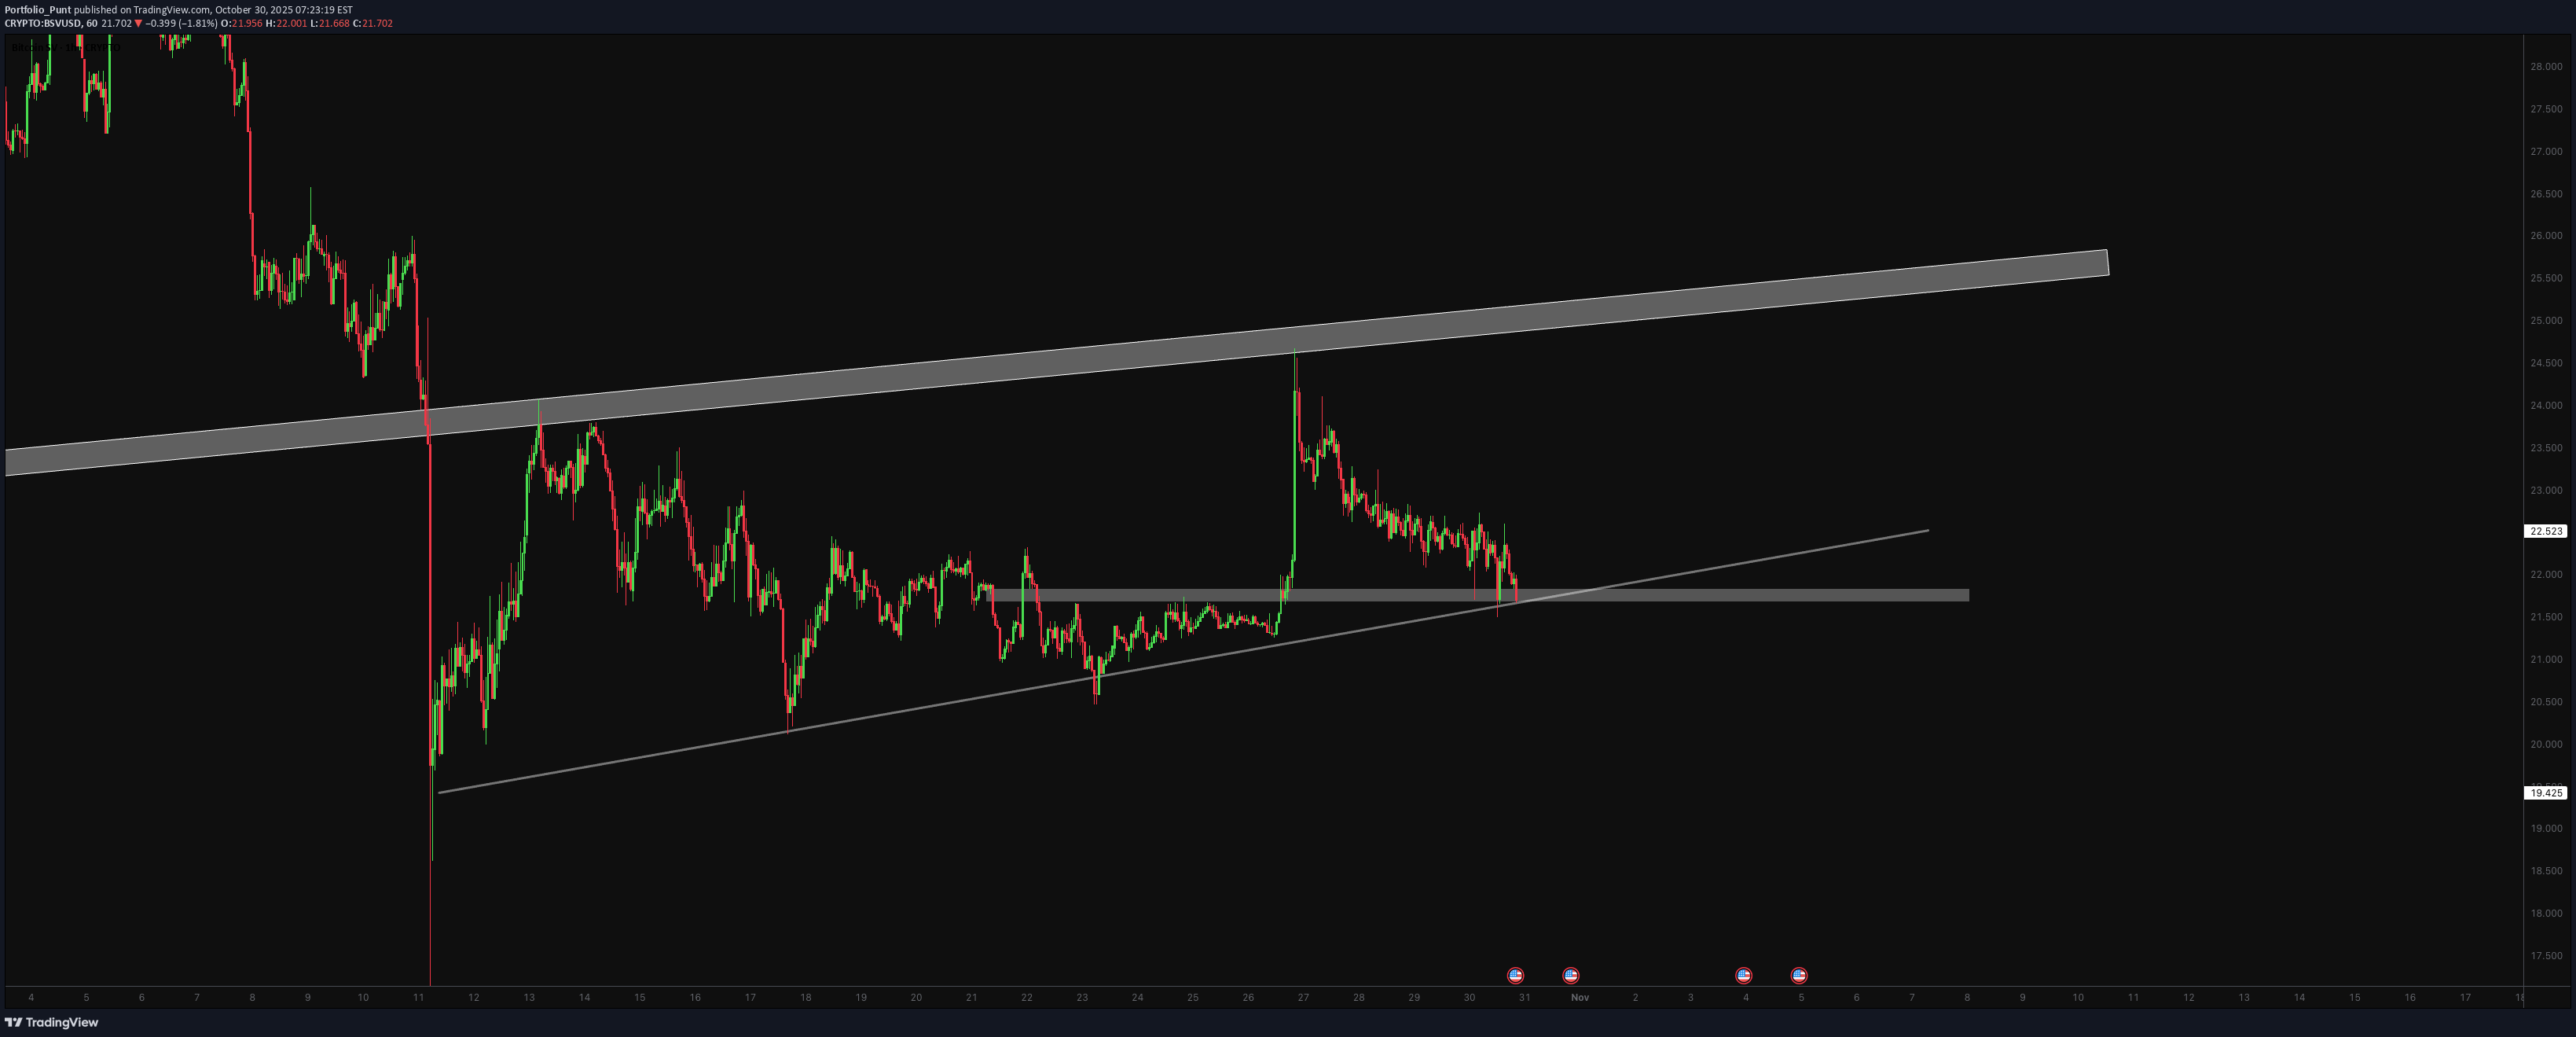
1. Critical Resistance Zone Approach Price is pushing toward major horizontal resistance (gray line) Multiple rejections in the past make this level key Break above this and we're looking at blue skies Volume should confirm the breakout Looking for an explosive more to the upside signalling continuation
Portfolio_Punt
BTC — targeting ~160k into end-January
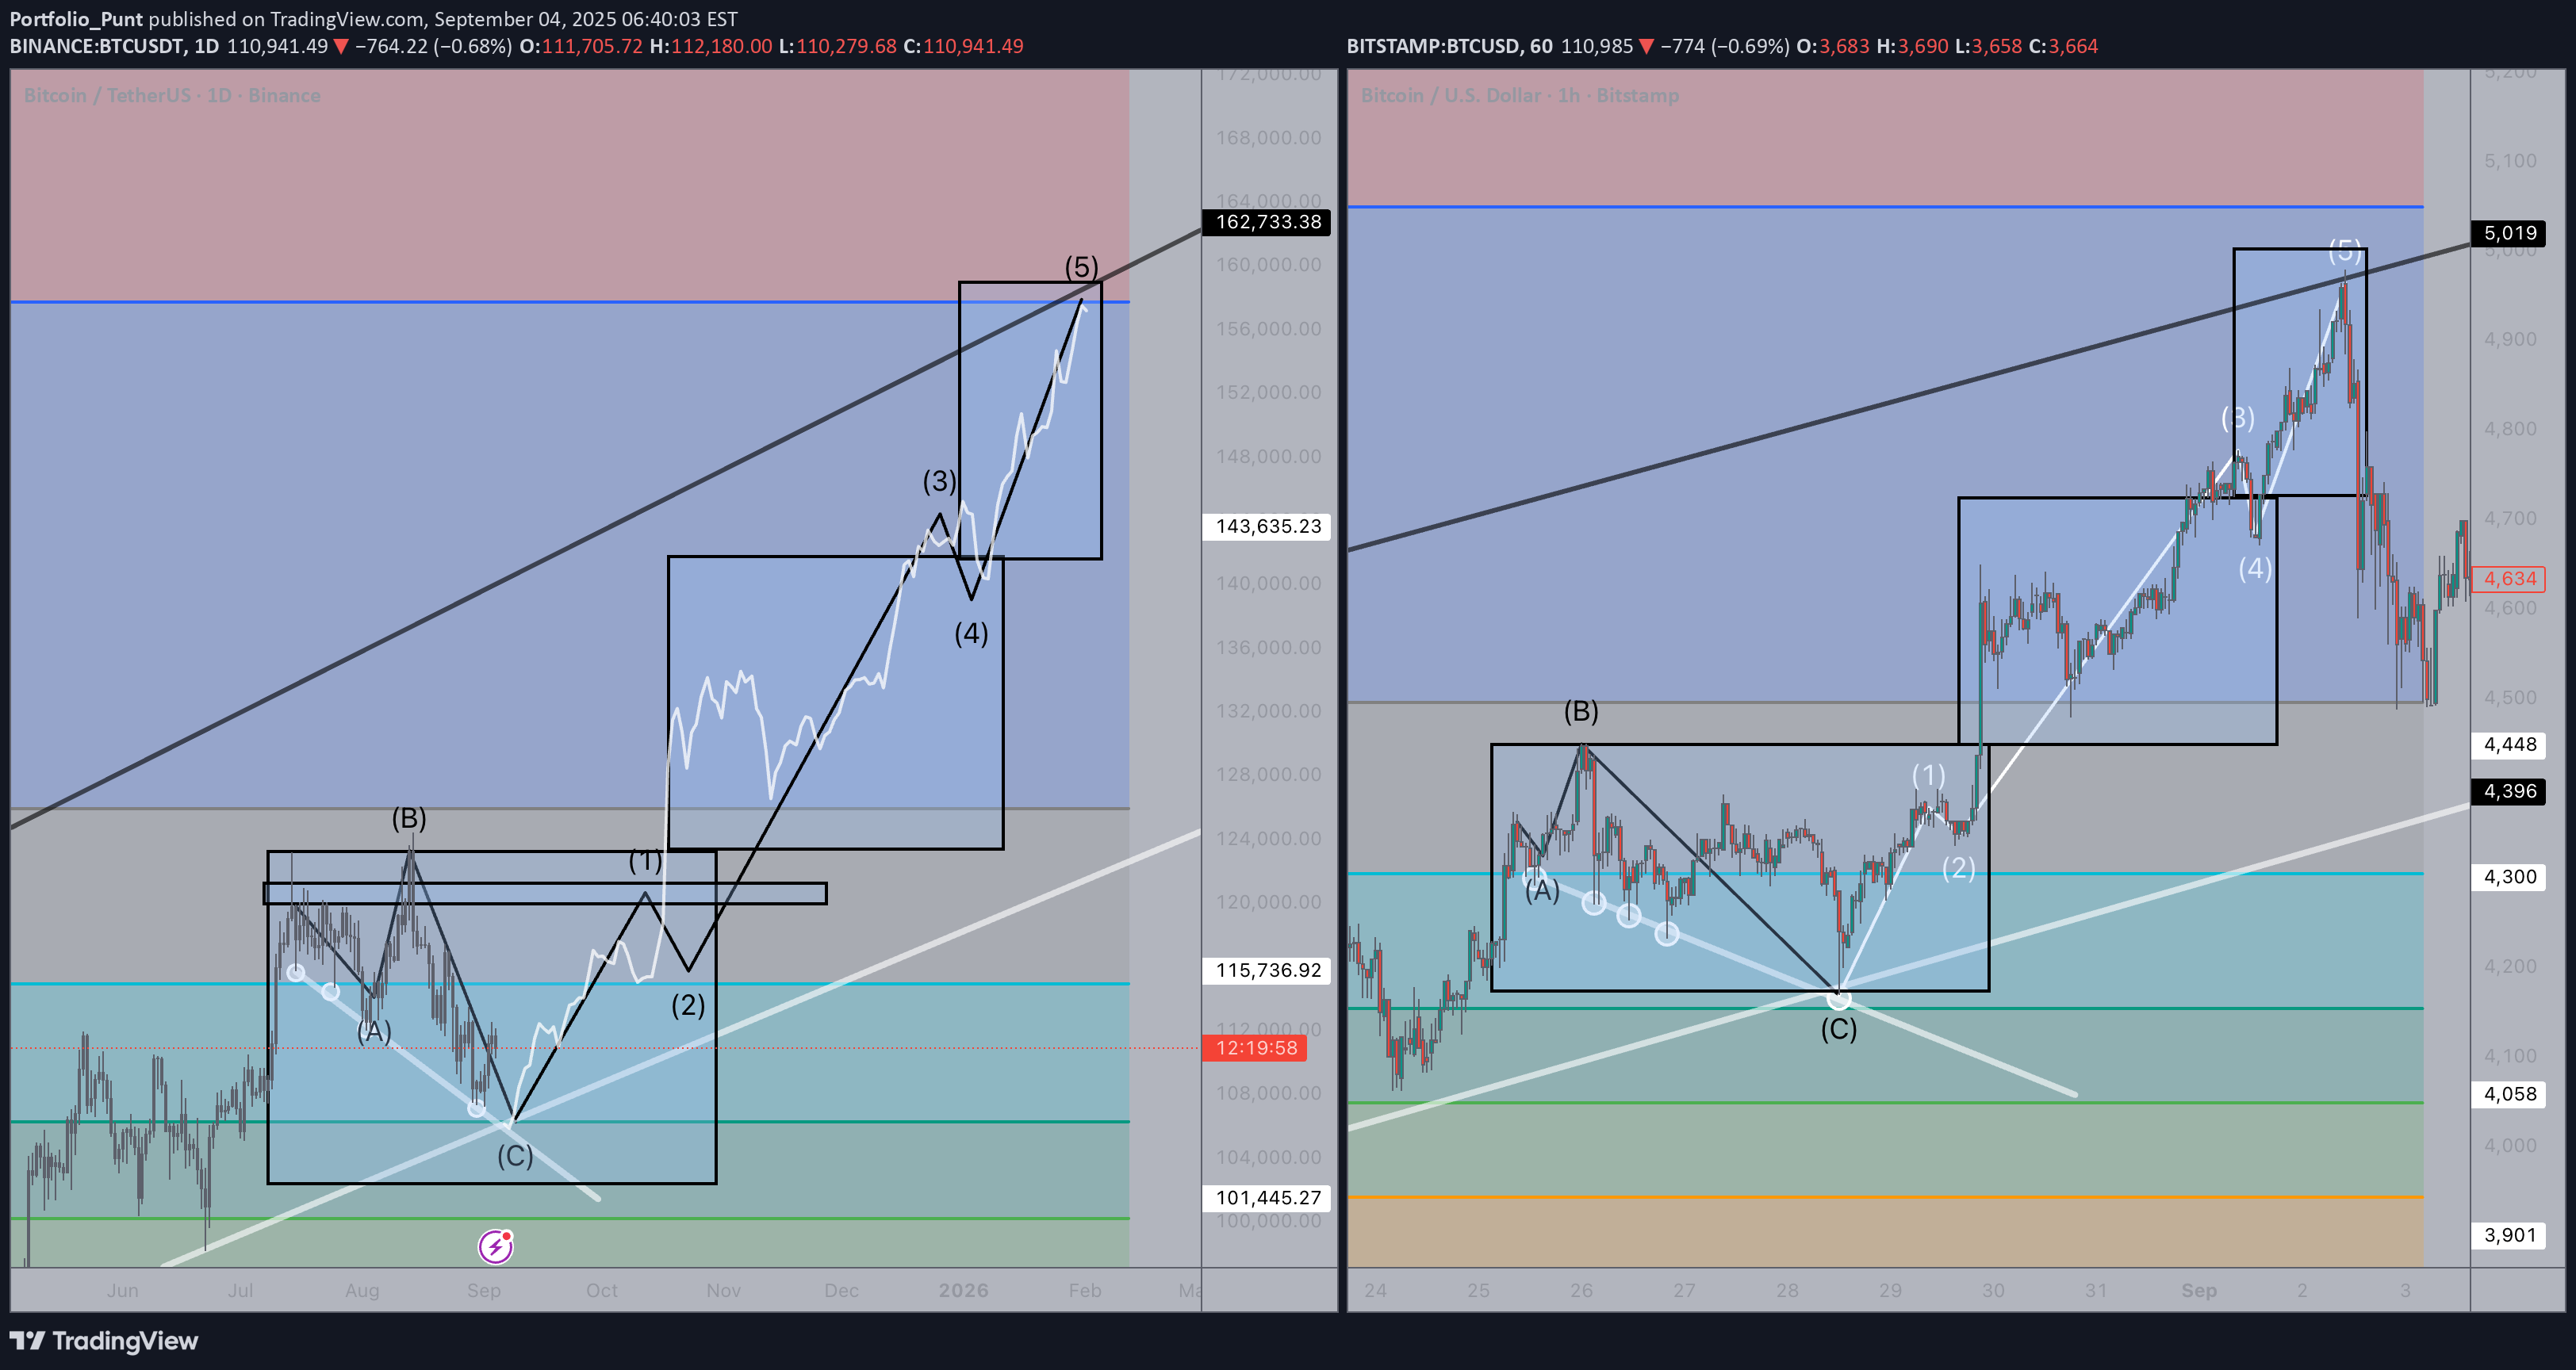
Chart maps an ABC base into a 5-wave impulse, using the right-hand lower-TF sequence as the template. The step-up “box → retest → expansion → pause → blow-off” rhythm has tracked well so far. Why ~160k, end-January •Wave (5) projection: 1.618 extension of 0→3 measured from (4) lands near 160k. •Upper diagonal/channel intersects that level in late January on the current spacing. •Measured-move of the prior consolidation added to the wave-(3) high also targets ~158–163k. •Fractal timeboxing from the reference leg places the climax in the final week of January. Path Hold the (4) range → grind into 155–158k → fast exhaustion toward ~160k → distribution. This is a roadmap, not advice. If prior box highs and the main trendline fail, the timing/target are likely off. #BTC #Bitcoin #BTCUSDT #BTCUSD #ElliottWave #Fractal
Portfolio_Punt
Don't feel too sheepish about investing in LAMB

Expecting a breakout at some point - This one pumps & is a low market capNo breakout yet - will happen soon
Portfolio_Punt
LUNC Retracement

There is some overhead resistance at 0.00015 Looking for a retracement to 0.000125 at least Move is similar to the last one, so a minor correction is due
Portfolio_Punt
RUNE Overhead Resistance

It may go up a bit higher, but I can see some overhead resistance on the logarithmic chart. Looking for a retracement to mid $4.
Portfolio_Punt
BTC Breakdown and Retest

I see two options playing out 1. We break through and reclaim the previous resistance (overhead trendline resistance) 2. This is a bearish retest of the previously touches trendline, the move will likely correct in a manner that exceeds expectations. As a result I see $22,000 / $20,000 (worst case) as being the targets. This is a contrarian view, but we should respect the trendline that held support previously, currently this just looks like a lower high.
Portfolio_Punt
BTC showing Signs of a Potential Reversal

We are at a key point, with horizontal support holding and USDT.D retesting its highs and having a trendline retest. As long as we hold here on the Daily we may get a nice relief rally for the next few weeks.
Portfolio_Punt
The Next Path for BTC (if we Breakdown from Here)

I'm expecting one last flush out before we begin an up trend. We could double bottom at 33ksih which would be the preferred scenario. If not we could see 28k as 30k is too obvious for a bottom, so expect us to push down from there if we can't hold 33k.
Portfolio_Punt
Bear Flag Forming for BTC

Adding a short position near $42,100 - $42,250 Stop loss close above upper trendline resistance
Disclaimer
Any content and materials included in Sahmeto's website and official communication channels are a compilation of personal opinions and analyses and are not binding. They do not constitute any recommendation for buying, selling, entering or exiting the stock market and cryptocurrency market. Also, all news and analyses included in the website and channels are merely republished information from official and unofficial domestic and foreign sources, and it is obvious that users of the said content are responsible for following up and ensuring the authenticity and accuracy of the materials. Therefore, while disclaiming responsibility, it is declared that the responsibility for any decision-making, action, and potential profit and loss in the capital market and cryptocurrency market lies with the trader.