PlanZ_Crypto
@t_PlanZ_Crypto

What symbols does the trader recommend buying?
Purchase History
پیام های تریدر
Filter
BTC MTF PA and key supports
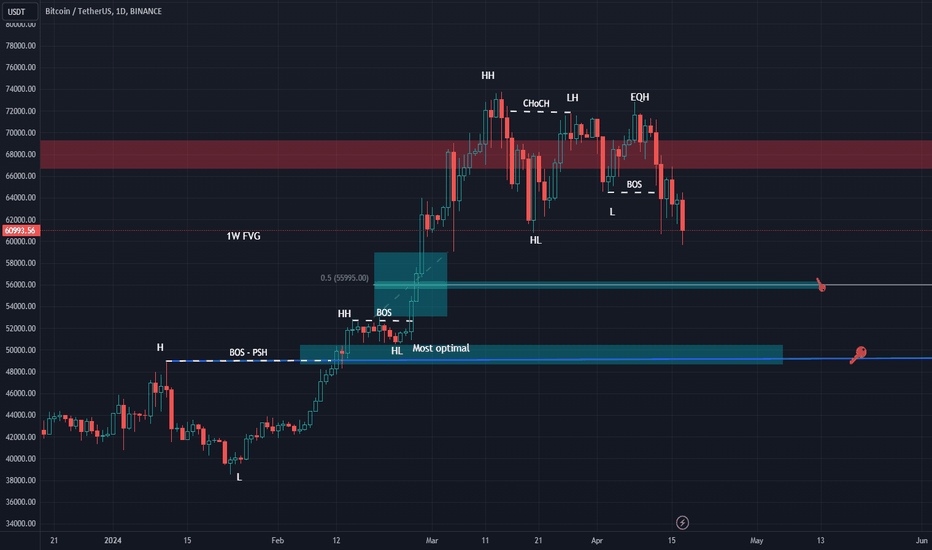
as we can see in the MTF, there was a change of character indicating a MTF reversal into key levels indicated. these levels were found using the weekly FVG. upon retest, i believe we can see a rally into new ATHs. this dip also did a good job at "Flushing" all the paper hands and completely obliterated open interest (OI). it is also important to mention that BTC is now trading at a spot premium, which is a very good indicator to monitor local bottoms. therefore, i believe we have or very close to bottoming. Credits to @MoneyTaur_ on X
VET potential is HUGE
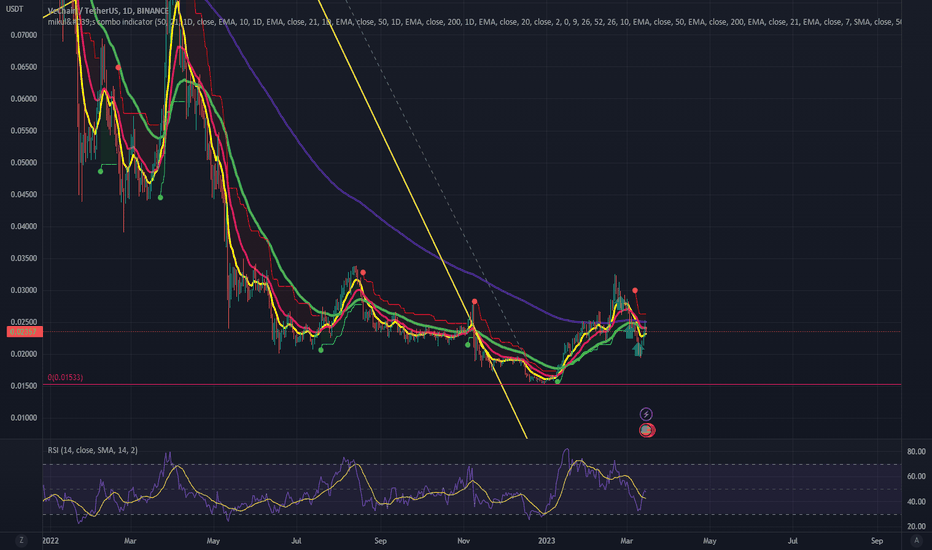
Vechain (VET), a leading enterprise-focused blockchain platform, has recently displayed significant bullish momentum as it crosses the crucial 200-day Exponential Moving Average (EMA) line. This key technical indicator is a vital sign for many traders and investors, as it often signals a potential shift in the market trend. Additionally, the Supertrend, a popular trend-following indicator, is on the verge of turning green, further reinforcing the positive outlook for VET. These confluence factors suggest that VET may be entering a new growth phase, presenting an opportune moment for those looking to capitalize on its potential upside. As always, investors are advised to conduct thorough research and consider their risk tolerance before making any investment decisions.
CHR high pump potential

Additional annotation on the price action of CHR. using the supertrend + EMA 200 strategy, the price action appears to be in a good place for a long position. my ideal price is between 0.45$ and 0.5$, and hodl unless the supertrend indicator states otherwise.my entry is after the retest on the purple area and after closing over 0.54$ on 1H frame. 15% profit in 1.5 hours!!
CHR high pump potential

using the supertrend + EMA 200 strategy, the price action appears to be in a good place for a long position. my ideal price is between 0.45$ and 0.5$, and hodl unless the supertrend indicator states otherwise.
BTC NEXT RESISTANCE AT 44444$

the red line indicates a very strong resistance which is at 44444$.
DGB showing bullish signs

Using the Supertrend + EMA200 strategy, all entry conditions are met and the stop loss should be set at the bottom line of the super trend indicator.
Keeping it simple

after a breakout, there must be a retest before the price action is bullish again
Let's hope BTC pitchfork holds
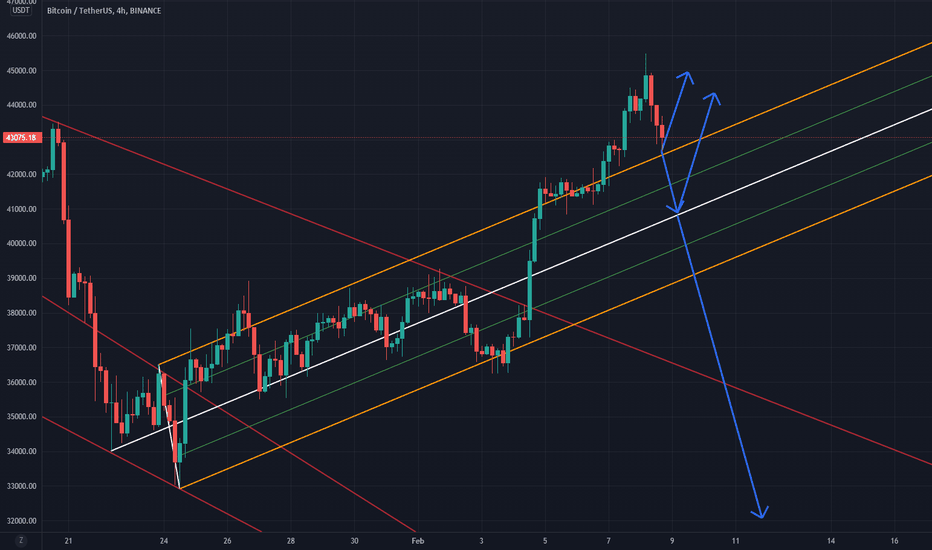
the pitchfork proved to be accurate in predicting BTC price movement since the dip. i belive the upper and middle lines of the pitchfork to be strong supports for the price. otherwise, we might see another dip in the 32K area (which is a great opportunity for buying)
BTC downtrend is not over

I belive the dip would in the 30K-28K range. therefore, I belive the market will trade sidewise for some time to retest the downward channel resistance before dipping again. i would be cautious and set stop loss for open positions.
Critical time for BTC

the descending red line is a strong resistance and need to be broken for the price to go higher.
Disclaimer
Any content and materials included in Sahmeto's website and official communication channels are a compilation of personal opinions and analyses and are not binding. They do not constitute any recommendation for buying, selling, entering or exiting the stock market and cryptocurrency market. Also, all news and analyses included in the website and channels are merely republished information from official and unofficial domestic and foreign sources, and it is obvious that users of the said content are responsible for following up and ensuring the authenticity and accuracy of the materials. Therefore, while disclaiming responsibility, it is declared that the responsibility for any decision-making, action, and potential profit and loss in the capital market and cryptocurrency market lies with the trader.