
Pipsview_Analysis
@t_Pipsview_Analysis

What symbols does the trader recommend buying?
Purchase History
پیام های تریدر
Filter
Pipsview_Analysis
XAUUSD Gold Analysis

XAUUSD formed a symmetrical triangle pattern (converging trendlines), followed by a breakdown of the ascending trendline, suggesting bearish momentum. Price has broken below the ascending support trendline and is currently testing a minor consolidation zone, indicating potential for further downside. 🔻 Bearish Setup: Entry Point: Current price around $3,223.36, just below the broken ascending trendline. Ideal sell entry confirmation has occurred with the break of the ascending trendline support. 🎯 Downside Targets: Target 1: $3,194.752 This level aligns with previous structure support and is the first take-profit zone. Target 2: $3,176.149 A deeper support zone formed by previous price action. If price continues bearish momentum, it will likely react here. Target 3: $3,132.646 This is a major support zone and the final take-profit level based on the chart. Reaching here would confirm a full bearish move. 🛑 Stop Loss Placement: $3,247.014 Placed above the upper resistance trendline and recent swing high. If price breaks above this level, it invalidates the bearish pattern. 📈 Key Chart Details: Candlestick Behavior: Multiple rejections at the upper trendline suggest strong resistance. Volume: Volume spike at the breakdown level would further confirm bearish bias (not visible in the current image, but important to monitor). Risk-Reward: The setup shows a favorable risk-to-reward ratio, especially if holding till Target 3. ⚠️ Potential Considerations: Watch for fakeouts or retests of the broken trendline. A retest of $3,230-$3,235 could occur before further decline. Monitor economic news/events like U.S. inflation, Fed announcements, or geopolitical tensions as they heavily impact gold. ✅ Conclusion: This is a high-probability short setup for XAUUSD, with confirmation from: Symmetrical triangle breakdown, Lower highs, Clear downside targets, Well-defined stop-loss. If bearish momentum continues and fundamentals align, gold could slide toward $3,132, completing the full projected move.
Pipsview_Analysis
XAUUSD Technical Analysis Update

🔹 Timeframes Observed: H1, M30, and M15 Gold (XAUUSD) has officially broken the trendline on all three lower timeframes — 1 Hour, 30 Minutes, and 15 Minutes — indicating a clear shift in market structure towards the downside. 🔹 Key Support Level: The next critical confirmation of bearish continuation will occur if price breaks below the $3116 support zone. A clean break and retest of this level can serve as strong validation for further downside movement. 🔹 Target Zones: If the bearish momentum sustains, price may head towards the following levels: 🎯 Target 1: $3195 🎯 Target 2: $3172 🎯 Target 3: $3132 🔹 Stop Loss: To manage risk effectively, a recommended stop loss is placed at $3250. This helps protect against unexpected price spikes or false breakouts. 🔹 EMA Confluence: The 21 EMA on the M30 timeframe has been broken, adding another layer of confirmation to the bearish bias. This EMA break often signals a shift in short- to mid-term trend direction. ⚠️ Important Note on Fundamentals: While technicals currently show a bearish setup, it's essential to monitor fundamental drivers closely — including economic news releases, central bank statements, tariffs, and geopolitical events — as any significant development can invalidate technical patterns and shift market sentiment instantly.Target 01 reached
Pipsview_Analysis
Gold (XAU/USD) Price Outlook:

Gold (XAU/USD) Price Outlook: 🔸 Bearish Scenario: If the price of gold breaks and closes below the key support level of 3016, it will indicate a strong bearish signal. This breakdown would suggest that selling pressure is increasing, and we could see a continued downward move toward the next support zone. The immediate target in this case would be around 3002, where buyers may attempt to step in. A sustained move below 3002 could open the door for further downside. Key Levels to Watch: Support: 3016 (break level) Target: 3002/2978 Additional downside possible if 3002 fails to hold 🔸 Bullish Scenario: On the other hand, if gold breaks and closes above the resistance level of 3030, it will signal bullish momentum and a possible continuation of the uptrend. This breakout could trigger buying interest, pushing the price higher toward the next resistance levels at 3052 and 3065. These levels will act as short-term targets for bulls. Key Levels to Watch: Resistance: 3030 (break level) Bullish targets: 3052 and 3065 Further upside possible if momentum continues above 3065
Pipsview_Analysis
XAU/USD Analysis Update – Bullish Momentum

XAU/USD Analysis Update – Bullish Momentum in Play Gold has shown strong bullish momentum, currently trading at $3037 after a powerful rejection from the supply zone at $3017. It has successfully broken the previously long-standing resistance at $3033, confirming a potential shift in market sentiment. With this breakout, I expect gold to continue its upward movement toward the following targets: TP1: $3065 – where a major trendline resistance is in play. TP2: $3100 – upon a successful break and close above $3065. Note: A short-term retracement toward $3026 is possible before the bullish rally resumes. Stay alert and manage risk accordingly. Price action and structure are favoring the bulls for now.
Pipsview_Analysis
XAUUSD bearish targets

It looks like gold has reached a strong supply zone and is now preparing for a retracement Possible Retracement Levels: First Target: 3011 Second Target: 3000 Third Target: 2993 Stop loss; 3034
Pipsview_Analysis
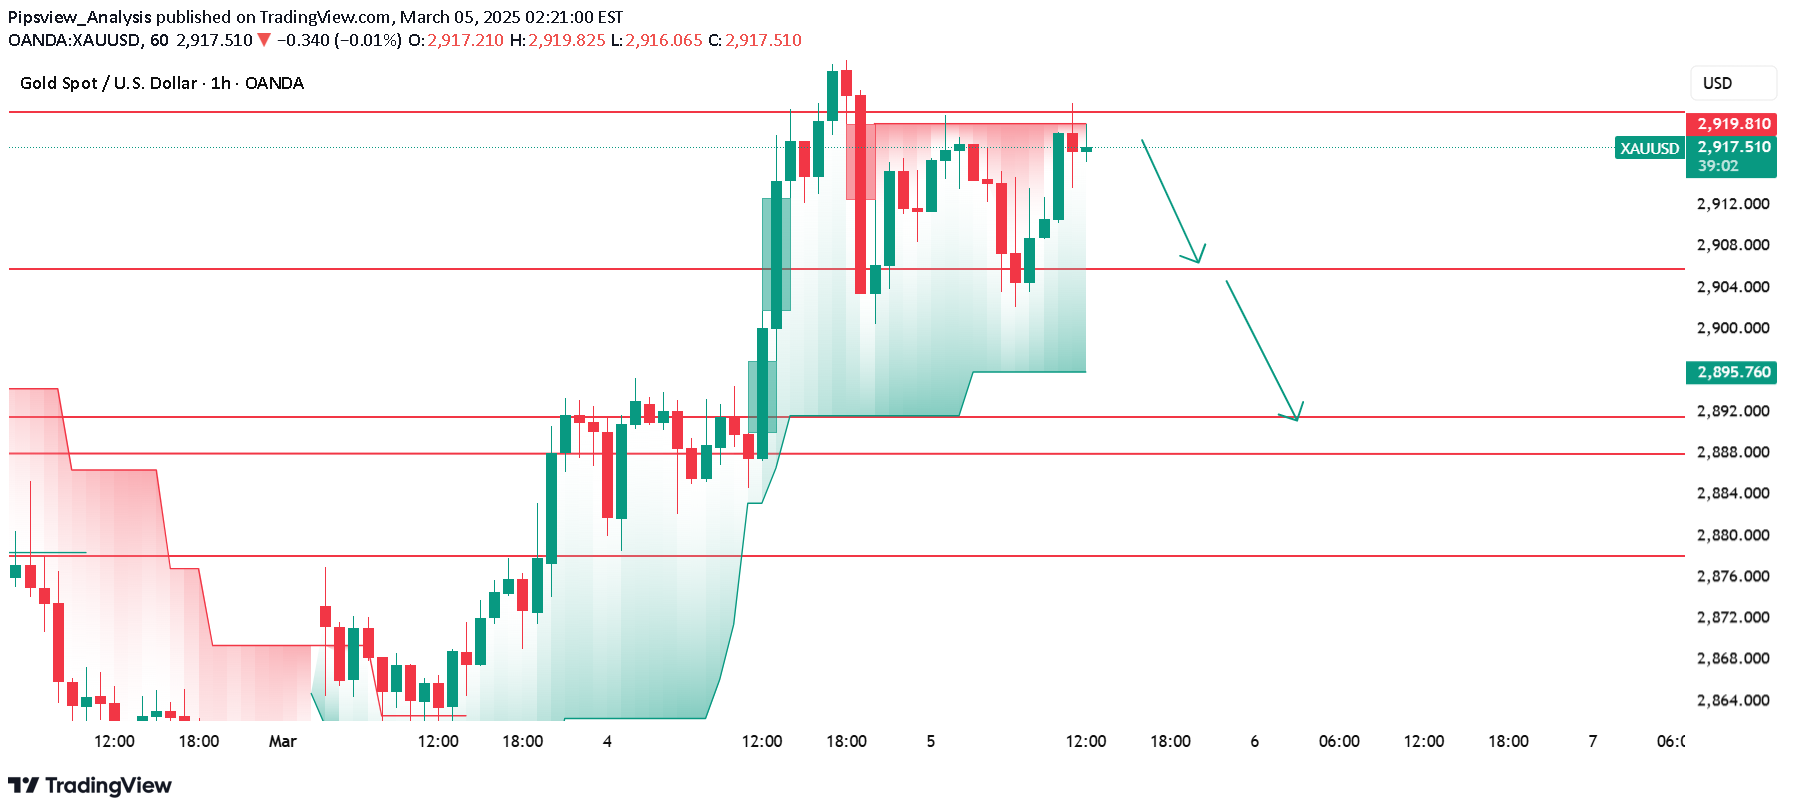
XAUUSD GOLD Market Analysis & Forecast

Current Market Condition Gold (XAU/USD) is currently in a consolidation phase, trading within a range between $2930 and $2891. At present, the price stands at $2909.50, indicating that the market is indecisive and awaiting a breakout. On the Daily (D1) timeframe, XAU/USD has broken the previous uptrend, signaling a potential shift in momentum. The current price action suggests that the market is undergoing a retracement phase, and a deeper correction may be expected. Bearish Scenario: Downside Breakout Expected The $2930 resistance level has been tested multiple times, with strong rejection, confirming the presence of strong sellers in the market. If XAU/USD fails to regain strength above $2930, it is likely to break the key support level at $2891 and continue its downward move. Once $2891 is broken, further downside targets are: Target 01: $2859 Target 02: $2834 These levels align with historical support zones and Fibonacci retracement levels, further supporting the bearish outlook. Bullish Scenario: Breakout Above $2930 If XAU/USD gains bullish momentum and breaks above the $2930 level, buyers will take control, and the price may rally further. The immediate upside targets in this scenario are: Target 01: $2956 Target 02: $2980 Additionally, market sentiment remains highly bullish in the long term, with expectations that gold could test its all-time high of $3000. Market Sentiment & Conclusion The current sentiment in XAU/USD suggests a higher probability of downside movement, as long as the price remains below $2930. However, a breakout above this level will shift the momentum in favor of buyers, targeting new highs. Traders should monitor key levels closely and watch for confirmation before entering trades. 📌 Key Levels to Watch: 🔻 Support: $2891, $2859, $2834 🔺 Resistance: $2930, $2956, $2980, $3000
Pipsview_Analysis
Gold XAUUSD Price Analysis
Gold (XAU/USD) has encountered a strong resistance zone between 2921 and 2924, leading to a rejection at this level. This area has proven to be a significant hurdle for buyers, indicating strong selling pressure. As a result, we may see a potential downside move unless gold manages to break above this resistance convincingly. Key Levels and Market Outlook: Bearish Scenario: If the rejection holds, gold could move lower towards its immediate support levels. The first downside target is 2906, which acts as a minor support. If selling pressure continues and gold breaks below 2906, the next target is 2892, a stronger support level where buyers might step in. Bullish Breakout Possibility: If gold breaks above the 2924 resistance level, the next resistance to watch is at 2930. A break above 2930 would indicate strong bullish momentum, potentially leading to a further rally in gold prices. Market Sentiment and Trading Plan: A bearish bias is favored as long as gold remains below 2924 and continues rejecting this level. A bullish breakout scenario will be confirmed only if gold surpasses 2930, leading to a continuation of the uptrend.Target 01 reached
Pipsview_Analysis
Bitcoin (BTC/USD) Technical Analysis – Daily Timeframe

Bitcoin (BTC/USD) Technical Analysis – Daily Timeframe This chart presents a technical breakdown of Bitcoin (BTC/USD) using supply and demand zones to anticipate potential price movements. It reflects a bearish bias as price action shows rejection from the supply zone (sell zone) and an expected drop toward the demand zone (buy zone). 🔍 Key Chart Elements 1. Supply Zone (Sell Zone) – Resistance Area The supply zone is highlighted in the upper region, approximately between $86,000 and $88,000. This area represents a strong resistance where sellers are active, preventing further price increases. Bitcoin recently tested this zone but failed to break above, leading to a price rejection. 2. Demand Zone (Buy Zone) – Support Area The demand zone is marked in the lower region, around $69,000 to $67,000. This is a historical support level where strong buying interest is expected. If Bitcoin reaches this level, a potential bullish reversal could occur. 📉 Bearish Price Projection The chart includes a downward arrow, indicating an expected bearish movement from the supply zone toward the demand zone. Reason for the expected drop: BTC is struggling to gain momentum above $86,000, showing signs of weakness. The recent bearish candles suggest increased selling pressure in the market. A failed breakout above resistance increases the likelihood of a downward move. Price Targets: First target: Around $74,000, a potential minor support. Second target: Around $69,000, which aligns with the demand zone and could act as a strong support level. 🔄 Potential Alternative Scenario – Bullish Breakout (Low Probability) If BTC manages to break above the $88,000 resistance level, it could trigger a bullish rally. In this case, the next targets would be $92,000 and $96,000. However, given the current market structure, this is a less likely scenario unless buying momentum increases significantly.
Pipsview_Analysis
Gold Price Analysis: Bearish Breakdown Below Key Support at 2888

Gold (XAU/USD) has broken below the strong support level of 2888, indicating a potential continuation of the downtrend. This breakdown suggests increasing bearish momentum, and traders should be prepared for further declines. Downtrend Scenario & Targets If the bearish pressure continues, gold is likely to move toward the following downside targets: ✅ Target 01: 2866 – A minor support level where price may consolidate before further movement. ✅ Target 02: 2855 – A stronger support zone that could act as a temporary stopping point for sellers. ✅ Target 03: 2835 – A key demand zone, where buyers may step in to slow the decline. Possible Retracement Before Further Drop Despite the bearish outlook, gold may experience a temporary pullback before continuing lower. A retracement toward the previous support-turned-resistance at 2888 or even 2898 is possible. If the price fails to break above these levels, it could serve as confirmation for further downside movement. Trading Strategy Considerations 🔸 Sell on Retracement: If gold retraces to 2888 or 2898 and shows rejection (bearish candlestick patterns, wicks, or resistance confirmation), it could provide a good short-selling opportunity. 🔸 Break & Retest Confirmation: If gold retests 2888 and fails to break above, it would signal further downside movement. 🔸 Risk Management: Set stop-loss above 2900 to manage risk in case of unexpected bullish reversals.ALL Targets Reached
Pipsview_Analysis
XAUUSD GOLD breakout

Gold (XAU/USD) has successfully broken through the major resistance zone at 2940/2942, signaling strong bullish momentum in the market. This breakout indicates a potential continuation of the uptrend, with buyers likely to push prices higher. Breakout Confirmation & Market Sentiment The breakout above 2940/2942 suggests a shift in market sentiment, with bulls gaining dominance. Increased trading volume and sustained price action above this level further validate the breakout. If gold holds above 2942, it is likely to act as a new support level, providing a base for further upside movement. Potential Upside Targets: 2954 – The first immediate resistance level where minor pullbacks could occur. 2965 – A stronger resistance level that may attract profit-taking, leading to consolidation or a short-term retracement. 2979 – A key psychological resistance zone where price action should be monitored closely. If buyers remain strong, gold could push even higher. Additional Bullish Scenario: If the bullish momentum continues beyond 2979, gold could target the next major psychological level of 3000, which may act as a strong resistance zone. Key Support Levels to Watch: 2942 (Breakout Level) – Should now act as support; a successful retest could confirm further upside. 2928-2930 (Previous Resistance Turned Support) – If a deeper retracement occurs, this area may provide buying opportunities. Trading Strategy Considerations: Breakout traders can look for buy entries on retests of 2942 with tight stop losses below this level. Momentum traders may aim for 2954/2965, adjusting stop losses accordingly. Risk management is crucial—monitor price action at each resistance level to assess continuation or reversal signals. With geopolitical tensions, economic data, and Federal Reserve policies impacting gold prices, traders should stay updated on fundamental factors influencing market direction.
Disclaimer
Any content and materials included in Sahmeto's website and official communication channels are a compilation of personal opinions and analyses and are not binding. They do not constitute any recommendation for buying, selling, entering or exiting the stock market and cryptocurrency market. Also, all news and analyses included in the website and channels are merely republished information from official and unofficial domestic and foreign sources, and it is obvious that users of the said content are responsible for following up and ensuring the authenticity and accuracy of the materials. Therefore, while disclaiming responsibility, it is declared that the responsibility for any decision-making, action, and potential profit and loss in the capital market and cryptocurrency market lies with the trader.