
Peter_Wade
@t_Peter_Wade

What symbols does the trader recommend buying?
Purchase History
پیام های تریدر
Filter
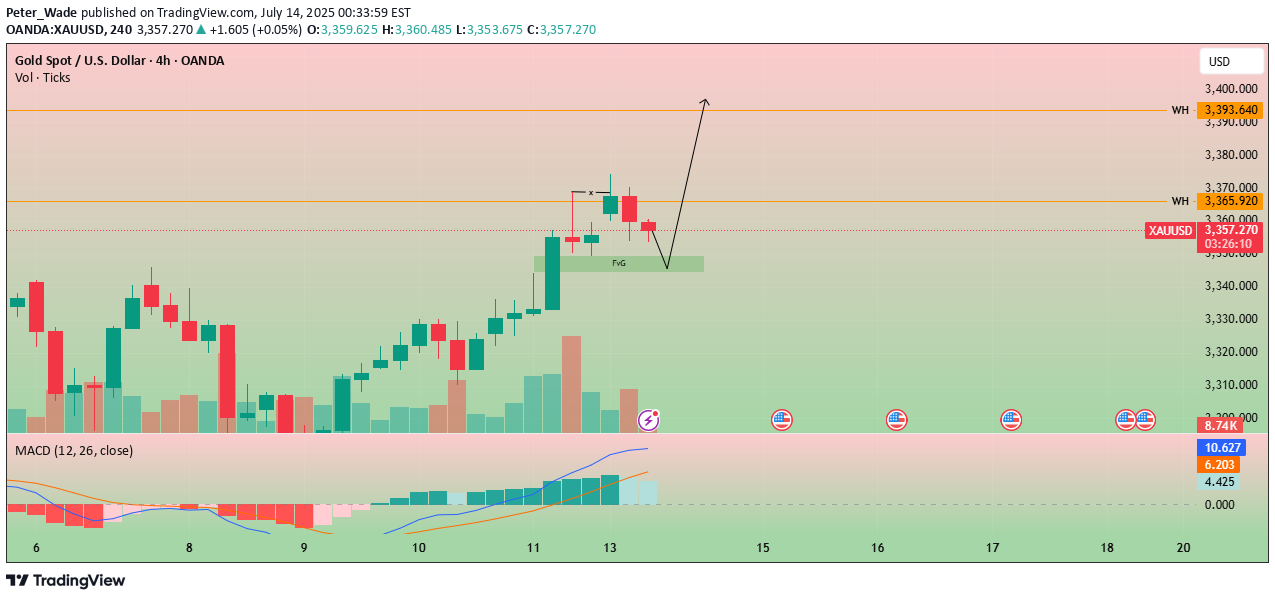
Gold Just Flipped Is the Drop Coming?
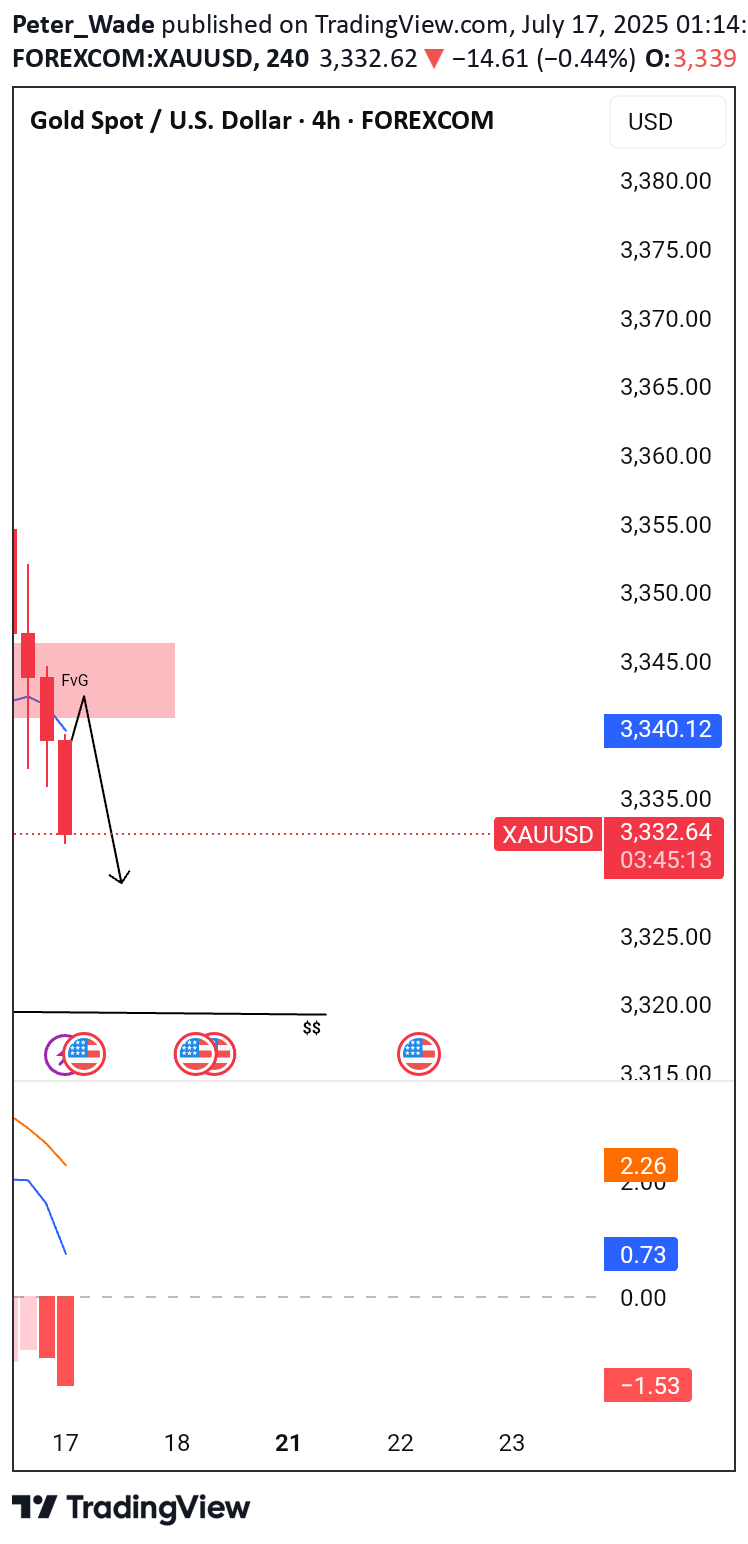
🚨 Gold Market Update – Are You Ready? 🚨 Yesterday, the gold market swept the liquidity from the previous days taking out stop orders and clearing out weak positions. After the sweep, price closed lower, showing clear signs of weakness. 📉 But that’s not all... In the process, it also broke through a key bullish Fair Value Gap (FVG) an area where buyers had previously shown strength. That FVG is now inverted, meaning it could act as a strong resistance level going forward. With this shift in structure, there's a real possibility that gold could drop further, potentially hunting the liquidity resting near previous lows. The market might be gearing up for a deeper move. 🔥 So the question is: Are YOU ready for the next leg down? 📌 As always Do Your Own Research (DYOR) This is not financial advice just reading the tape.
Volume Spread Analysis (VSA) reflects increasing selling!
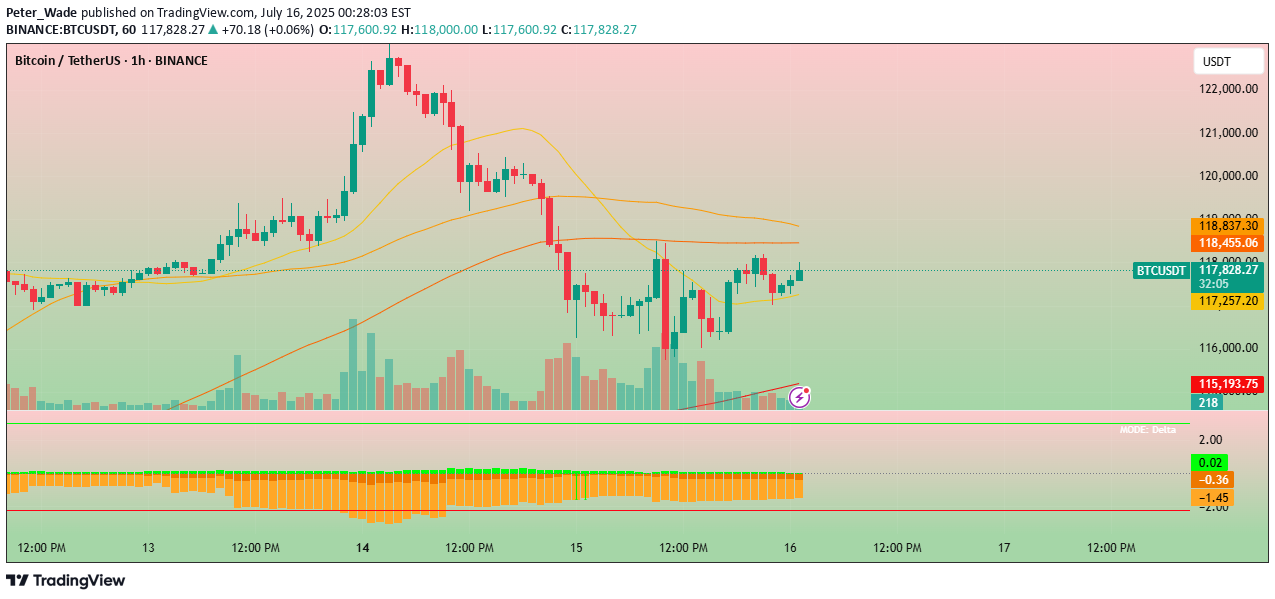
🚨 Bitcoin Market Update 🚨 Bitcoin recently hit an All-Time High (ATH) but is now experiencing a downward correction. Multiple technical indicators suggest continued bearish momentum: 📉 Volume Spread Analysis (VSA) reflects increasing selling pressure. 📊 A bearish engulfing pattern confirms the market is trending lower. 📕 The synthetic order book reveals a heavy concentration of sell orders. 📈 The 50 & 100 SMA are acting as strong resistance levels, keeping price action suppressed below them. 🔍 Key Watch Level: If BTC breaks above the 50 SMA, we could see a potential pump. However, as of now, all confirmations point toward a bearish continuation. 💡 DYOR – Do Your Own Research 🛑 Not Financial Advice
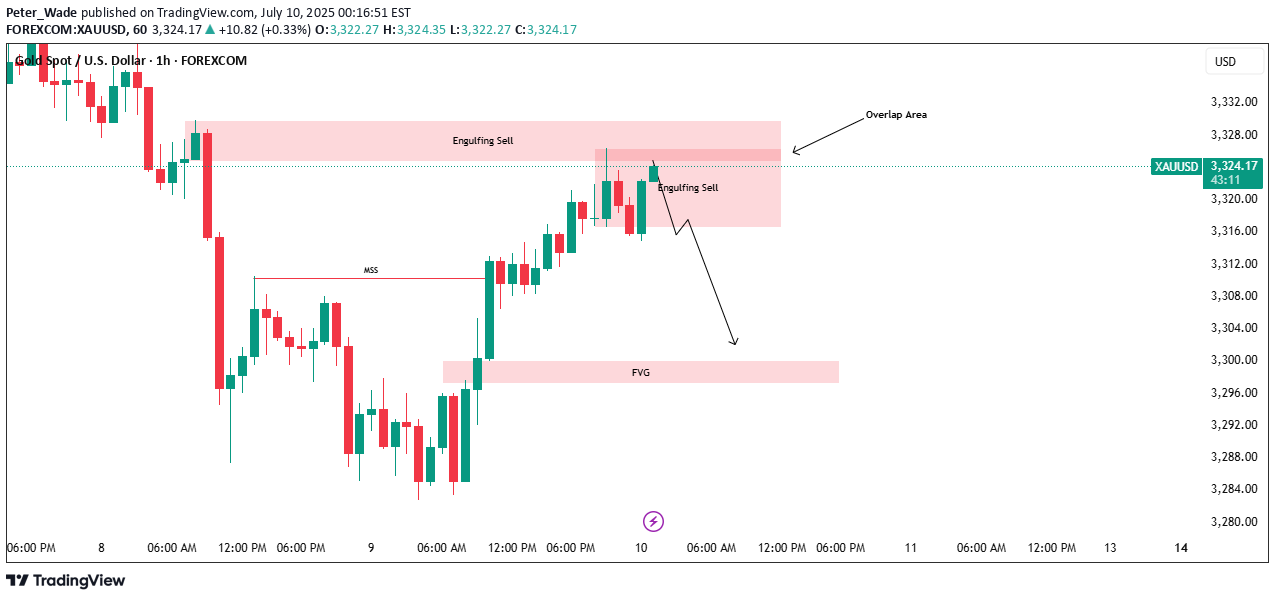
Gold has bounced back after tapping into the Fair Value Gap.
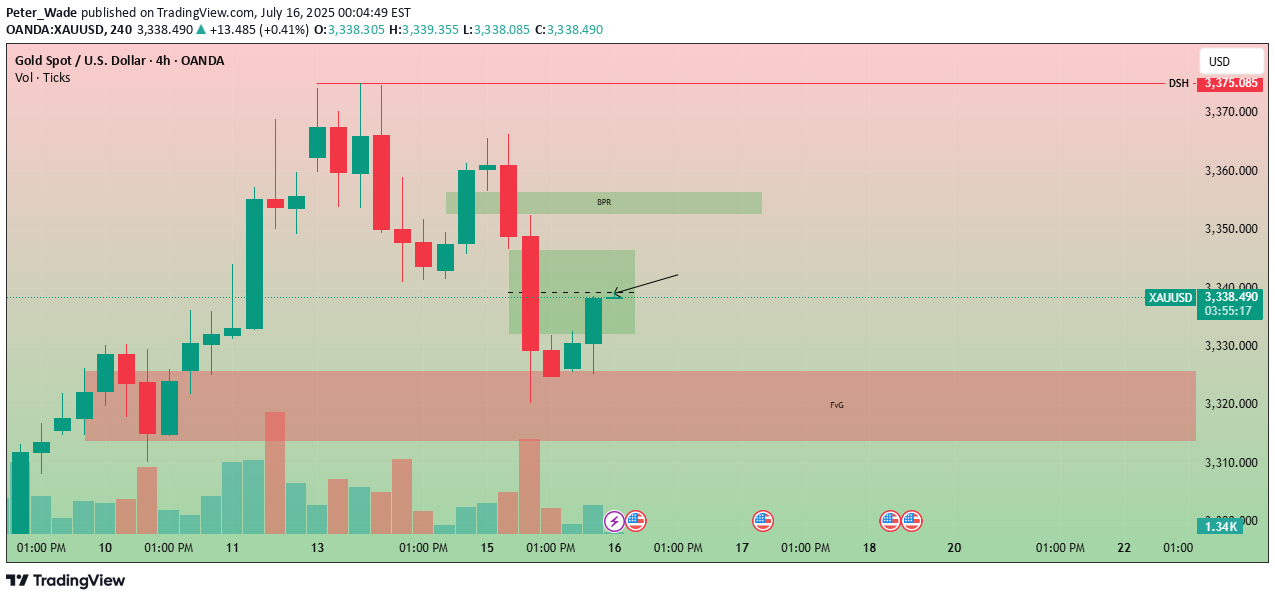
📈 Gold Market Daily Outlook 💰 Gold has bounced back after tapping into the Fair Value Gap (FVG) and clearing liquidity below recent lows. 🔥 Price is now heading into a key bearish FVG zone on the 4H chart. 📊 Key Level to Watch: If $3339 breaks with strong bullish momentum, we could see a further push towards $3350 and beyond. ⚠️ Reminder: This is not financial advice — always DYOR (Do Your Own Research)!
Gold is showing signs of bearish RSI divergence.
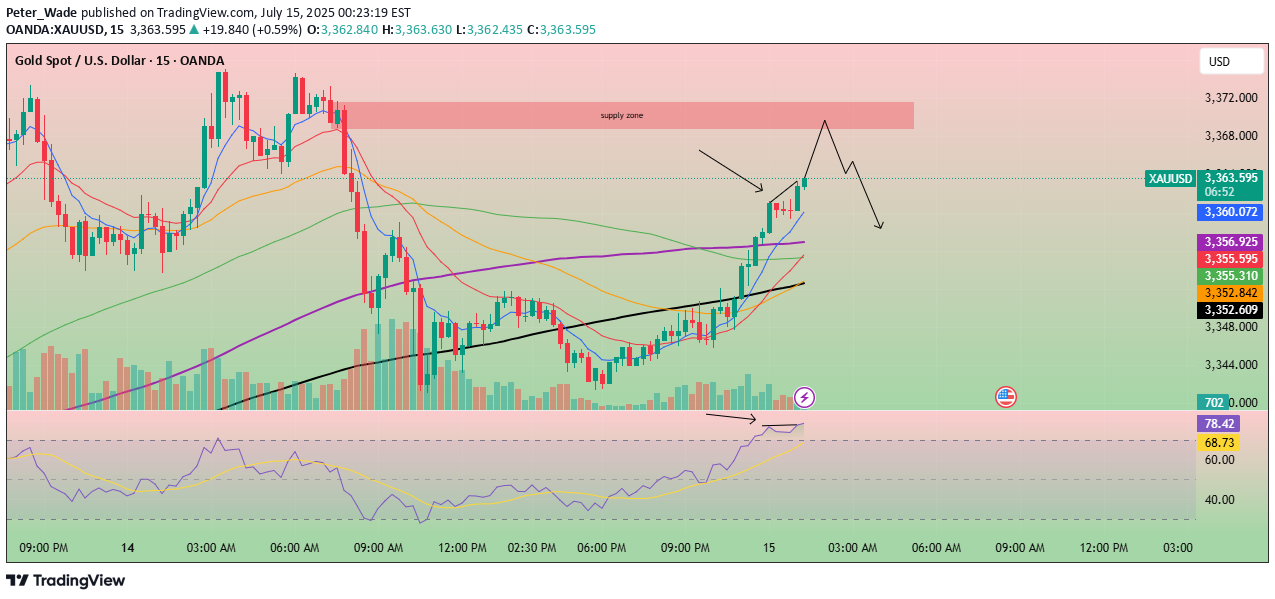
🚨 Gold Update – Potential Selling Opportunity Ahead 🚨 Gold is showing signs of bearish RSI divergence on the 15-minute chart, while the RSI is already in the overbought zone. The price is also approaching a key supply zone, which could trigger a reversal. 📉 Multiple confirmations are pointing toward a potential sell setup: Bearish RSI divergence Overbought RSI condition Approaching a strong supply zone If price breaks below the 8 EMA with a bearish engulfing candle, it may confirm downward momentum. ⚠️ Watch closely — This setup is shaping up with solid confluence. 🔍 Always do your own research (DYOR) – This is not financial advice.
Gold recently tapped into key liquidity zones
✨ Gold Market Update – Key Insights You Need to Know ✨ Gold recently tapped into key liquidity zones—specifically the highs of the previous day and the previous week. After grabbing liquidity at those levels, the market closed below them, signaling a potential shift in momentum. 🔻 What could be next? This price behavior suggests we might see further downside in the short term, possibly targeting the Fair Value Gap (FVG) below. If that area is reached, the market may find support and stage a rebound, potentially triggering a strong bullish move from that zone. 📊 What to watch for: Price reaction around the FVG Confirmation of support before entering any long positions Volume and structure shifts on lower timeframes ⚠️ Disclaimer: This is not financial advice. Always Do Your Own Research (DYOR) and manage risk wisely.Market pumped 170+pips from 4H bullish FvG.
Gold just played an interesting game on the 4-hour chart!
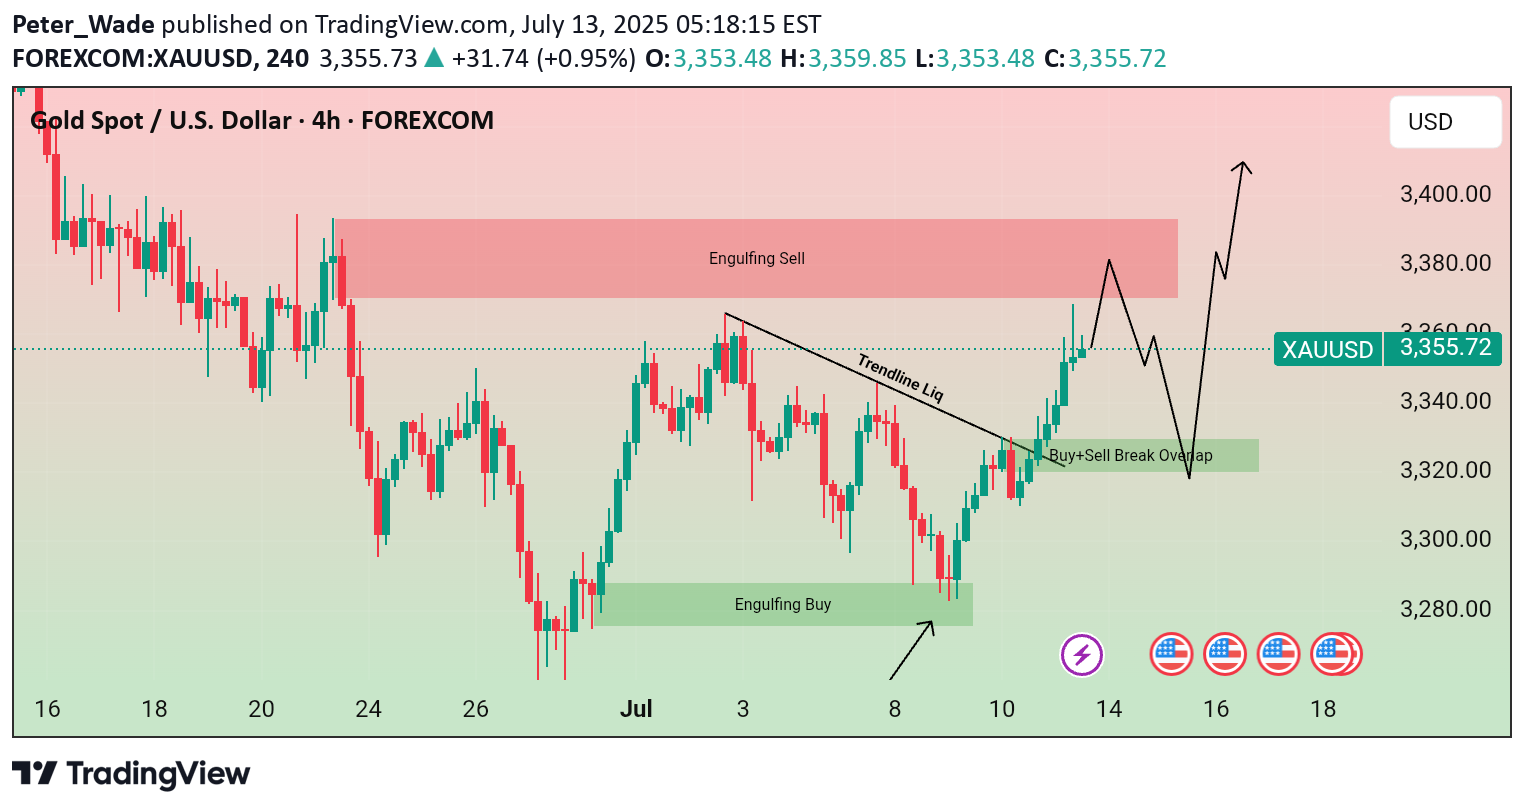
🚨 GOLD Technical Outlook – 4H Chart Insight! 🕵️♂️✨ 📉 First, we spotted a Bearish Engulfing pattern that created a strong Sell Zone, signaling downward pressure. But guess what? The market wasn't ready to give up just yet… 📈 From the lower end, a powerful Bullish Engulfing stepped in like a hero, offering solid support and pushing the market back up! Now here's where it gets exciting: 🔥 Gold has formed another bullish engulfing pattern, and the price is once again knocking on the door of that Sell Zone. 🤔 What's next? A rejection from this sell zone could trigger another drop 📉 But keep an eye on the overlapping support zone below — if price revisits and holds there, we could see a bullish bounce toward the upside again! 🚀 📌 Key takeaway: We’re at a decision point. The next move could be explosive — up or down. Stay sharp! 🔍 ⚠️ DYOR – Do Your Own Research! 🚫 This is not financial advice — just a trader's perspective.
The real action begins around 3349–3352!
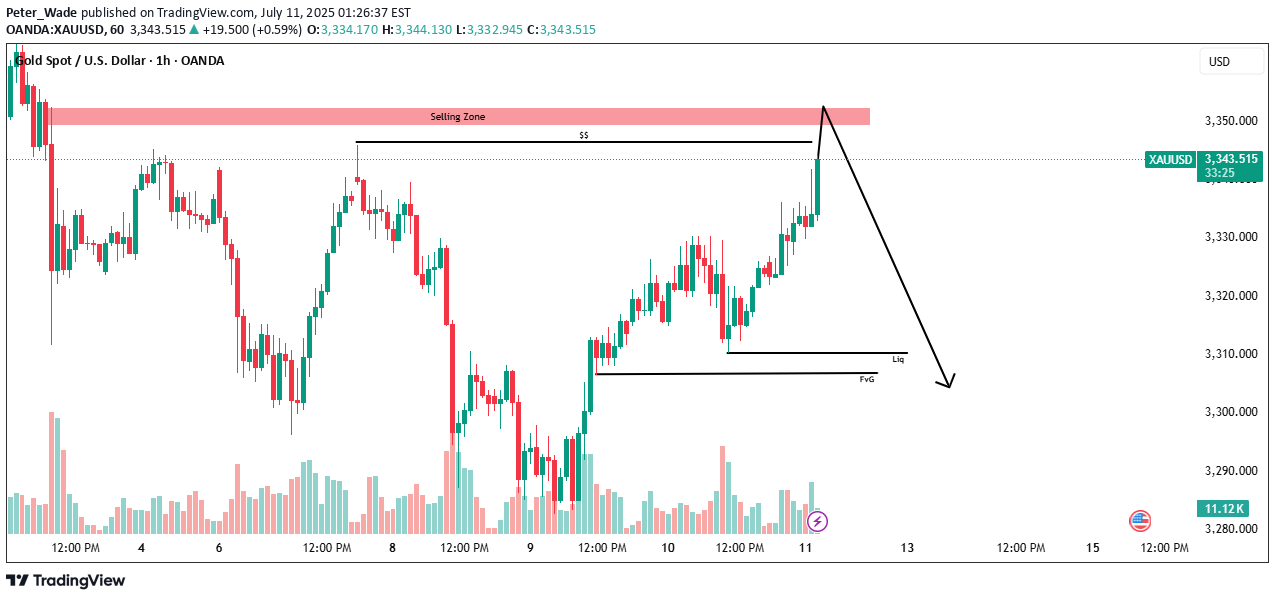
🚨 Market Watch – Reversal Zone Ahead! 🚨The market is moving up with strong momentum, eyeing the 3346 liquidity level, where buy-side orders are likely to be swept.But the real action begins around 3349–3352 a key selling zone where institutional sellers may step in. This area could act as a major resistance, setting the stage for a potential reversal or pullback.📉 If price shows signs of rejection here, it could be a smart opportunity for short setups. However, always stay sharp and let the price action guide your move.📌 DYOR (Do Your Own Research)⚠️ This is not financial advice just market insight. Trade responsibly.
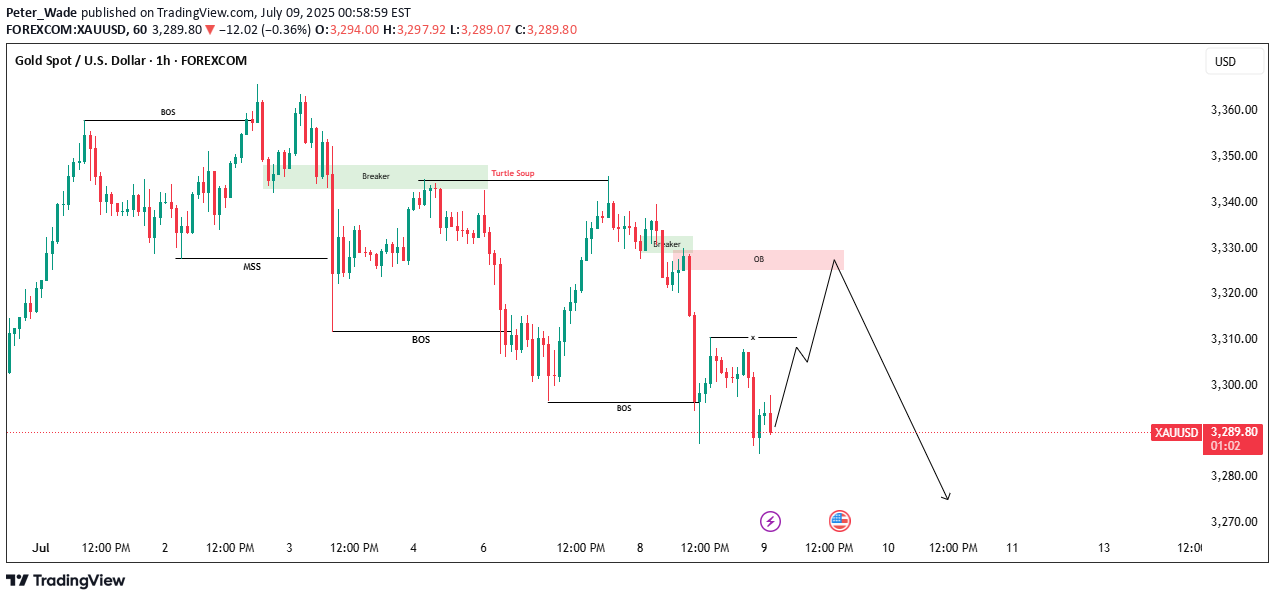
Market Structure Break & Bearish Reaction from Supply Zone.
🔍 GOLD – Market Structure Break & Bearish Reaction from Supply ZoneGold has recently broken its market structure (MSS), which is a significant shift in momentum and a potential indication of a change in the prevailing trend. Following this break, price retraced into a key supply zone, where it was rejected sharply—this rejection came in the form of a strong bearish engulfing candle, highlighting aggressive selling interest.Interestingly, the market has now printed a second consecutive bearish engulfing from the same zone. This is a powerful signal that sellers are active and defending this level, making it a valid and confirmed short-term resistance zone. The repeated rejection suggests that smart money or institutional sellers may be positioned here.Given this price action, we can anticipate a potential retracement from the current levels. The most probable downside target for this retracement would be the Fair Value Gap (FVG) that has been marked on the chart. If price respects the FVG and reacts bullishly from there, we may then see a resumption of the uptrend, possibly taking price higher again.This setup presents a good opportunity for both short-term intraday traders and swing traders to watch for confirmation signals before entering the trade.📌 Key Takeaways:MSS indicates shift in trendConsecutive bearish engulfing candles from supply zoneSellers likely active in this areaPotential retracement toward marked FVGPossible bullish continuation from FVG zone🚨 As always, Do Your Own Research (DYOR) and manage your risk accordingly before making any trading decisions.
There’s a higher probability of an upward breakout.
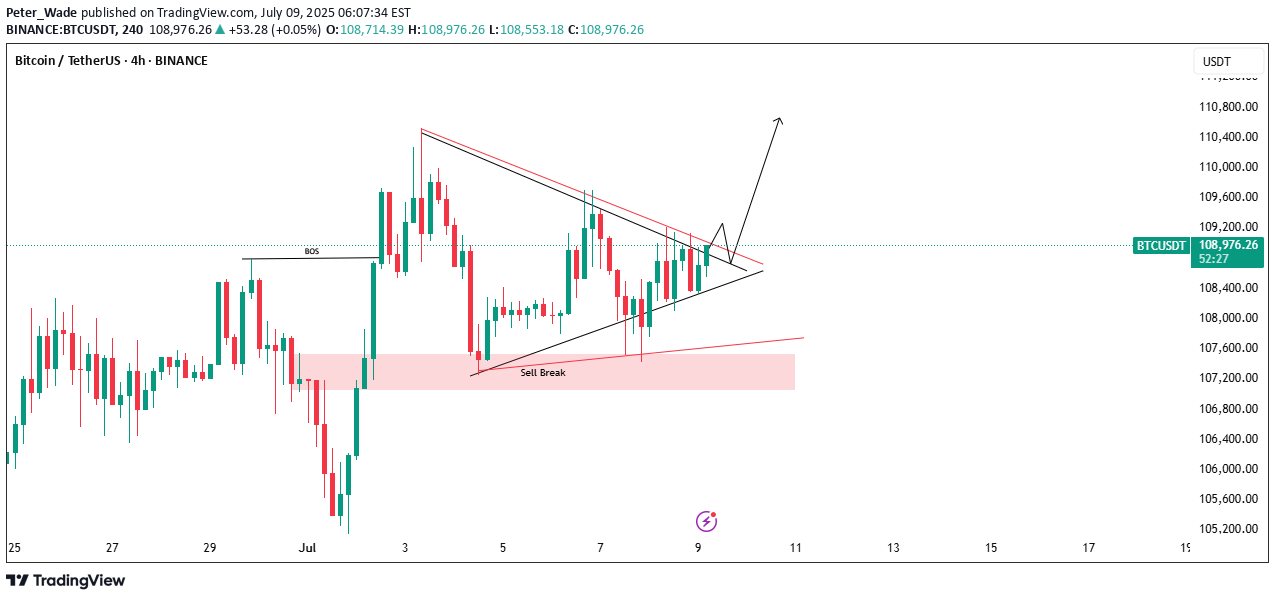
🚨 Bitcoin Technical Update – Key Levels Ahead! 🚨Bitcoin is currently forming a symmetrical triangle pattern, a classic setup that often signals a strong move ahead. At the moment, the market is leaning toward the upside, showing early signs of bullish momentum.📈 If we see a breakout to the upside, it's crucial to wait for a retest of the breakout level. A successful retest could confirm the move, setting the stage for a strong upward rally. However, if the breakout fails, don’t rush in — just observe the price action closely to see how the market reacts.⚖️ There’s a higher probability of an upward breakout, as liquidity is still building above, and there are strong support levels holding below. This combination could act as a springboard for price to move higher.🔍 As always, Do Your Own Research (DYOR) before entering any trade. Stay alert and manage your risk wisely!
A High-Probability Play Unfolding!
🌟 GOLD MARKET OUTLOOK – A High-Probability Play Unfolding! 🟡📉Gold was riding a solid uptrend recently, showing strength across the board. But over the past few days, things have started to shift. We've seen a clear Market Structure Shift (MSS) followed by a Break of Structure (BOS) to the downside — signaling the start of a short-term bearish trend.📍 What’s Happening Now?Gold is currently trading lower after the BOS, but the market is now approaching a critical phase...We’re expecting a retracement move to the upside — a temporary pullback that could trap early buyers (this is called inducement). This is where things get interesting!🎯 What to Watch For:Once the retracement plays out, we’ll be watching closely for:🔻 Bearish Fair Value Gaps (FVGs)🔻 Supply Zone Order BlocksThese areas could offer us high-probability sell entries aligned with the overall bearish momentum.📉 The Target?We’ll be aiming for the previous swing low, where liquidity is likely resting — a classic price magnet in such setups.⚠️ Be Patient. Let the Market Come to You.Wait for the retracement, let price fill the gaps, and only then look for confirmation to enter. Rushing in now means going against smart money flow.🧠 DYOR – Do Your Own Research!This is a market roadmap, not a signal.
Disclaimer
Any content and materials included in Sahmeto's website and official communication channels are a compilation of personal opinions and analyses and are not binding. They do not constitute any recommendation for buying, selling, entering or exiting the stock market and cryptocurrency market. Also, all news and analyses included in the website and channels are merely republished information from official and unofficial domestic and foreign sources, and it is obvious that users of the said content are responsible for following up and ensuring the authenticity and accuracy of the materials. Therefore, while disclaiming responsibility, it is declared that the responsibility for any decision-making, action, and potential profit and loss in the capital market and cryptocurrency market lies with the trader.