
PersaGold
@t_PersaGold
What symbols does the trader recommend buying?
Purchase History
پیام های تریدر
Filter
Signal Type

PersaGold
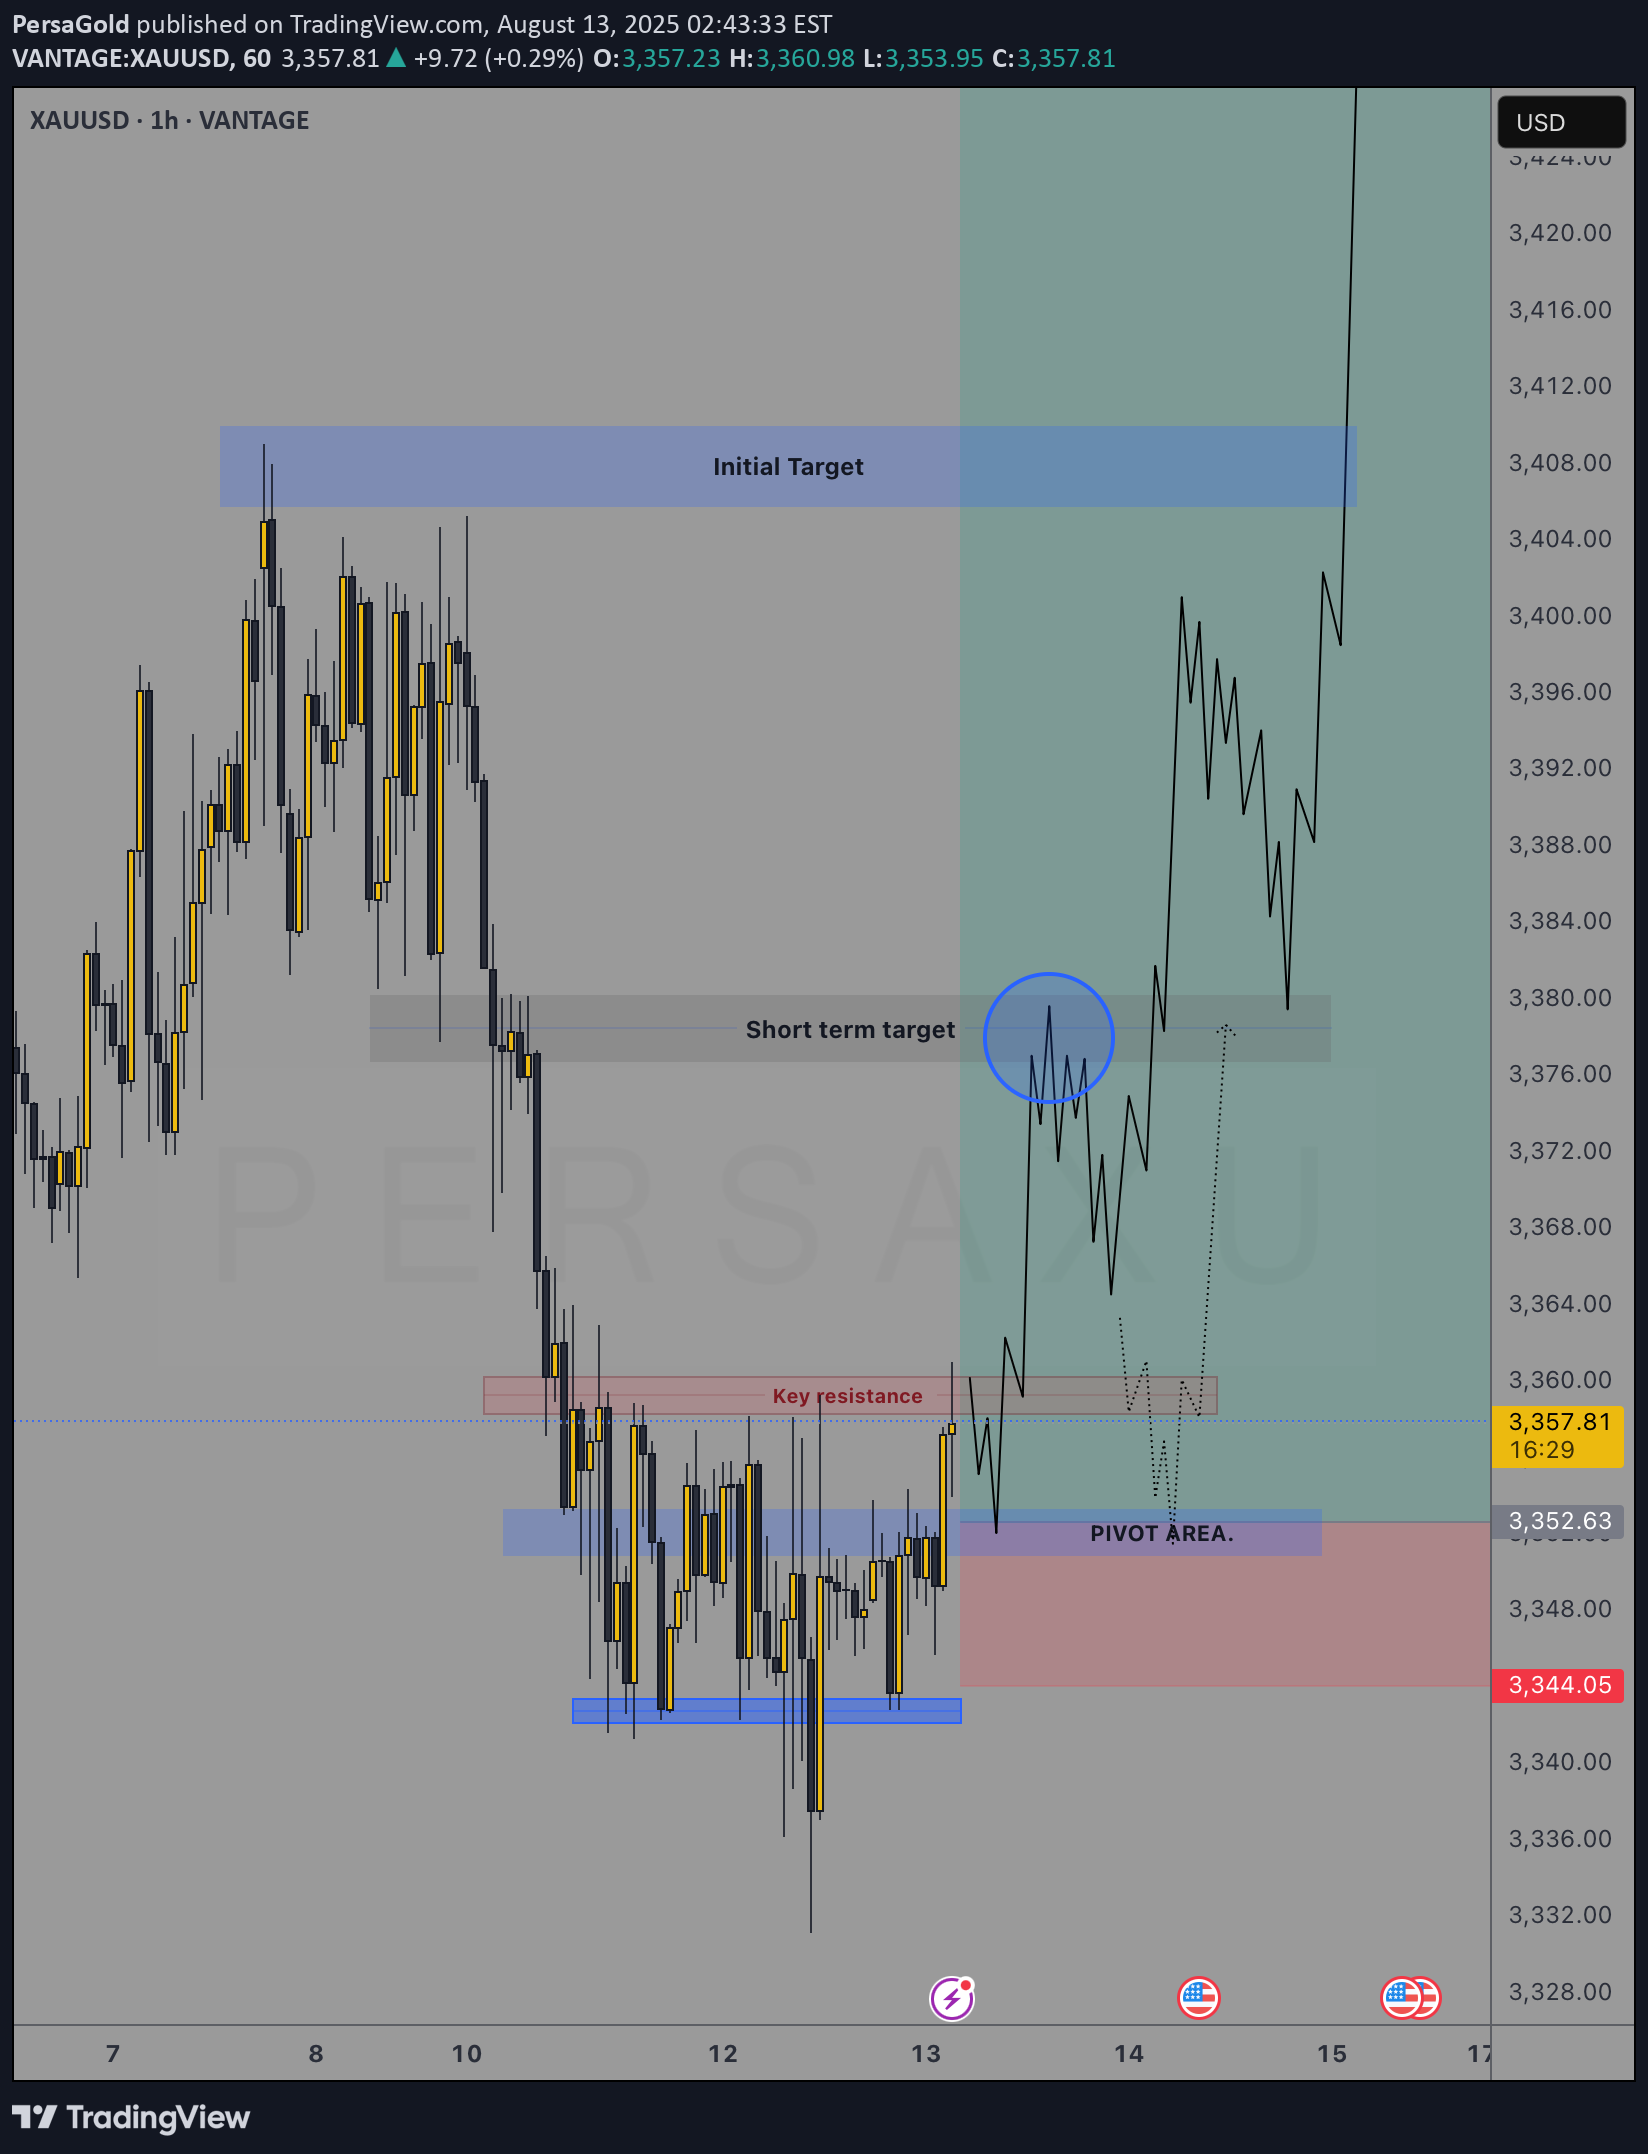
Illustrated is a potential entry for a swing opportunity to target ATH, at least 3400 - 3500 NY’s manipulation on Tuesday was a key price action that shows intentions of retesting 3400. — GOOD LUCKBOUGHT AT 3353.00 First position in. 3352 - 3350 as re-entry area.

PersaGold
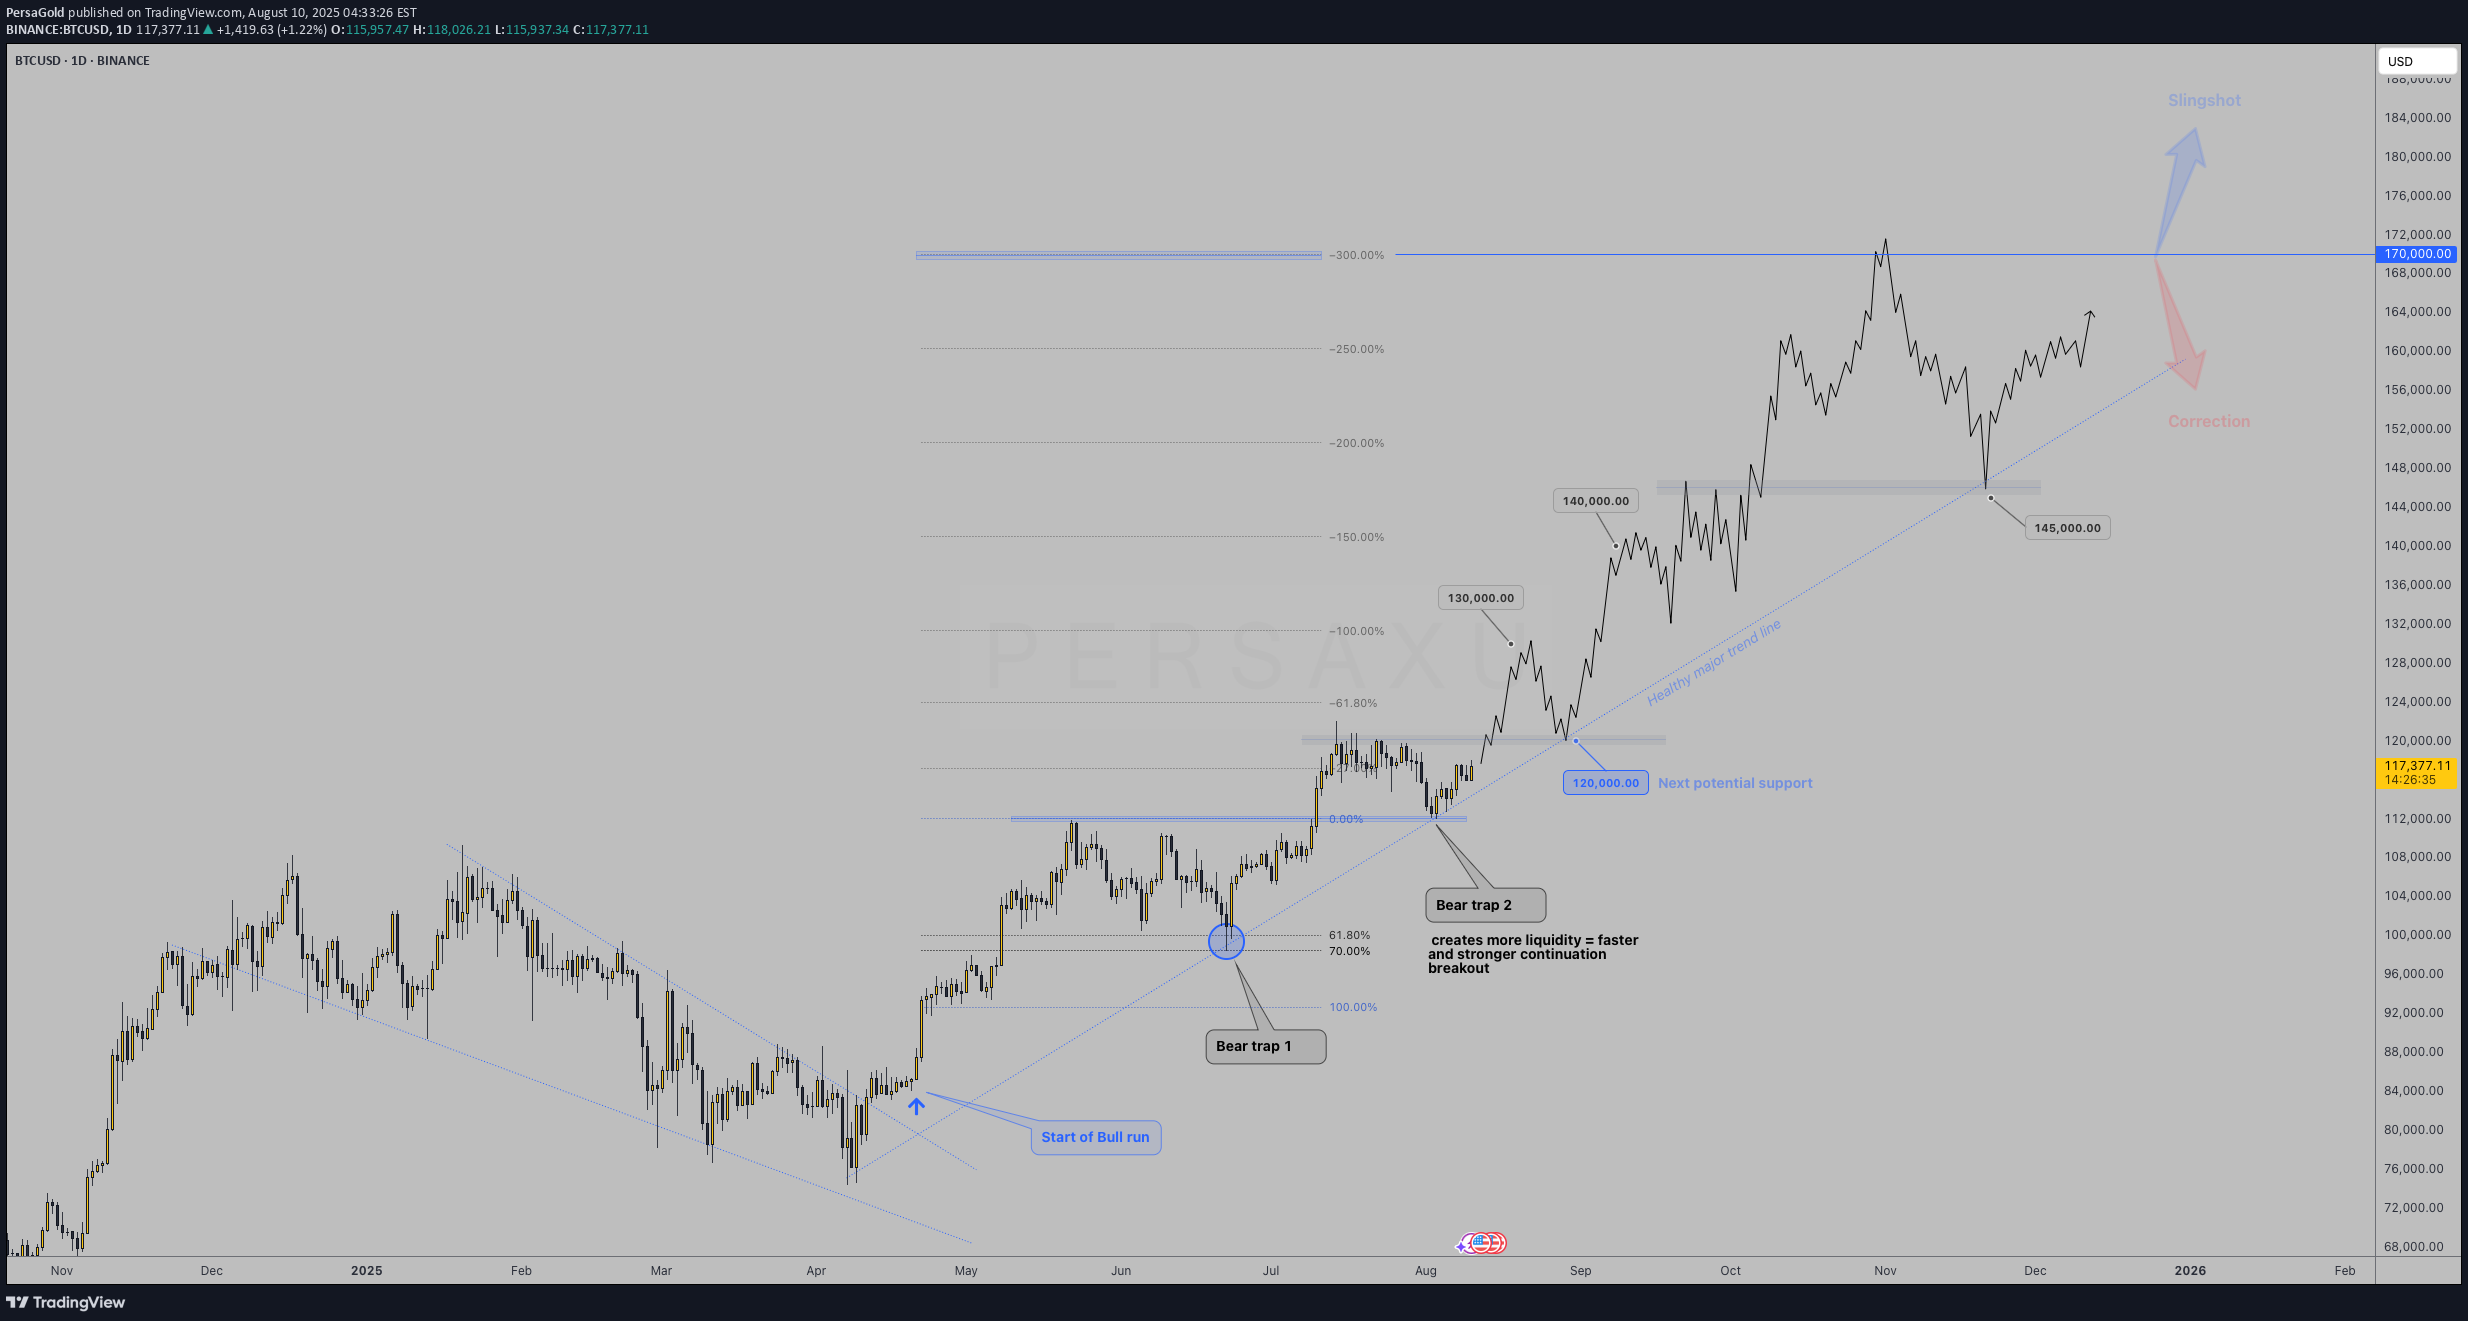
An update from my latest BTC projection to 140K. Seeing the current market structure and price action, I can start visualizing potential extensions above 140K, reaching 165-170K. As illustrated, some key price action behavior that has occurred that supports the idea of a further bull run. An initial bear trap following by a second one creating even more liquidity which the market will likely target faster and stronger as people go against the trend. Fundamentals keep adding fuel to BTC... US opening up more and more at an institutional level, adding BTC to citizen's 401k's; El Salvador is very likely to be the first country in the world to open a BTC ONLY BANK.. offering private financial services nominated ONLY in BTC; And the list goes on... - Of course, one can't fall in love with the idea and must adapt in case price action shows otherwise... the possibility for a correction to 60K is open, although more and more unlikely as price nears ATH and respects bullish structure. ... GOOD LUCK persaxu.

PersaGold
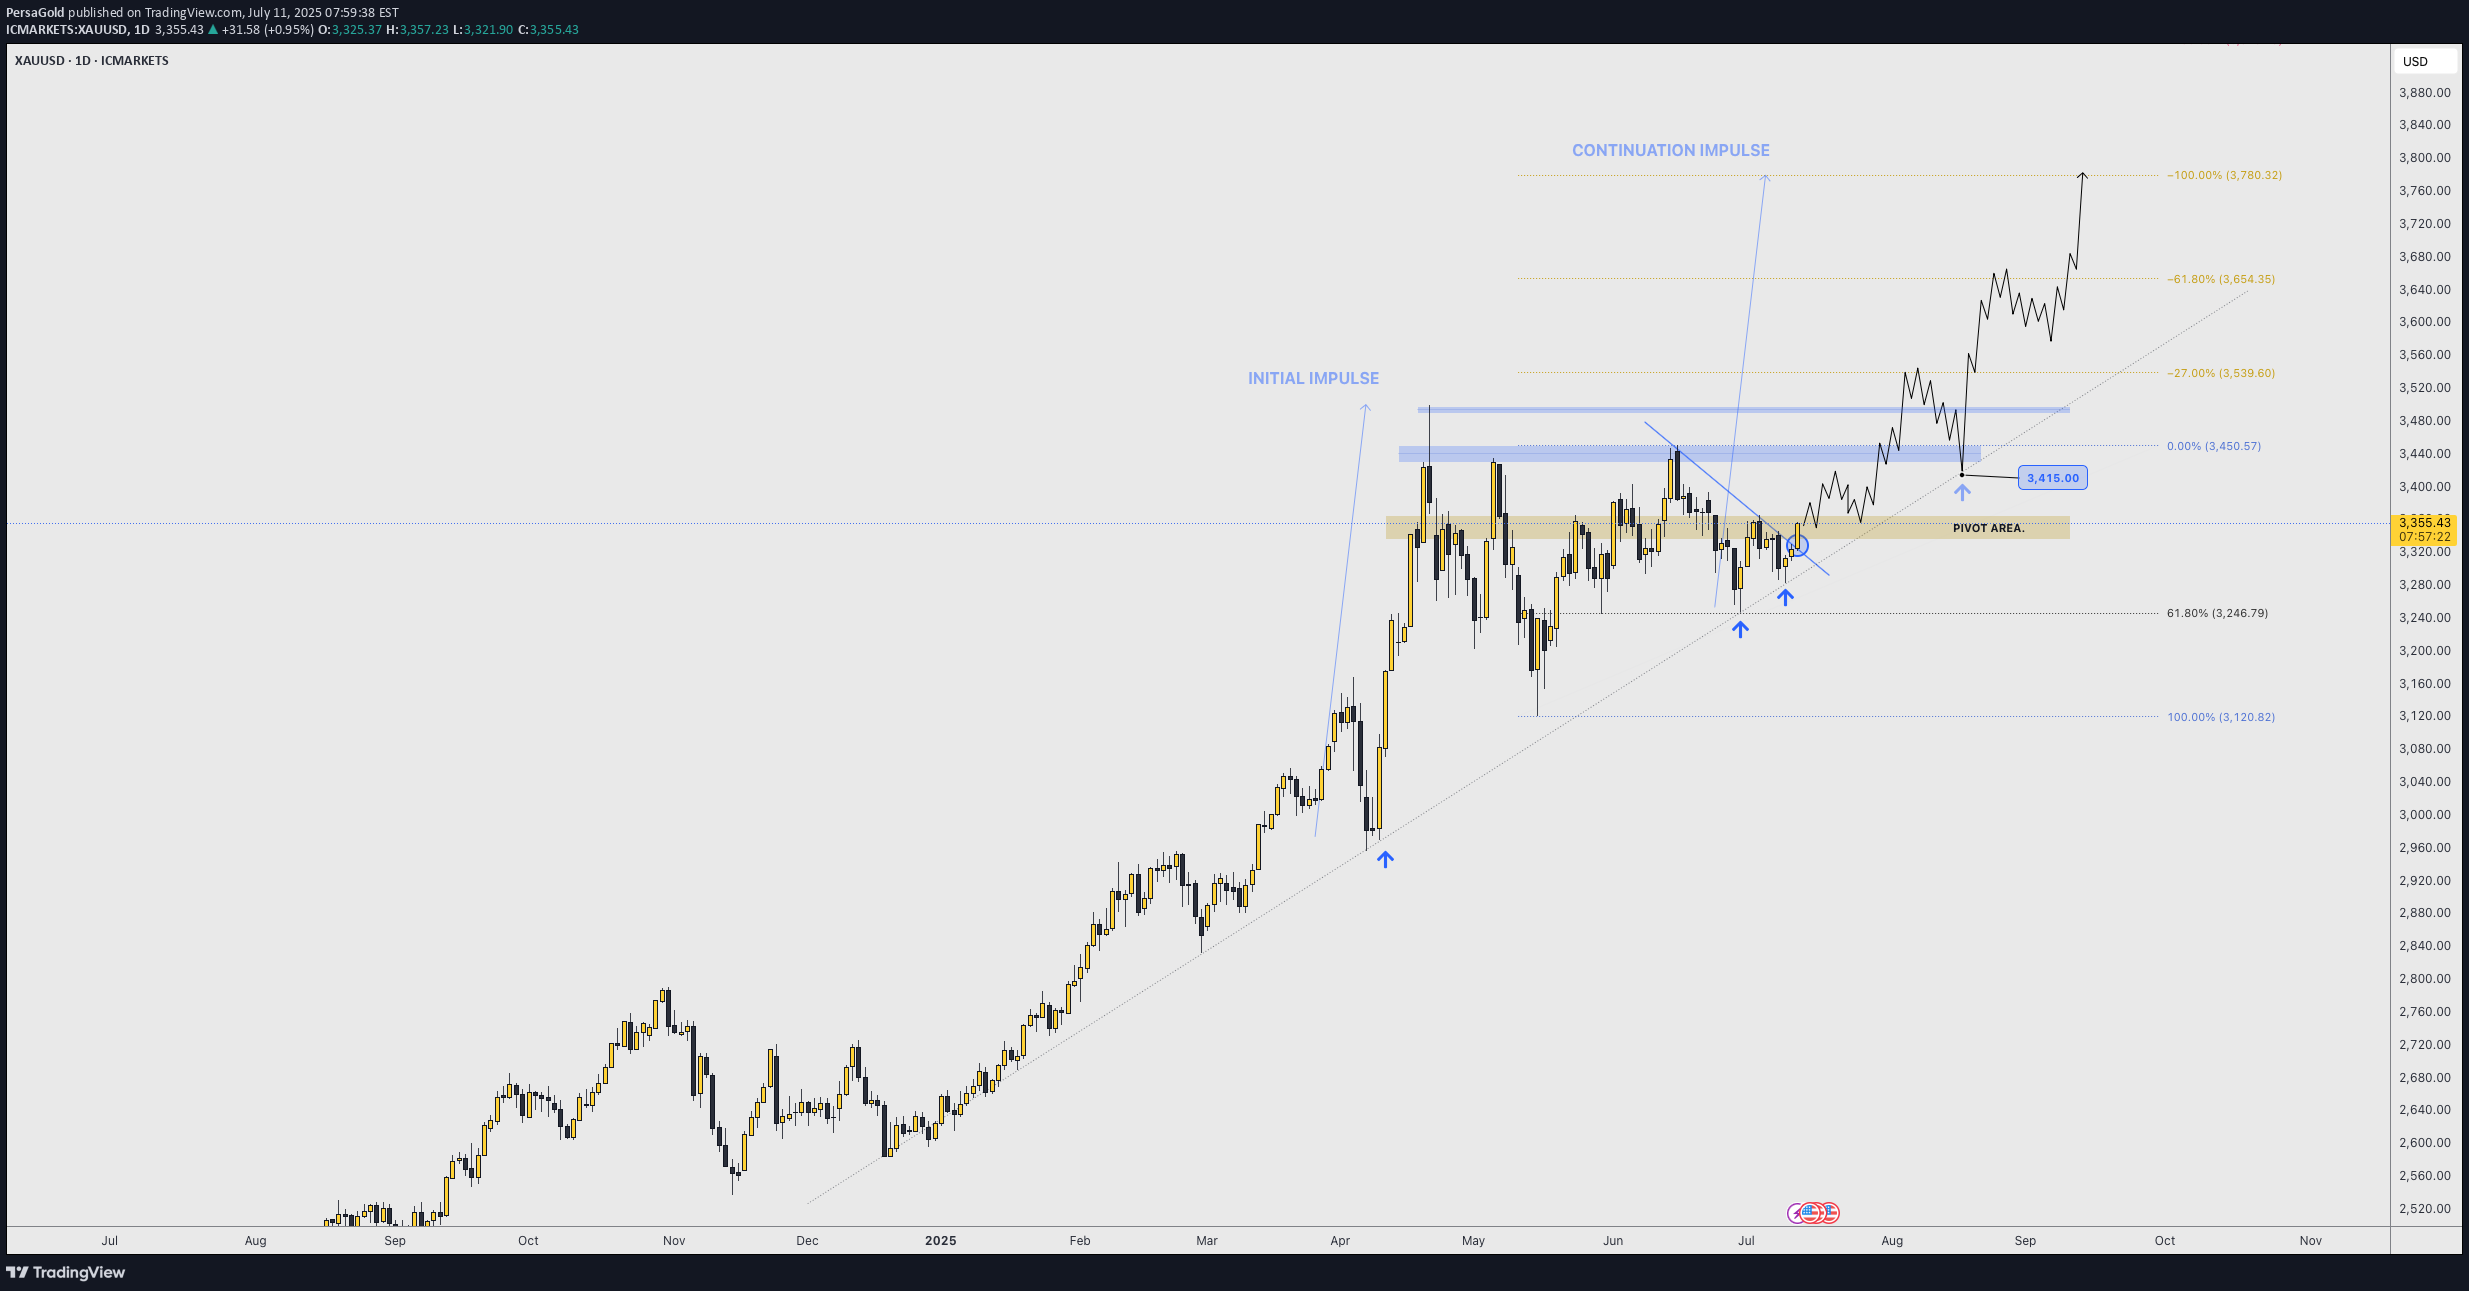
As illustrated, I'm trying to visualize how a potential continuation impulse could look like during "Bullish July" and toward the end of the year (depending on how aggressive buyers step in; specially central banks and institutions). As you can see in this Daily chart, price respected a long term trend line + is forming higher lows, funneling into a shorter and shorter range of accumulation. This is a very strong bullish behavior; when price gets tighter and tighter respecting a resistance level, but making higher lows. It tends to indicate that price is accumulating and "loading" (sort of speak). Now, analyzing gold from the fundamental aspect, one MUST align those factors with price. In other words: DOES IT MAKE SENSE TO BE BULLISH OR "THINK" PRICE COULD RISE? Well, ask yourself and do the research on the following (but not limited to) questions: 1. How is the US dollar doing? 2. Are the interest rates in the USA favoring the economy? 3. How is the world economy as a whole doing? - inflation in the top world powers and important economies? 4. How is international trade policy looking like for the world? - Positive or negative? Are countries happy with each other currently, trading without any issues? (Or maybe... there's a tariff war and a trade war goin on?...) 5. Politically speaking, is the general public UNITED or POLARIZED? (politics is a key fundamental aspect for the price of gold, as it either adds to uncertainty and tensions, or it calms things down). 6. Where is the money going and flowing? Black rock, vanguard, and other top hedge funds; where are they investing their money? ( because central banks keep BUYING gold... ) Those are some of many many questions one must study and understand, in order to align the technical aspects of the price of the yellow metal. If any question/factor DOES NOT POINT to bullishness in price, then the technical and price projection of any analysis starts to have weakness. On the other hand, if the fundamental factors and questions in play INDEED POINT toward an uncertain situation, adding bullishness to the price, any analysis and bullish projection simply has those aspects to its favor. -- GOOD LUCK! persaxu

PersaGold
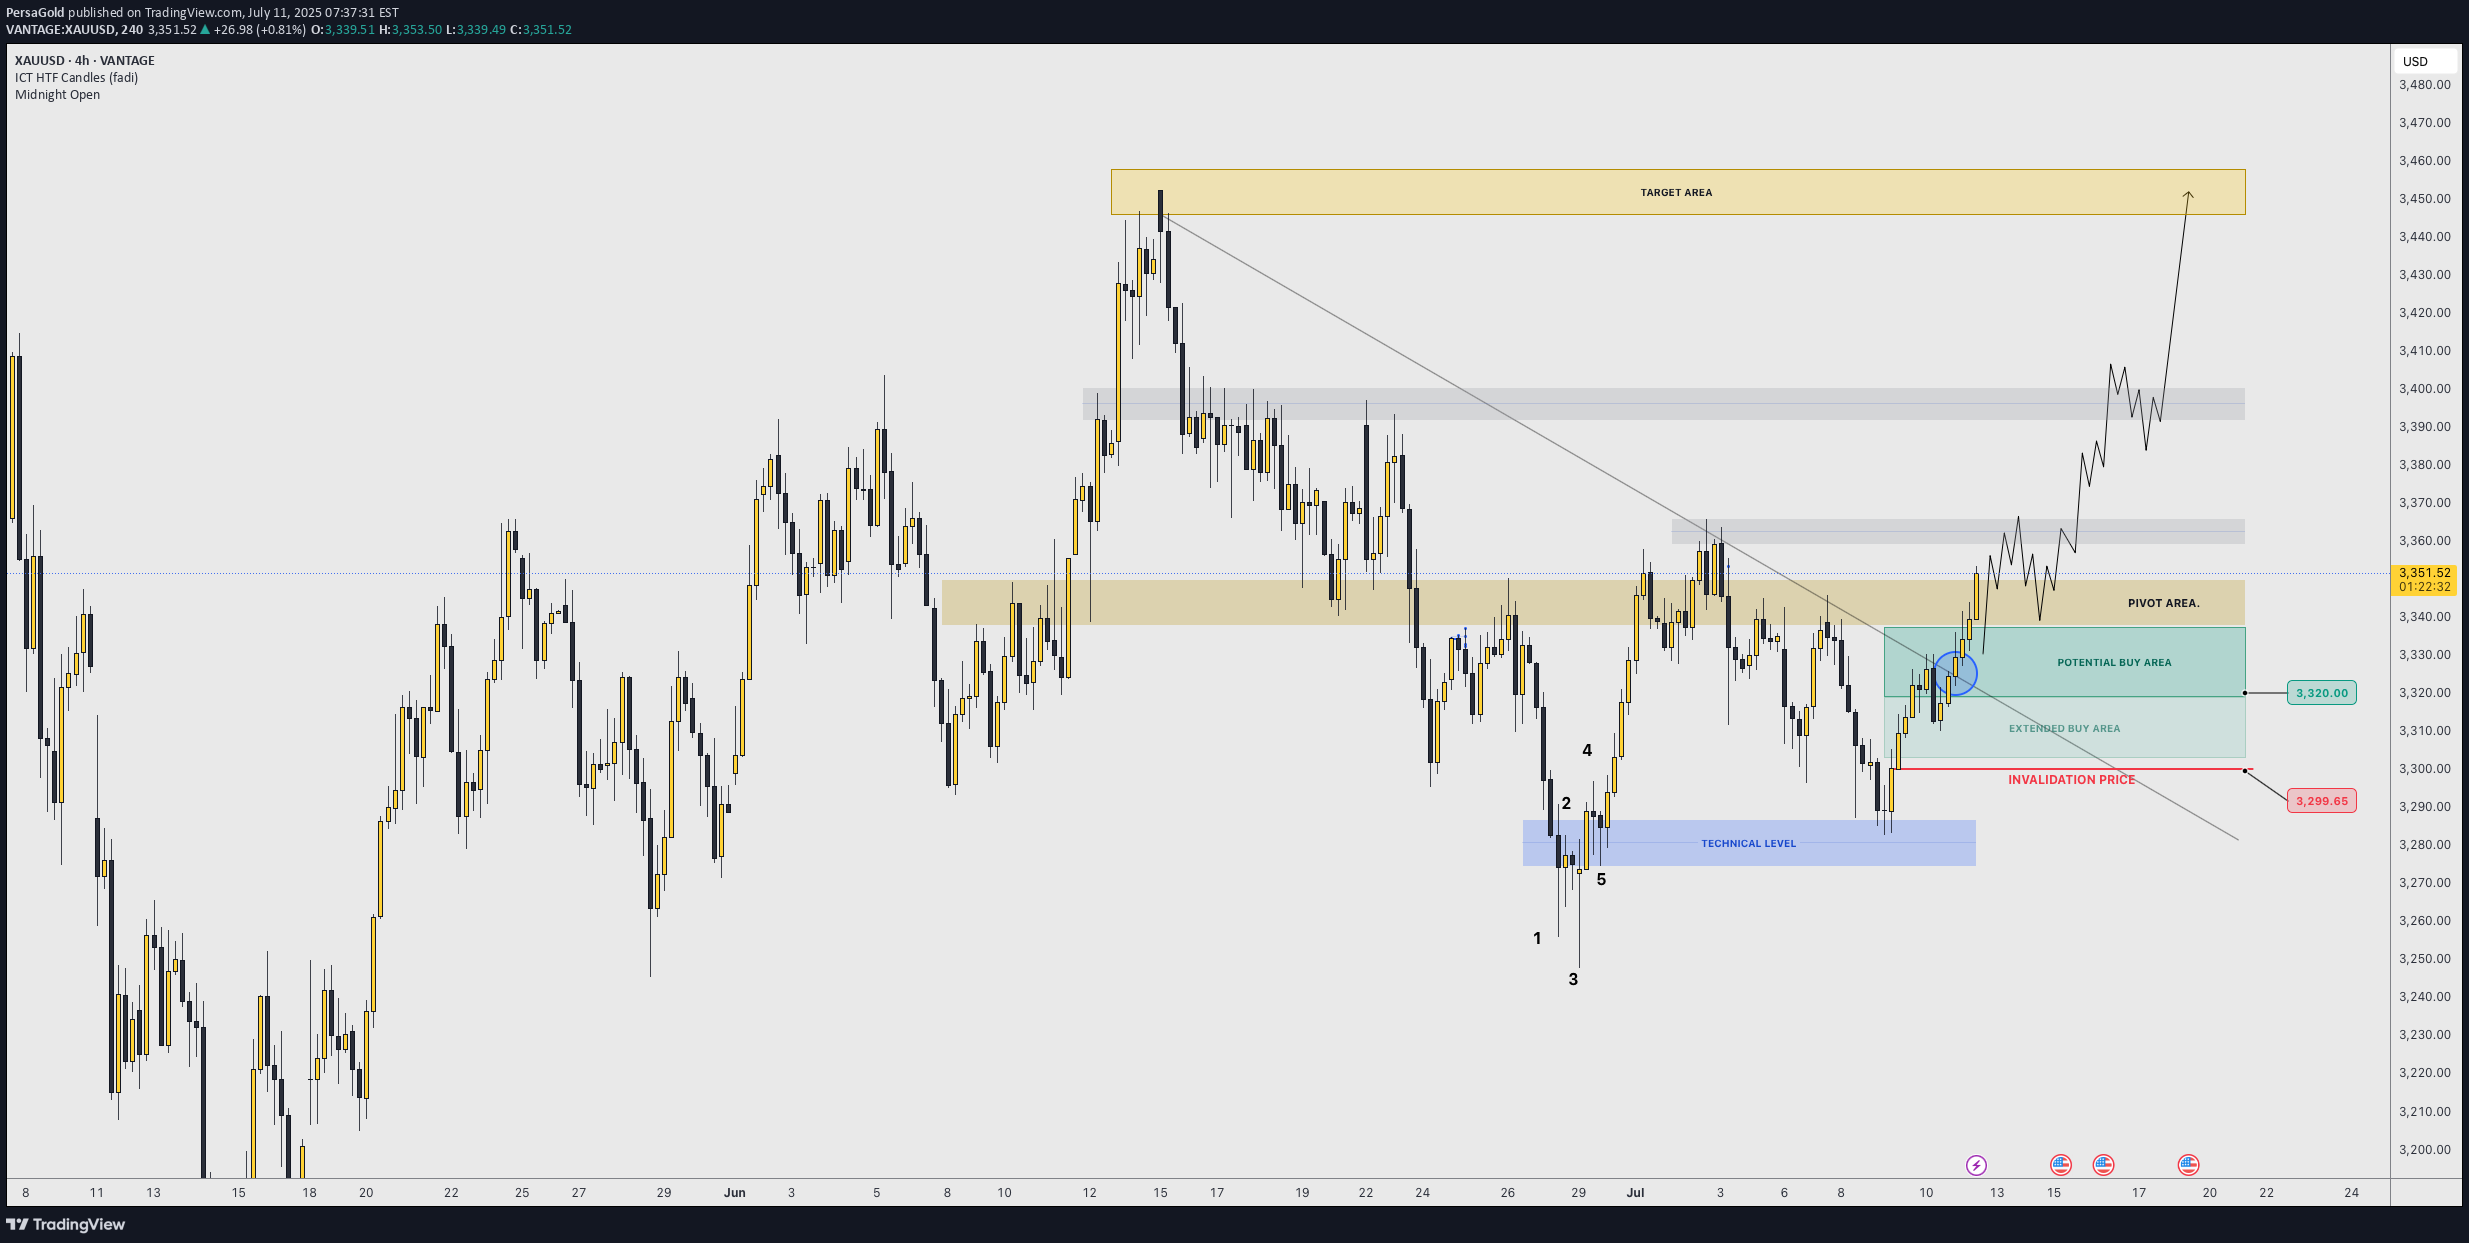
As illustrated, I try to visualize what the next bullish impulse could look like if price holds 3300 as a key psychological and algorithmic price level. Illustrated are the potential buy areas (a current one and an extended one in case a pullback occurs to manipulate lower levels in the next 24-48 hours). This projection, if valid, could hold from now until next week, so it can be considered a swing trade to hold at least the next week and into the following one). -- After this post, I will upload another analysis on the Daily timeframe projecting the longer term move, so make sure to go in my profile to check it out. GOOD LUCKStrong bounce just shy from 3320, within buy area. Initial signs of confirmation to the upside. I am in this trade with long positions.

PersaGold
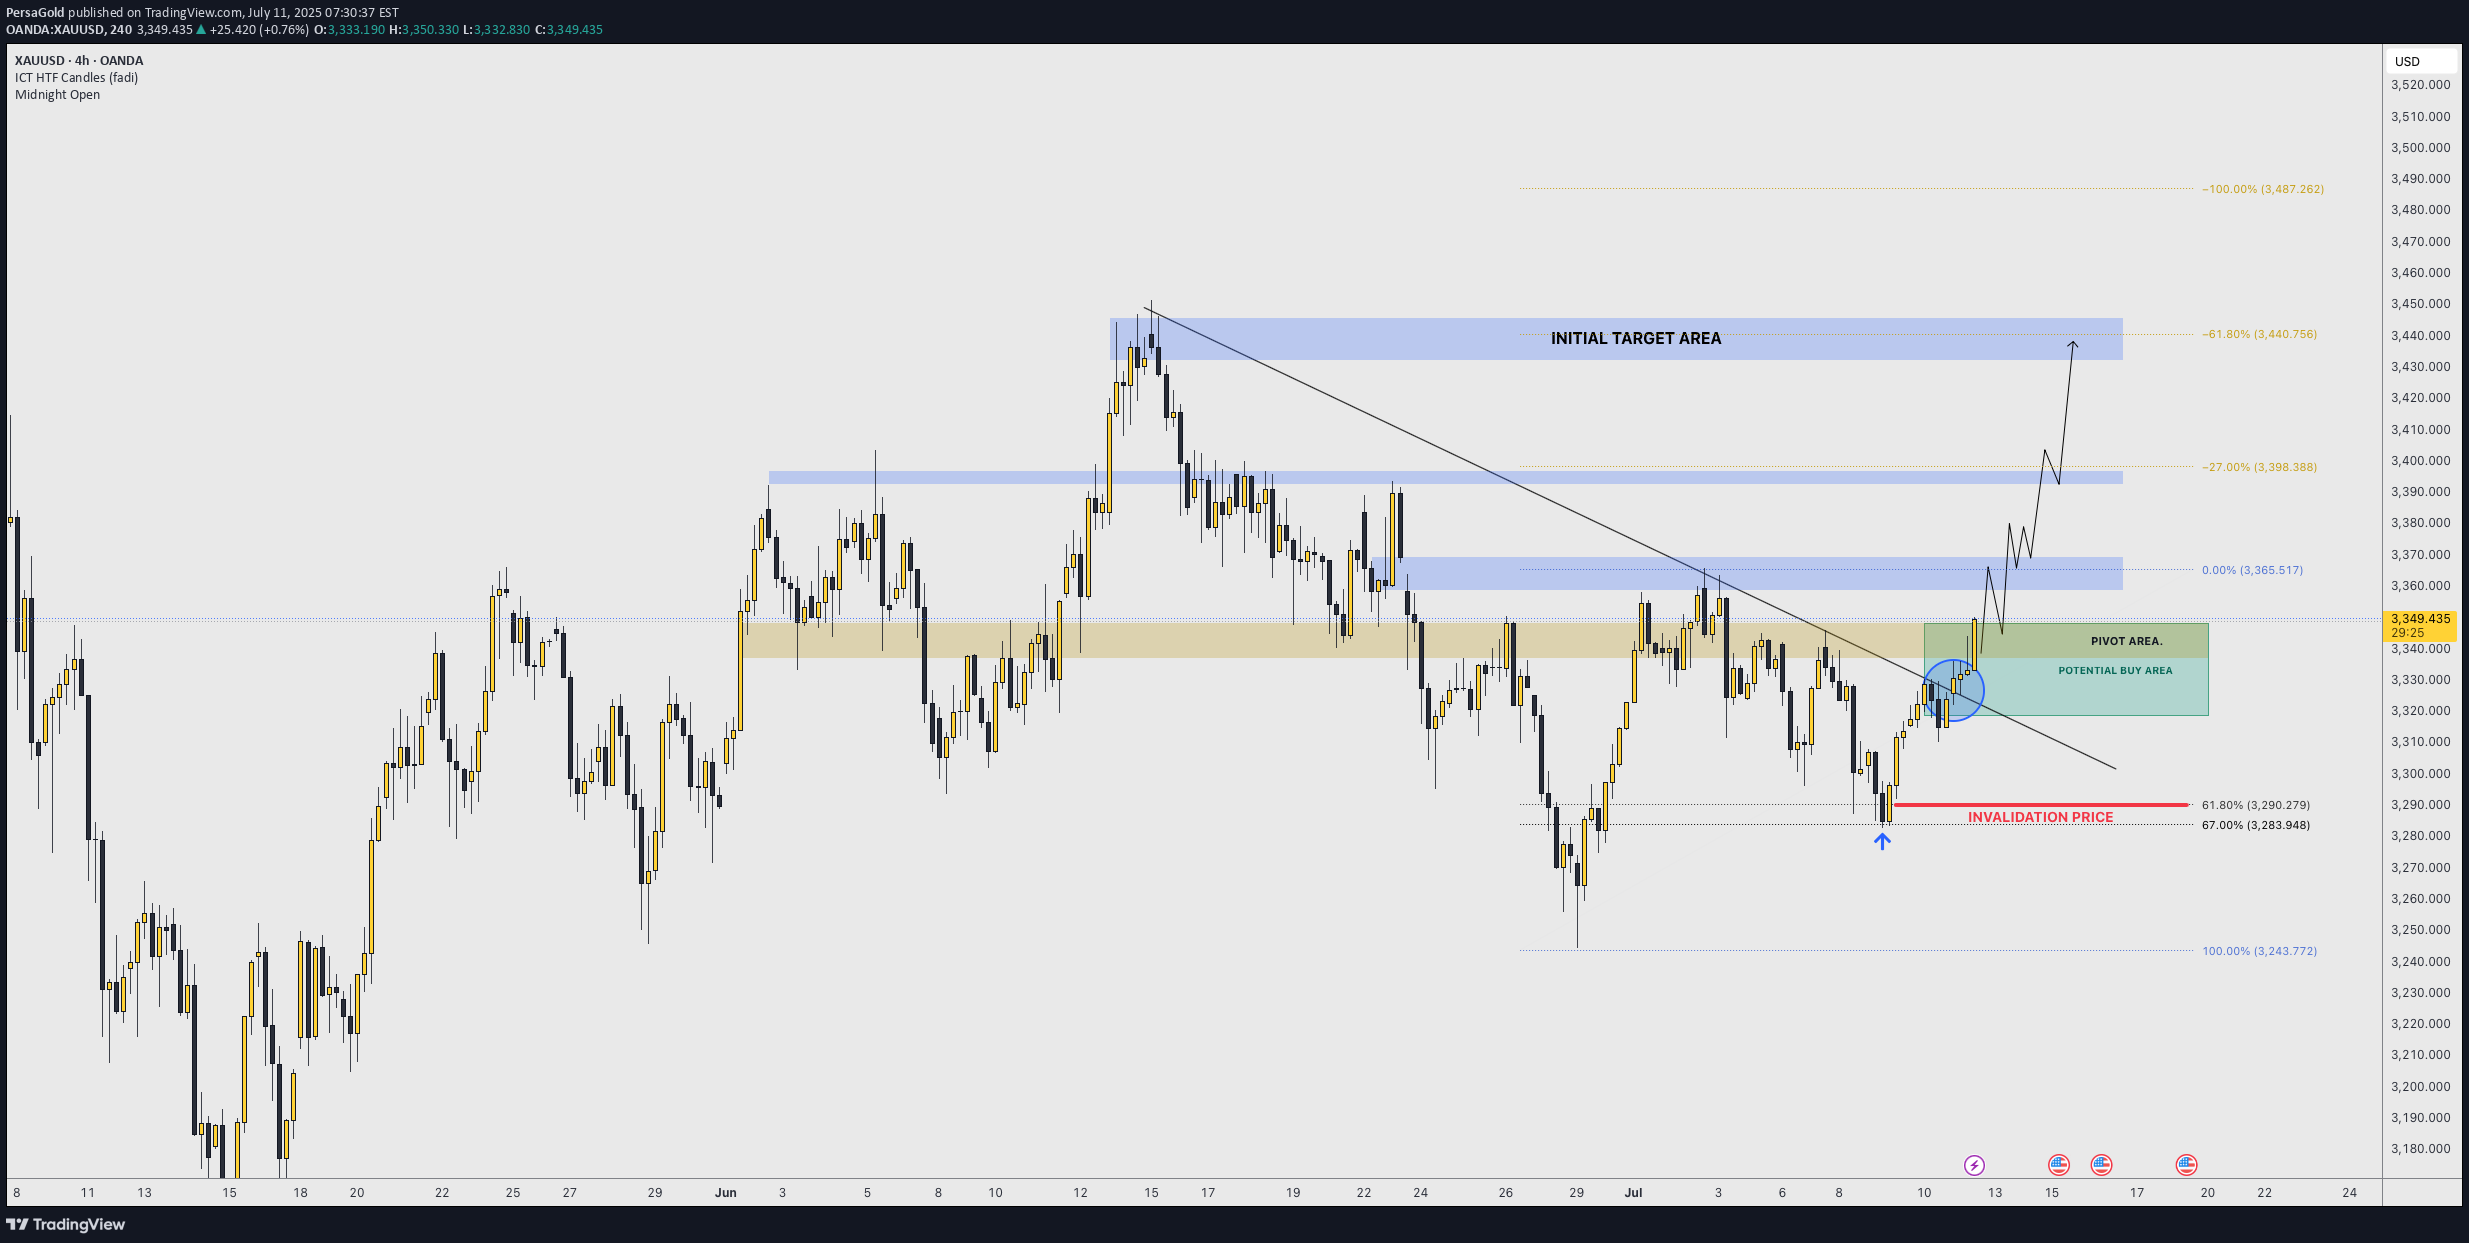
As illustrated, price has broken out of an important 4H and 1D trend line that had kept price bearish since the beginning of the month. Yesterday, gold made its way to a ket resistance level and broke it, CLOSING above it in the 4H timeframe, which is a key sign that bulls are back. An interesting sign is that price bounced from the 61.8 - 67% retracement of the last bullish impulse that had an extended correction. Should price manage to stay above 3250-3300 next week, , (a very strong psychological and algorithmic price range), the path to a new ATH is well opened and the probabilities arise on its favor. I try to visualize a potential buy area shown in green, and the invalidation of this idea would be the level from which price has bounced. -- I have been bullish on gold since 2023, ignoring any correction to be a "bearish market" and rather accumulation phases of longer term potential for growth. The world economy and geopolitical conflict along many other financial macroeconomic data and circumstances, are simply NOT pointing toward a better future, and gold is screaming so by continuing to rise, and central banks back this up by continuing to buy it physically. -- GOOD LUCK

PersaGold
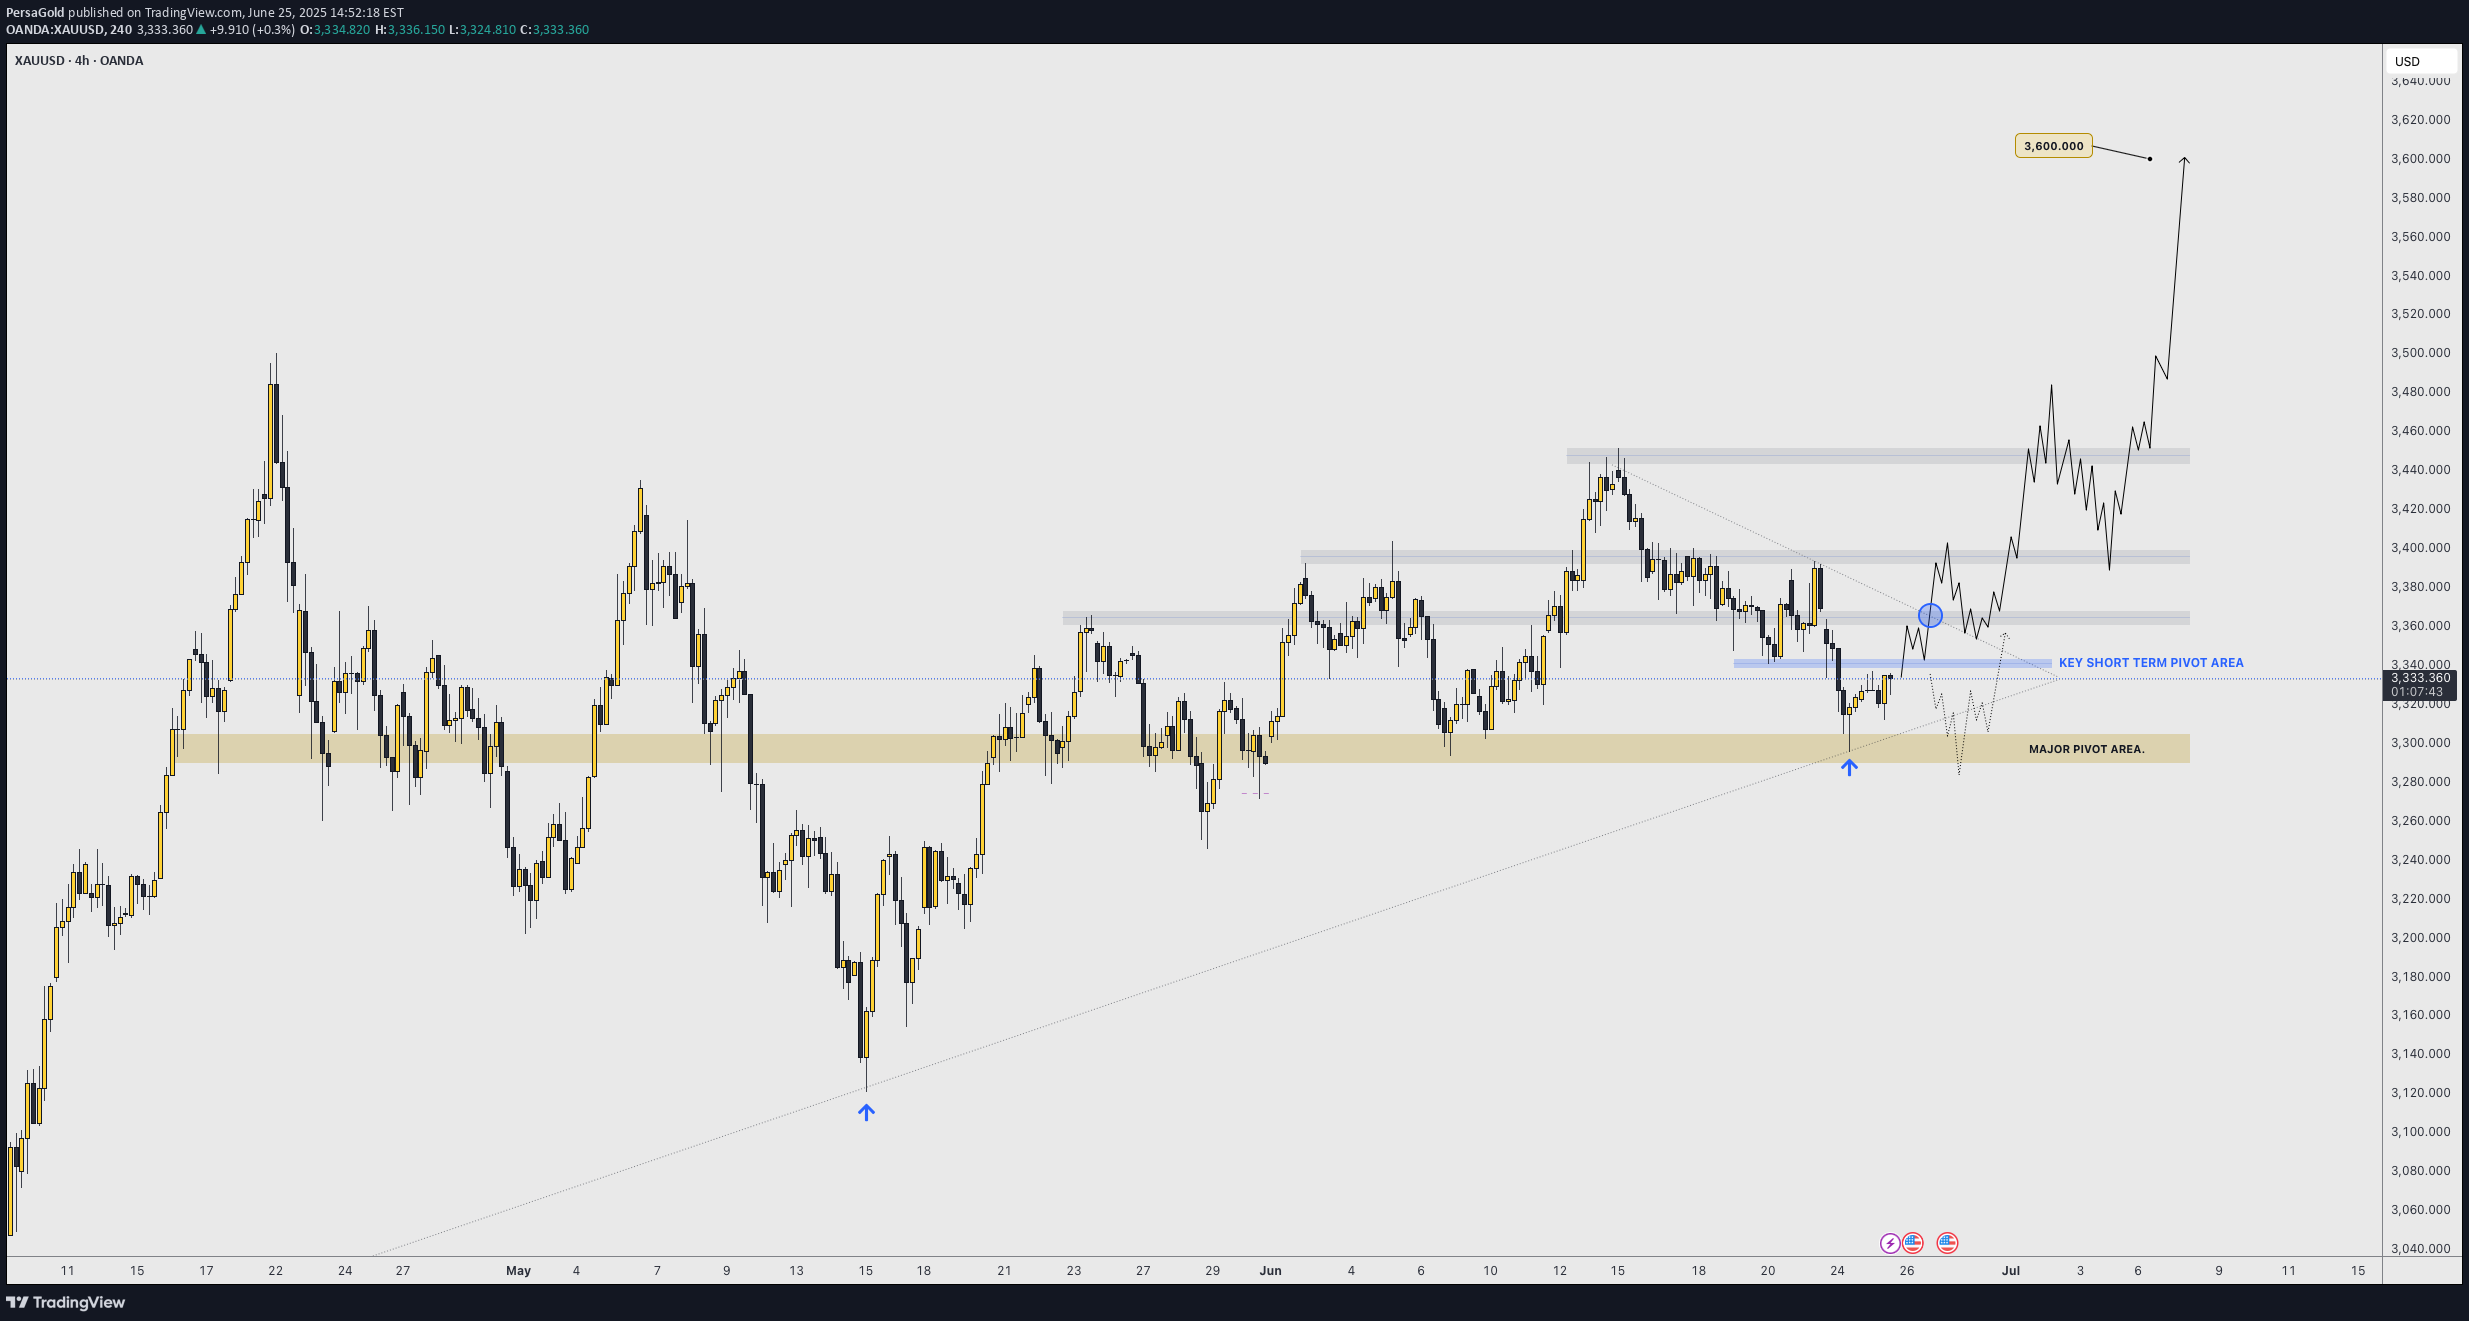
As illustrated, Im trying to visualize what a potential bull run could look like starting from what seems to be a "bullish signature" move by gold: a diagonal double bottom.Don't believe me; go back in time and study how gold makes bottoms and how new bull runs start. The fact that it was NY that manipulated BOTH times and got the best price, is a strong footprint that MIGHT just indicate a potential bottom (at least of this current bearish correction.I won't say "this is it" and ATH are next FROM this potential rebound; HOWEVER, it could indicate at least the next 10 to 24 hours of potential bullish impulse to retest a degree of the bearish drop since Sunday's weekly open.Hammer candle from Tuesday's NY session low + today's 4H bullish engulfing, are also powerful components that show bullish strength indicating 3300 to be a major support area.I'm expecting (BUT NOT ADVISING) Asia to break aggressively to the upside confirming that this could have been this current correction's bottom, and/or at least this week's low.Should Thursday close above Tuesday's high or consolidating near it, also shows signs of bullish strength and opens the door for Friday to make a second bullish impulse move.This would reflect on the Weekly candle leaving a long rejection wick and closing (potentially) back above 3350 - 3360.Should this be the case, the following week would have the road paved to lift off price to retest previous 4H highs of 3440 - 3450 range....July is a bullish month historically. Don't believe me; search "seasonality tool, gold" and see it for yourself.It is a matter of weeks for Gold to breakout of this wide accumulation phase it has been since end of April, and start a fresh and brand new bull run that could/should last until the end of the year.-GOOD LUCKPersa

PersaGold
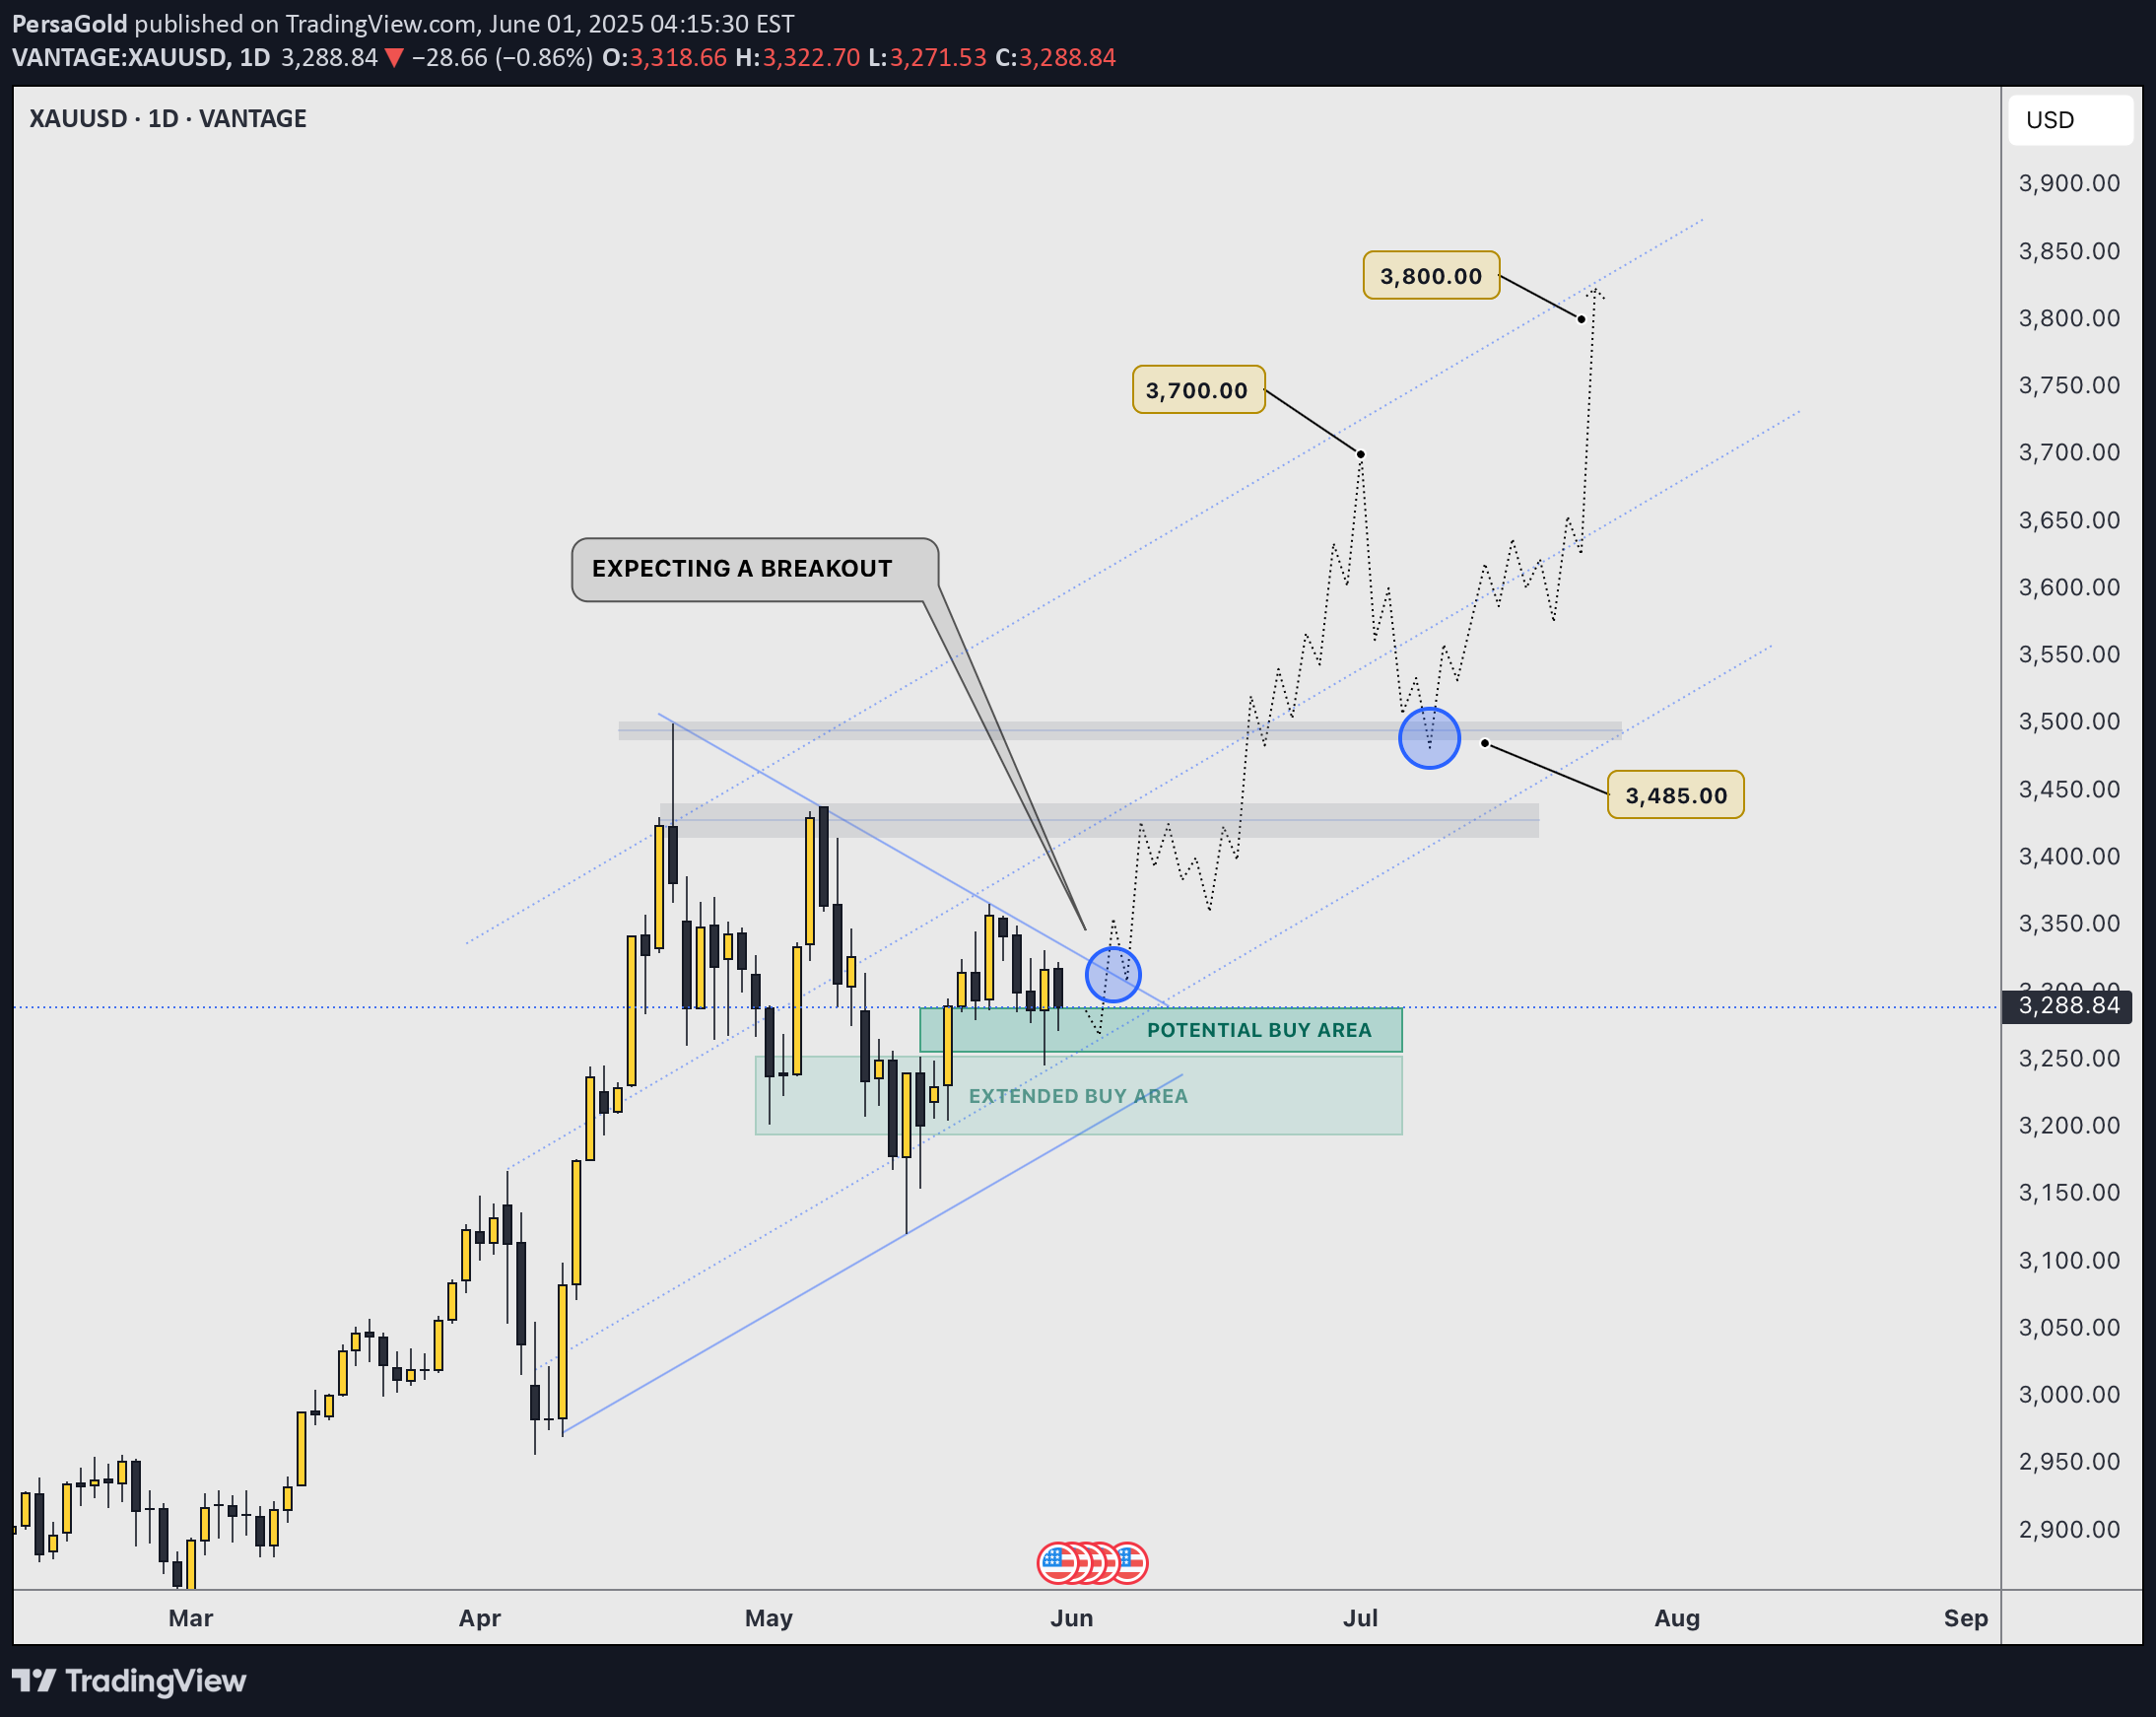
As illustrated, I’m visualising the next potential bullish continuation impulse that would take gold near the $4000 projected price.In this idea, the path projected is based on the breakout of a rising symmetrical triangle that price formed; a strong bullish pattern that tends to be very effective when price successfully breaks out with strength.On a fundamental aspect, things continue to hold the yellow metal on a positive route to maintain its bullish momentum and direction. Fed rates decision is getting close, and that is just the tip of the iceberg that’s going to move gold to record highs within weeks.A key and major pivot area is near the $3200 - $3250 price range; so it’s possible we have one more attempt to break $3200. —GOOD LUCKpersaxu--With an apparent "cease fire" between Iran-Israel, gold has starting to make a bearish discount move. I personally don't believe this to be anything but market manipulation to get price cheaper for a longer time buy, simply because ONE single news or event from ONE single "conflict" , DOES NOT take away or erase all the other problems that the US and the world are in... My first personal re-entry zone: 3275 / 3270 Extended re-entry zone: 3255 - 3235

PersaGold
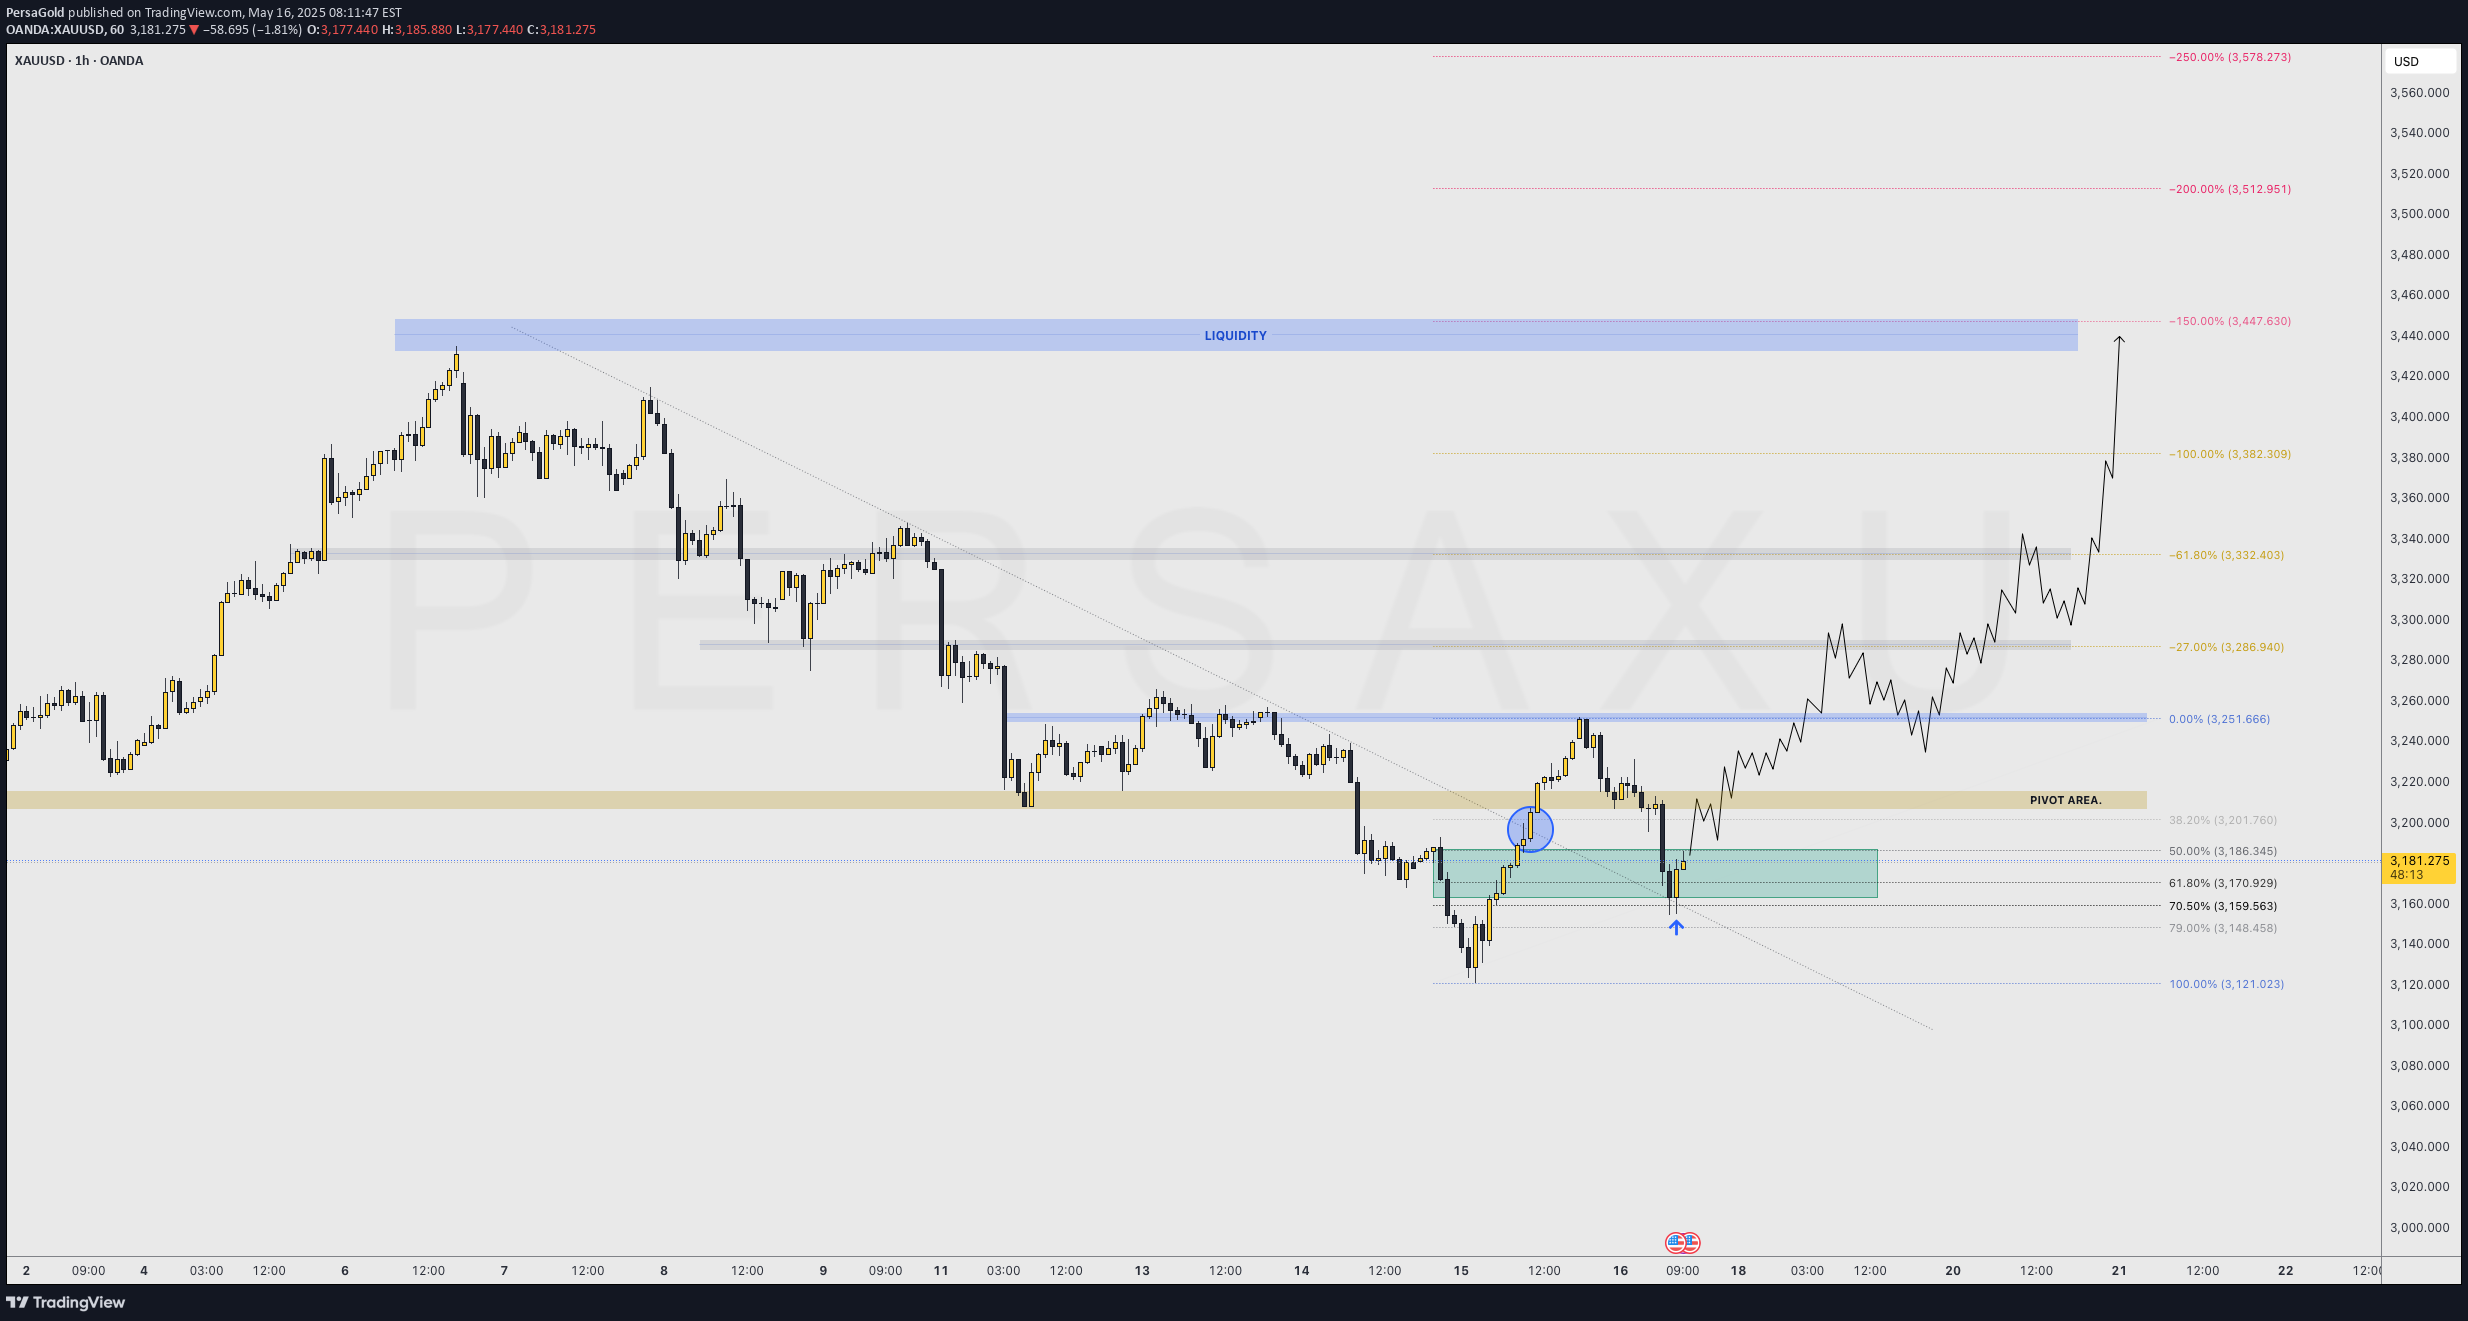
As illustrated, Im trying to visualize the beginning of the next impulse toward $4,000 This is an intraday - swing trade opportunity to 1H highs; however, it would be just the first move toward a longer term path to ATH above $3,500 Ride this wave as you can, but know that the yellow metal still has a lot of strength and power to continue growing. June might still behave strangely as it is a consolidation month on average 5-10-15 years; however, It wouldn't surprise me if market structure holds important support prices instead of ranging back below $3,200 - $3,150 ; in other words, that range might be strong longterm support. --GOOD LUCK! SECURE PROFITS. persaxu

PersaGold
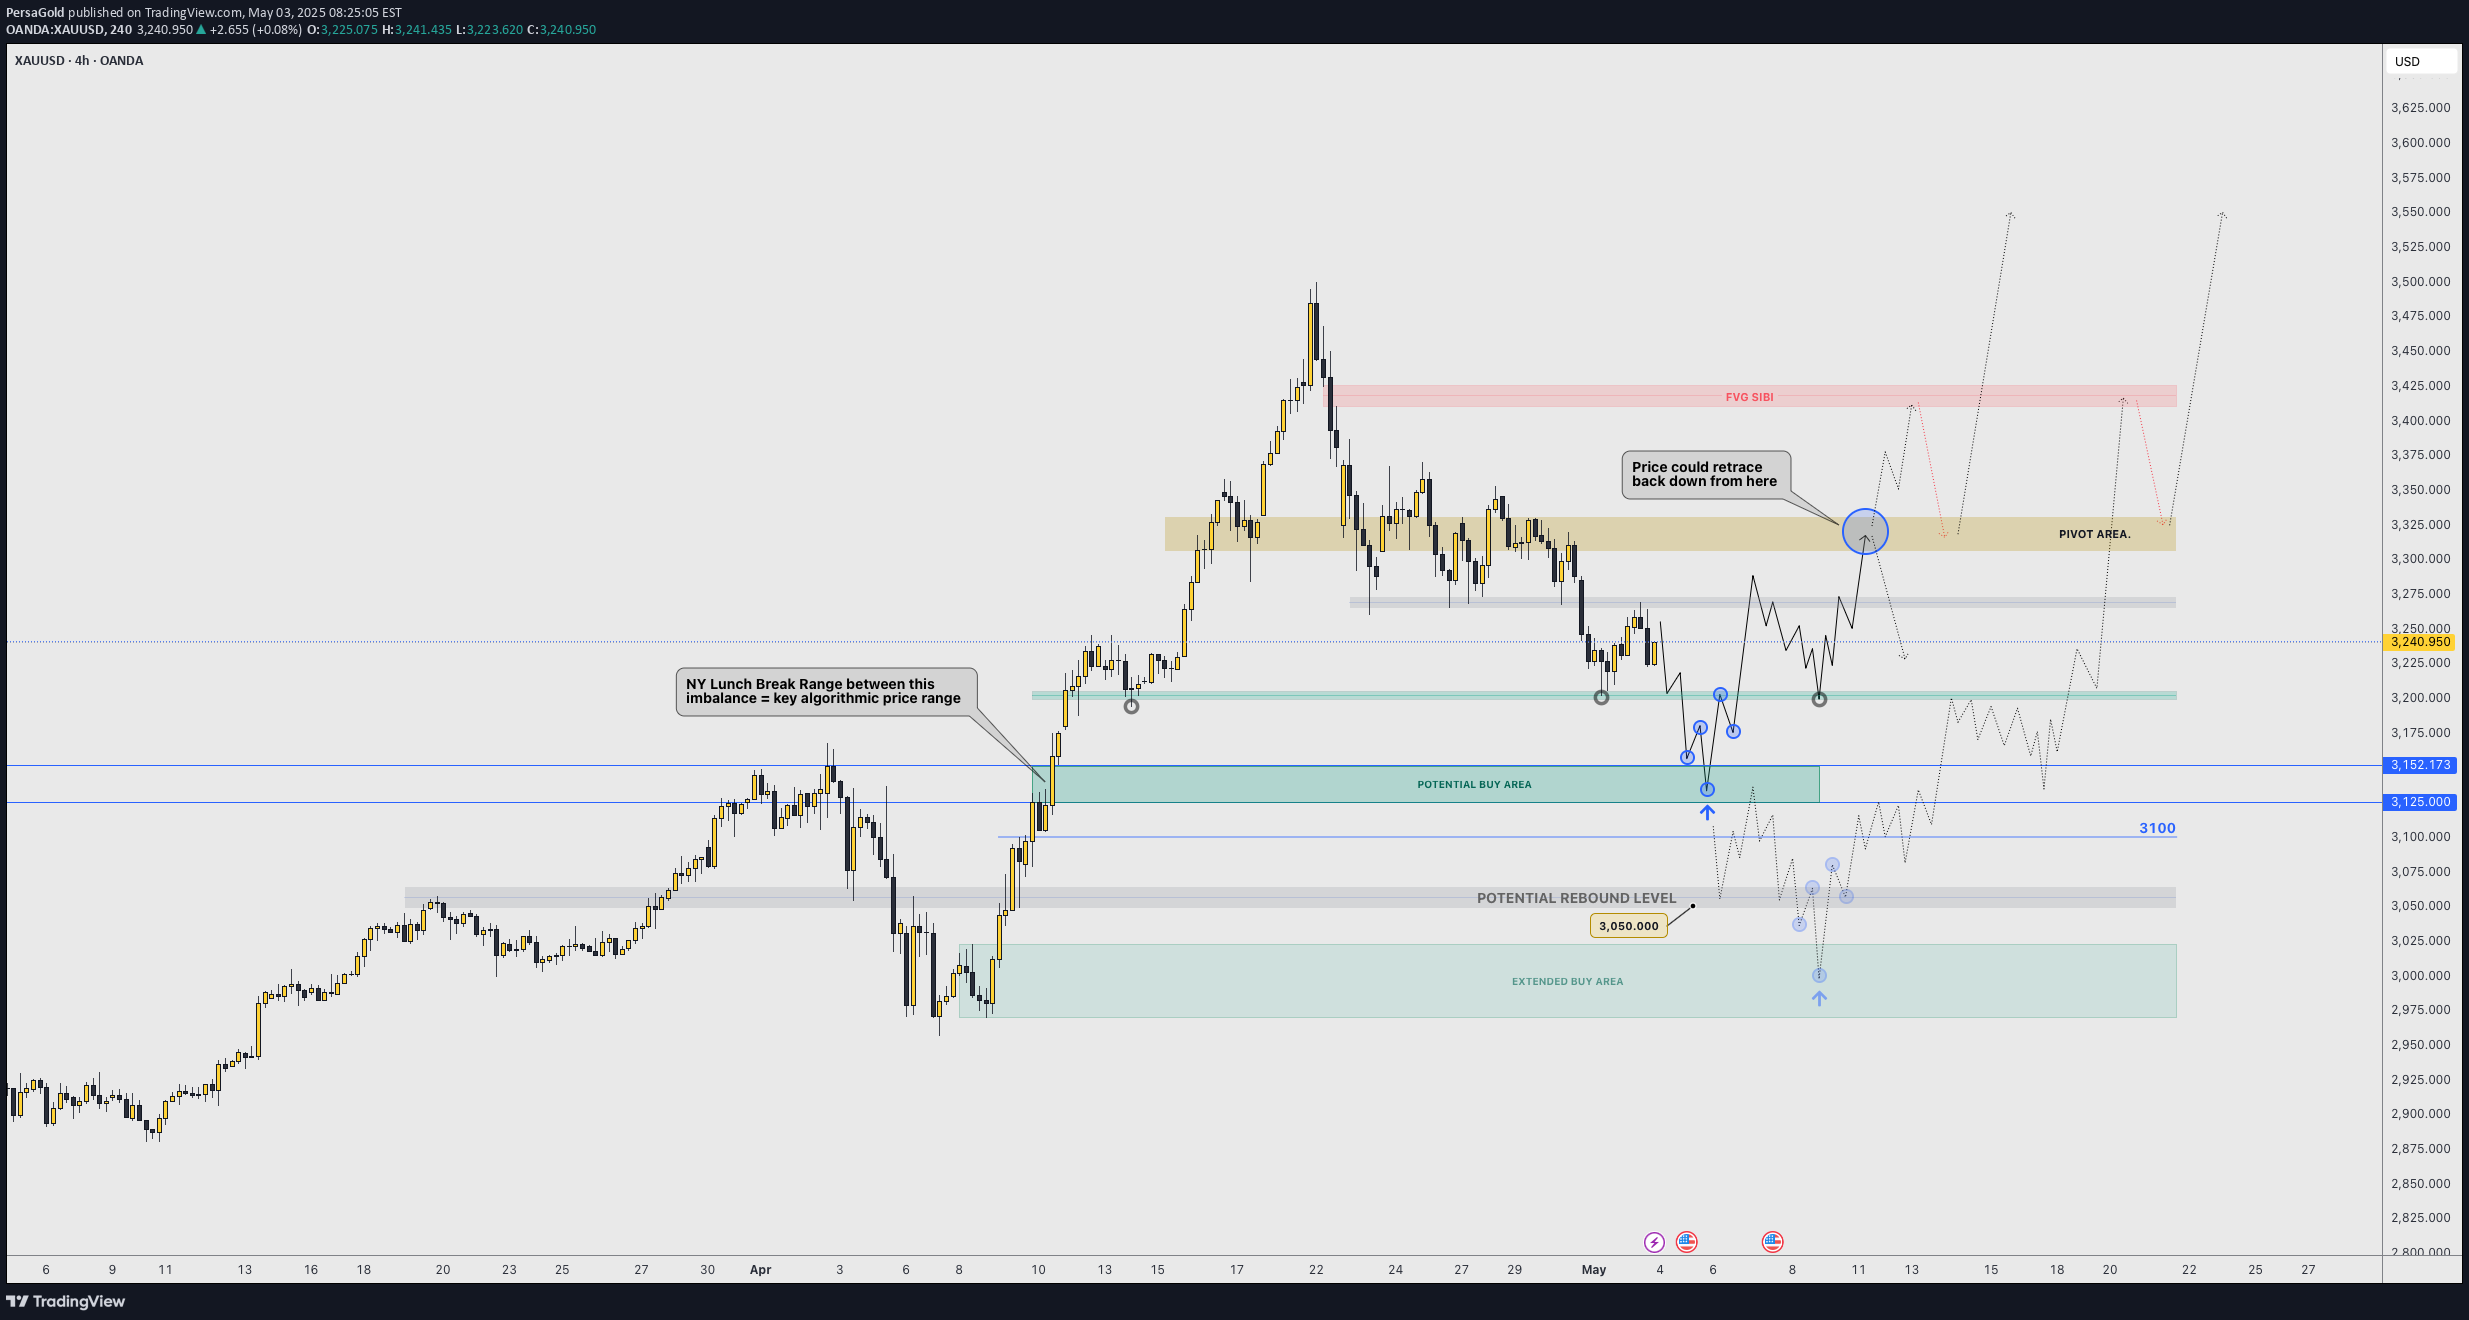
As illustrated, I'm trying to visualize what the next couple of weeks could look like. Taking into consideration the fact that May + June are corrective months for gold historically (don't believe me; check the seasonality tool...), Is likely for price to range up and down within quite a wide range anywhere between 3300 and 3100 before it enters a bullish continuation impulse by the end of June and into first week of July. (I have illustrated 2 potential buying areas; one closer to price and another extended one lower)That being said, one must adapt to such market conditions that will only offer certain structure offering a few intraday trades, but mostly short term trades or quick scalping moves all within a same trading session, simply because as each session comes in, they will target previous sessions highs or lows (ranging back and forth in an uncomfortable manner and without a clear direction). Asia would target Sydney's open, then London might target Asia's open, then NY might target any low or high in the opposite direction... and so on back and forth without truly holding a bullish or bearish structure longer than a few hours to a full calendar day before it turns around (sideways behavior).As price reaches "stronger psychological" price levels like 3150, 3100, 3050 and potentially 3000; then you might start seeing evident rejections within higher timeframes (4H and 1D); ideally seeing rejection wick/s followed by a nice push up showing true power and volume to the upside, potentially signaling the bottom of this correction phase. TIME should be aligned with this market behavior; that means that checking the seasonality tool. every year (on average 5, 10 and 15 years), gold makes a bottom during the first week of JULY... So... market structure, price, and time must be aligned correctly and it will all make sense whenever that moment comes; hence, the title of this idea.I am personally not worried about any sort of economic event; news are only gas for the market to move and create liquidity and volatility. AT THIS POINT, THE ONLY THING THAT COULD TRIGGER A SIGNIFICANT MOVE IN GOLD, IS A GEOPOLITICAL EVENT THAT WOULD TRULLY TRIGGER UNCERTAINTY IN THE MARKETS... . --GOOD LUCK! Persaxu

PersaGold
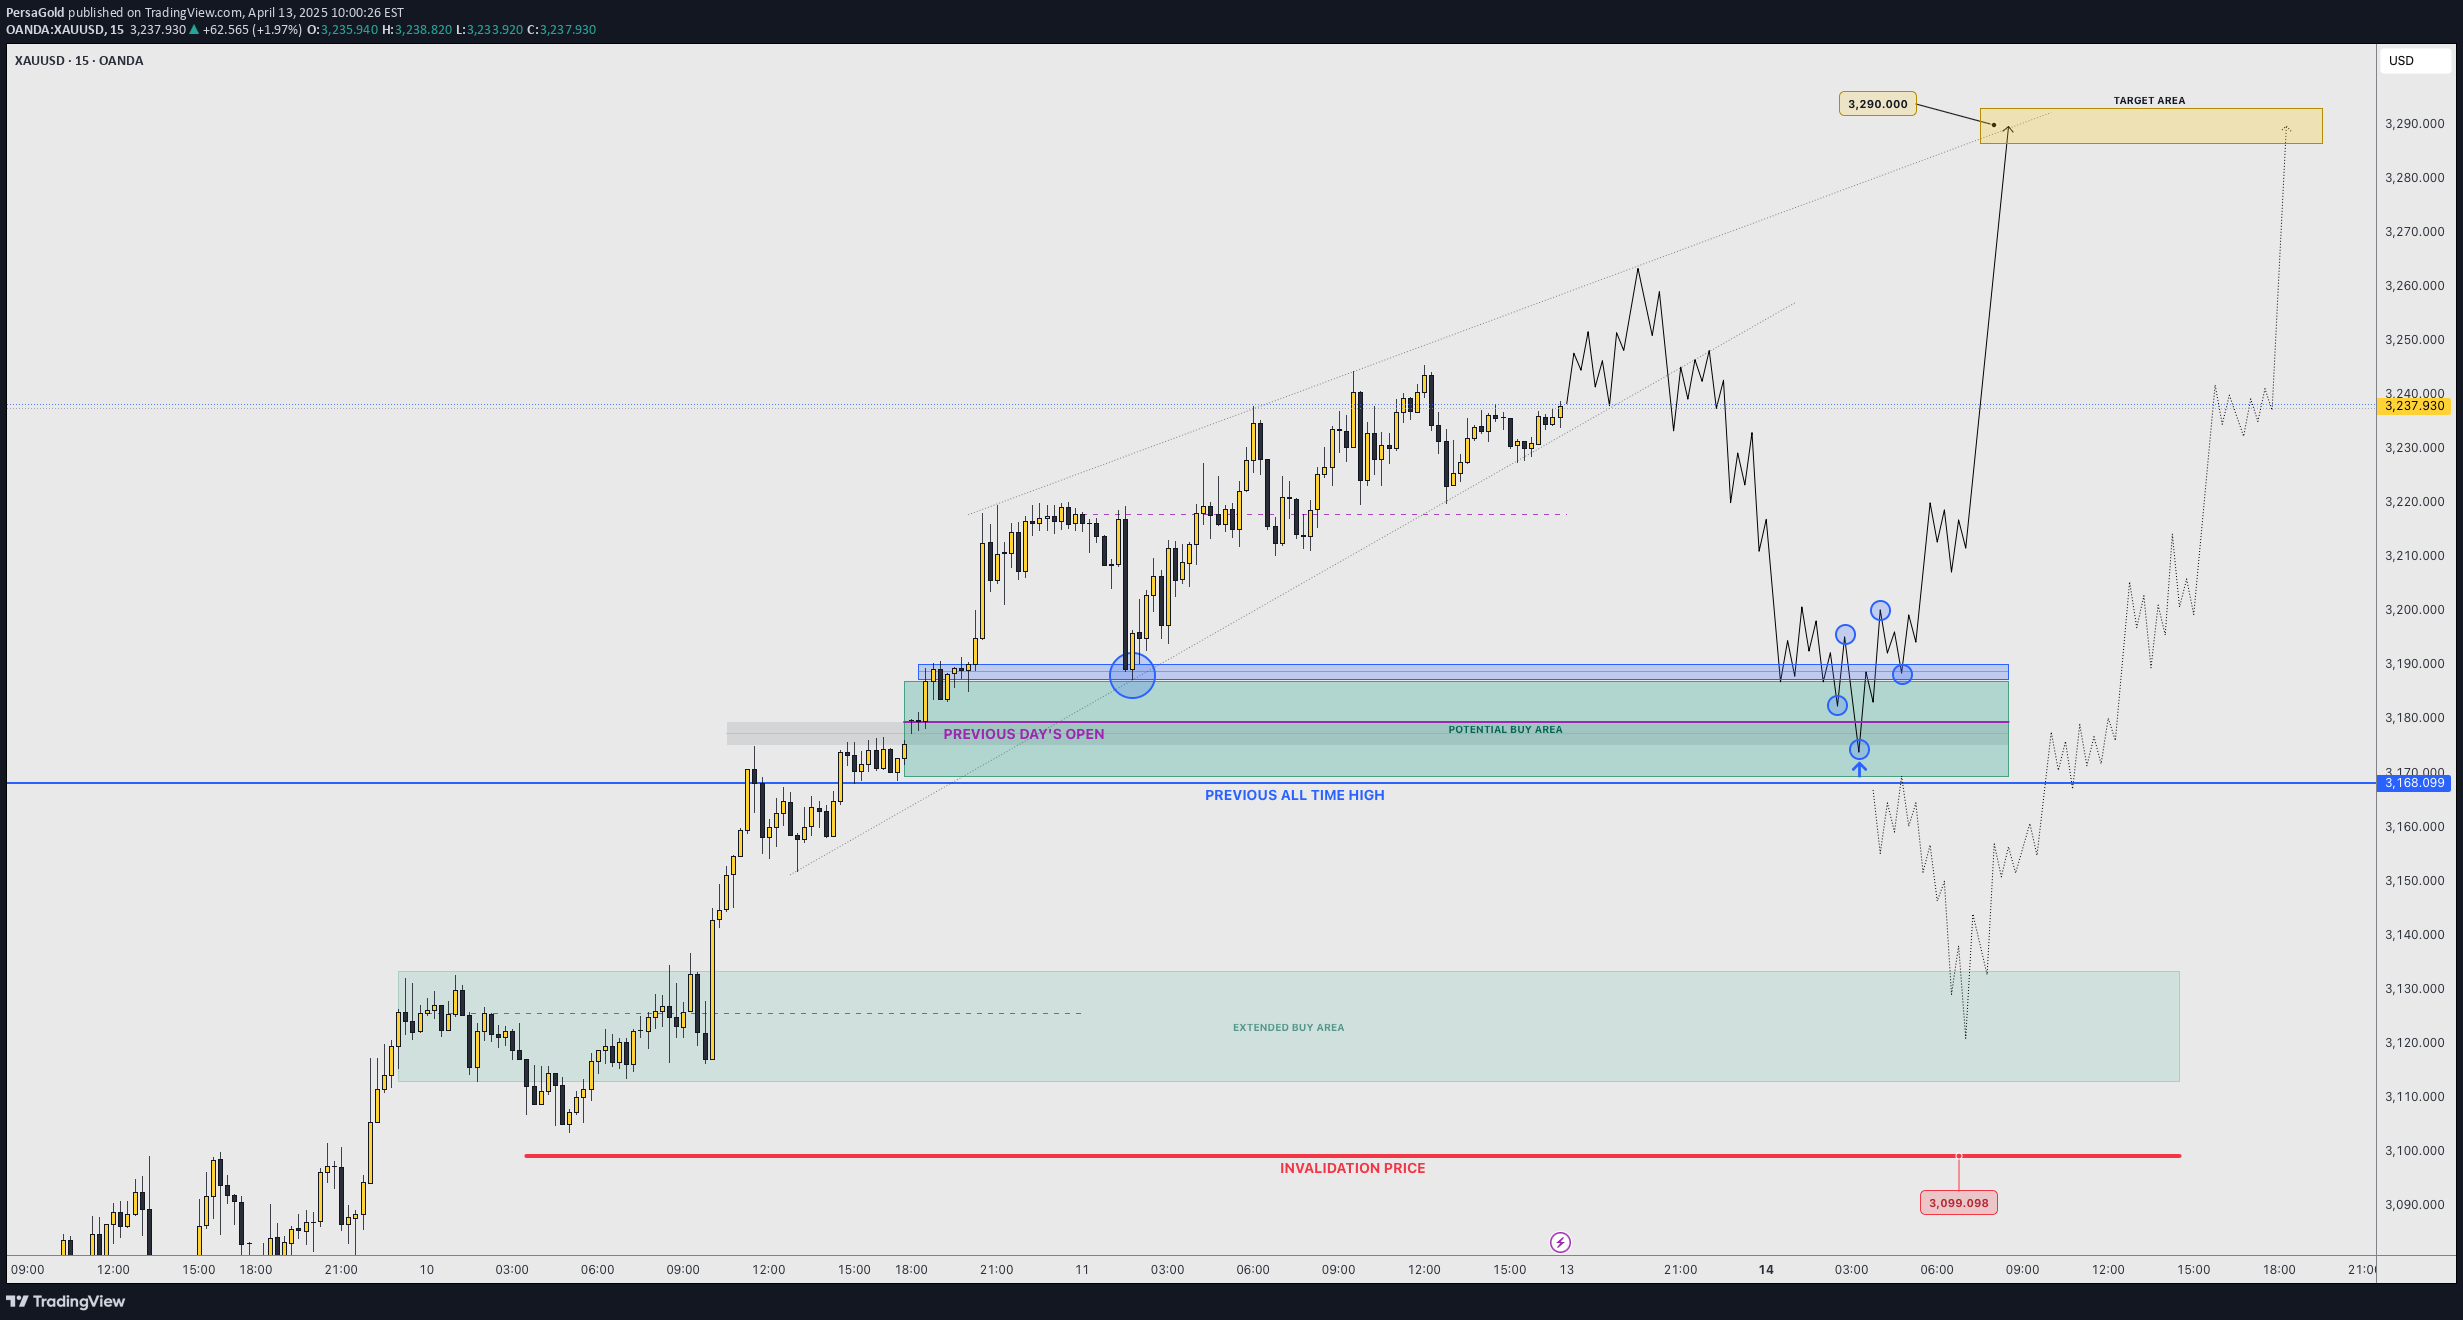
As illustrated, I'm trying to visualize a brief pull back next week making the low of the week early into Monday. Potentially ASIA making the week's low on Monday's open. I was able to visualize the path to 3200, and showed in a past idea how 3200 COULD HOLD as support ... so I wouldn't be surprised if price doesn't even get to 3100, although it could very well find a support there as it is a strong psychological + institutional price at which many central banks, brokers, hedge funds, etc could be dealing gold. In other words, institutions willing to add long positions or even position themselves for the week, they'll do it a these key round numbers easy to deal big orders with... (3,200; 3150, 3100, etc). That being said, we can't ignore or take out the fundamental aspect of gold which, as a matter of fact, it is its main driver until this day. That is: tariff war escalating, stock market on the edge of a cliff, geopolitical conflict very uncertain, ... and much more. Not only investors are protecting their assets with gold, but CENTRAL BANKS keep purchasing gold... for a reason... I've said it multiple times before: any dip is a buying opportunity. Every correction is a bear trap... to traders that think gold is like any other FOREX pair that responds to "divergence" or "stochastic crossovers" or some random indicator. As these retail traders pile in with short trades, the trend continues to take them out and all of that liquidity is actually serving as more gas and power for gold to expand higher and higher... since for every buyer there must be a seller ... "But it's so expensive"... well... define "expensive". There is no historical point that defines today's price as "expensive" ... it's simply the new and actual price of gold. THE TREND IS YOUR FRIEND. --GOOD LUCK!
Disclaimer
Any content and materials included in Sahmeto's website and official communication channels are a compilation of personal opinions and analyses and are not binding. They do not constitute any recommendation for buying, selling, entering or exiting the stock market and cryptocurrency market. Also, all news and analyses included in the website and channels are merely republished information from official and unofficial domestic and foreign sources, and it is obvious that users of the said content are responsible for following up and ensuring the authenticity and accuracy of the materials. Therefore, while disclaiming responsibility, it is declared that the responsibility for any decision-making, action, and potential profit and loss in the capital market and cryptocurrency market lies with the trader.