
Pedi_wxe
@t_Pedi_wxe

What symbols does the trader recommend buying?
Purchase History
پیام های تریدر
Filter
Bitcoin is Bearish or Bullish?
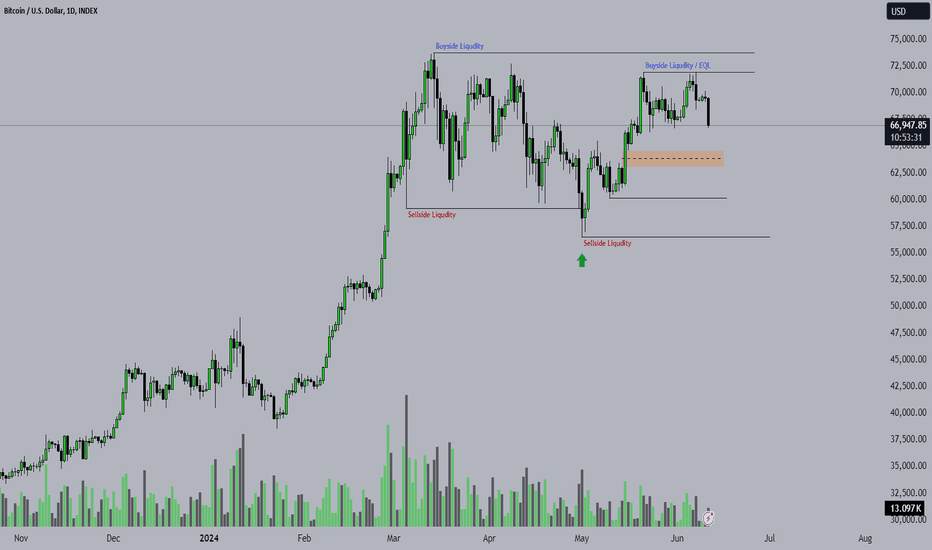
To analyze the BTCUSD Bitcoin to USD (BTC/USD) chart using the ICT style, we focus on the following key points and concepts: 1. Overall Trend Observation: The chart shows that Bitcoin's price has been in an upward trend starting from October 2023 and continuing until June 2024. Currently, a slight decline in the price is observed. 2. Liquidity Zones : - **Buy-Side Liquidity**: At higher levels (strong resistances), there are buy-side liquidity zones that can be considered as targets for an upward move. These zones include around $72,500, which is seen as a major resistance level. - **Sell-Side Liquidity**: At lower levels (strong supports), there are sell-side liquidity zones. These zones include around $60,000 and $55,000, which are seen as strong support levels. 3. Order Blocks : - **Bullish Order Block**: There is a bullish order block in the area of $63,000 to $64,000, indicating buying interest in this zone. - **Bearish Order Block**: If the price moves to lower levels, the bearish order block around $55,000 could be a significant area for a price reversal. 4. Fair Value Gaps (FVG): - If the price continues to drop, there might be fair value gaps between $60,000 and $62,000 that could be filled. 5. Volume Analysis: - Increasing volume during price rises confirms the upward trend. - Decreasing volume during price drops can indicate seller weakness and increase the likelihood of a price reversal from support levels. 6. Key Levels to Watch: - **Support**: $60,000 and $55,000 act as key support levels. - **Resistance**: $70,000 and $72,500 act as key resistance levels. Conclusion: According to the ICT analysis, Bitcoin is in an overall upward trend but has recently seen a price drop. The price might move towards lower support levels before potentially reversing. Monitoring trading volume and price behavior near key liquidity zones, order blocks, and fair value gaps can provide good guidance for trading decisions.
Notcoin is Bullish or Bearish ?

The chart is for the cryptocurrency pair NOTUSDT NOT/USDT from Binance , analyzed on a daily timeframe. Here is a breakdown of the analysis presented: 1. **Current Price**: The current price is approximately 0.015983 USDT. 2. **Price Zones**: - **Fair Value Gaps (FVG)**: Two Fair Value Gaps are highlighted on the chart, indicating areas where price movement was rapid and may return to fill these gaps. - The first FVG is around the 0.017000 USDT level. - The second FVG is around the 0.013500 USDT level. 3. **Order Blocks (OB)**: These are areas of high buying or selling interest, often leading to price reversals. - Two OB+ (Order Block) areas are noted, correlating with the FVGs. 4. **Liquidity Zones**: - **Buyside Liquidity**: This is marked at a higher level, indicating an area where there may be a significant amount of buy orders. The specific levels are marked at 0.029300 USDT and 0.037000 USDT. 5. **Price Projections**: - **Bullish Scenario**: If the price moves upward, it could aim for the buyside liquidity zones at 0.029300 USDT and then 0.037000 USDT. - **Bearish Scenario**: If the price declines, it might target the lower OB and FVG areas around 0.013500 USDT. 6. **Volume Analysis**: The volume bars at the bottom indicate trading activity, with a notable increase during the recent price rise. 7. **50% Shadow**: A level marked as "50% Shadow" which might be an important retracement or equilibrium level. ### Interpretation: - **Bullish Indicators**: If the price can sustain above the current FVG and OB areas, it may attempt to reach the higher liquidity zones. This bullish scenario is illustrated by the green and black arrows projecting upward movements. - **Bearish Indicators**: A failure to maintain the current levels could result in the price dropping to fill the lower FVG, supported by the red arrows projecting downward movements. ### Conclusion: This chart suggests a critical juncture where the price may either move up towards the higher liquidity zones if it can maintain above the current FVG and OB levels or potentially drop to fill the lower FVG if it fails to hold these levels. Monitoring the price action around these key zones and the volume dynamics can provide further insights into the likely direction.
BITCOIN WAIT FOR WEAKLY!!!

hi my name is pedram , my idea for bitcoin it is. good luck & wish best please like and share my this idea, BTCUSDT
SHORT bitcoin!!

hello guys my name is pedram, i think is good short 📉 for now, please just see and watch :) BTCUSDT 🔗 see my profile for another idea.💸💡
GOLD SHORT IT !!!

HI MY NAME IS PEDRAM . this is my analysis for gold i think this good idea for short just see and watch baby ! XAUUSD
Disclaimer
Any content and materials included in Sahmeto's website and official communication channels are a compilation of personal opinions and analyses and are not binding. They do not constitute any recommendation for buying, selling, entering or exiting the stock market and cryptocurrency market. Also, all news and analyses included in the website and channels are merely republished information from official and unofficial domestic and foreign sources, and it is obvious that users of the said content are responsible for following up and ensuring the authenticity and accuracy of the materials. Therefore, while disclaiming responsibility, it is declared that the responsibility for any decision-making, action, and potential profit and loss in the capital market and cryptocurrency market lies with the trader.