
Palestinian_Bitcoiner
@t_Palestinian_Bitcoiner
What symbols does the trader recommend buying?
Purchase History
پیام های تریدر
Filter
Signal Type

Palestinian_Bitcoiner
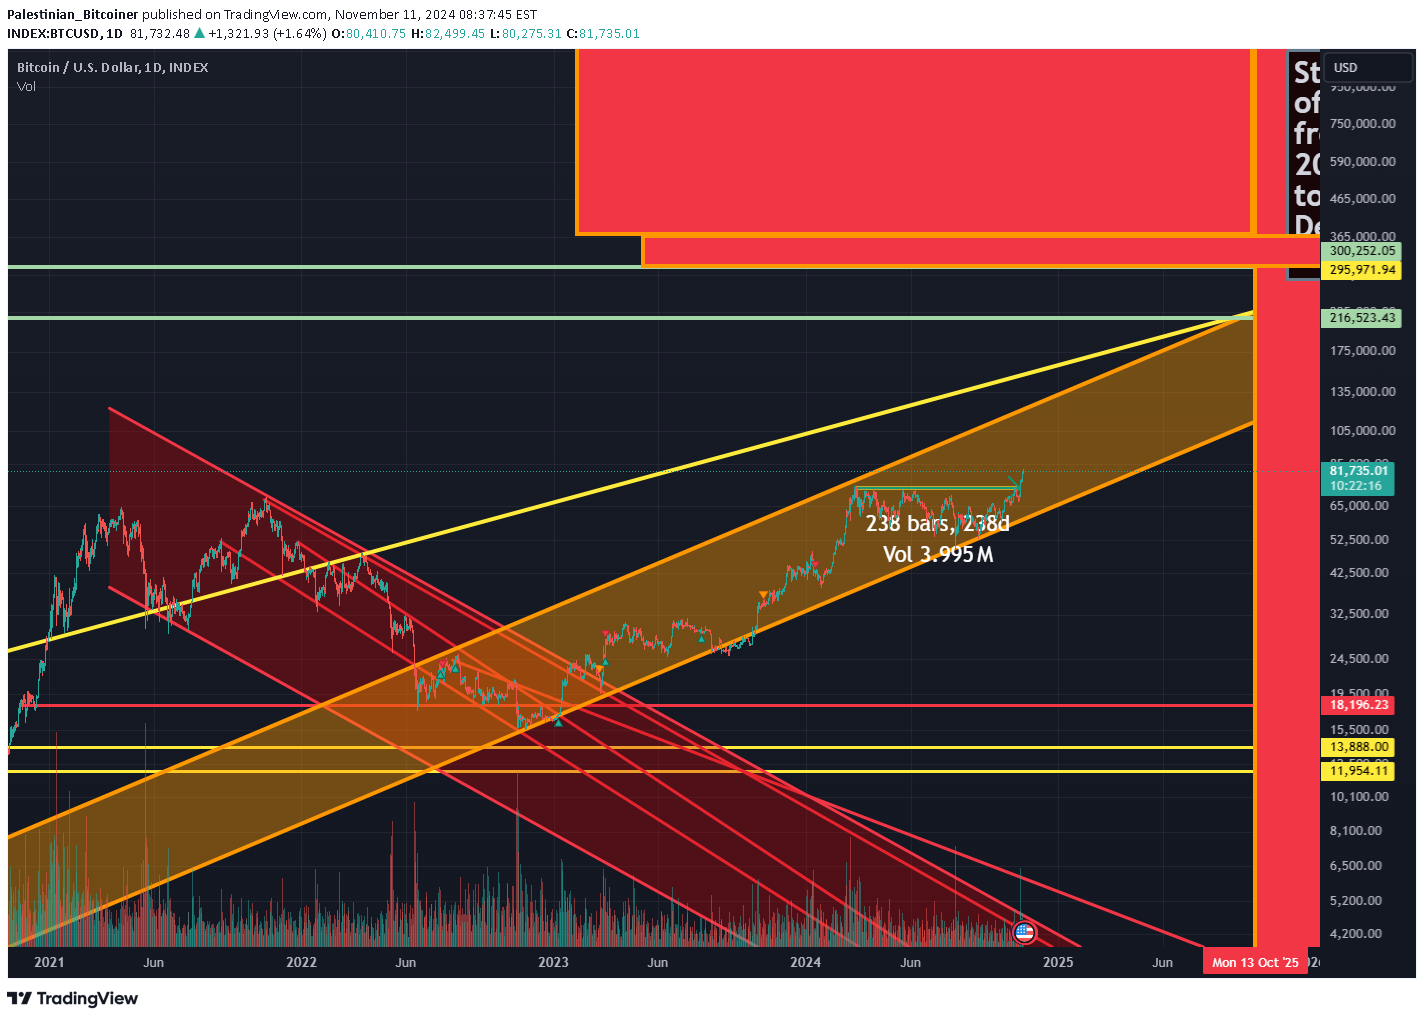
This is more of an affirmation that we have broken out of the 230+ day accumulation. I will try to stay away from selling any spot positions here for the next 1 year. Also helps with tax calculations to hold for over a year from here. Planning to shave a chunk of Q4 2025 between 200K-300K

Palestinian_Bitcoiner
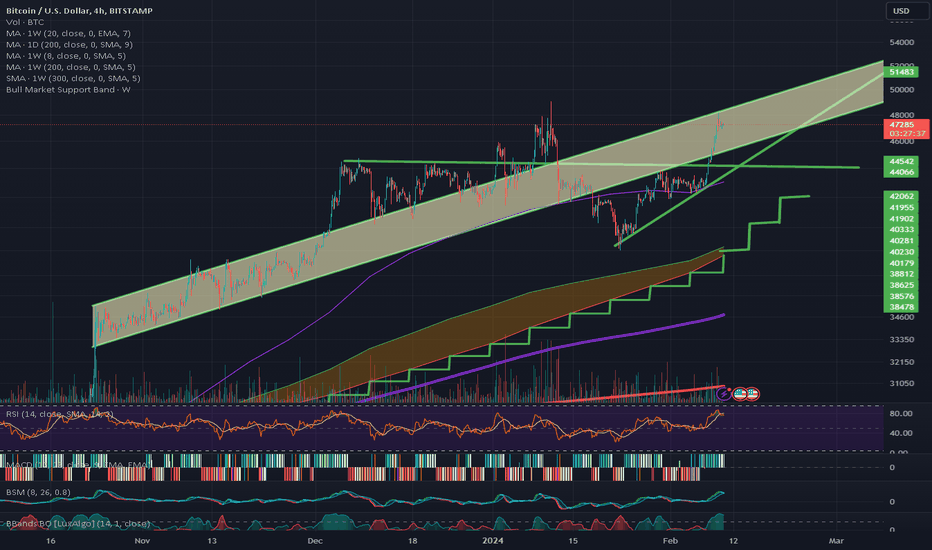
I mean this is all fun and games, but entertained to see how the post bear year of 2022 has been. 2023 reprieve. Will 2024 be similar to 2020, 2016, or unlike we've ever seen? 70K before 2025? Will there be a dump/correction before or around the halving? Halving estimated to be last week of April, coming up in 2 months. LFG

Palestinian_Bitcoiner
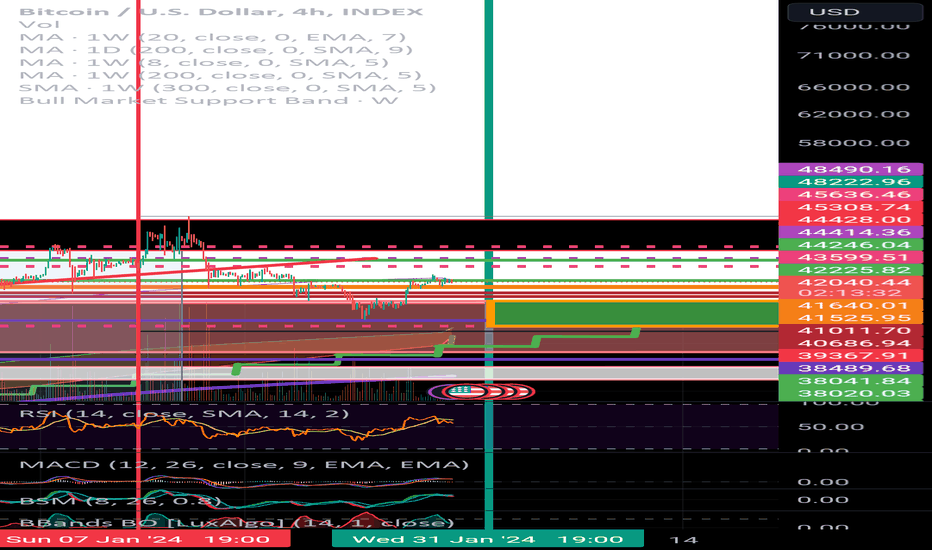
Comprehensive Bitcoin Analysis: ** Overview :** In this in-depth analysis, we explore Bitcoin's price movement on different timeframes, focusing on the daily and hourly charts, and delve into the potential Elliott wave counts for a long-term perspective. As of now, Bitcoin displays interesting dynamics, testing crucial support levels and showing signs of an impulsive rally, indicating a possible shift in its trend. ** Daily Chart Observations :** - **Recent Test of Key Levels:** Bitcoin has tested the 100-day EMA, reaching down to key support levels previously identified at $40,000 and $38,840. - ** Impulsive Rally Indication :** The bounce from these levels has been impulsive, with Bitcoin closing above $42,000. This suggests that the bottom might be in, with a possible ABC correction pattern completing. ** Hourly Chart Insights :** - **Substructure of the Rally:** The rally's substructure, composed of five waves, reinforces the impulsive nature of the recent bounce. - **Potential Future Movements:** Bitcoin could extend this rally higher, with potential pullbacks being corrective rather than impulsive, staying above key support levels. ** Elliott Wave Analysis and Scenarios :** 1. ** (ABC Correction ):** A likely scenario where the recent drop was part of a larger sideways ABC correction, suggesting a potential wave five rally ahead. The targets for this wave five could be in the range of $50,000 to $57,000. 2. ** Extended C Wave Rally :** This scenario predicts Bitcoin's continuation in the C wave rally, potentially reaching $53,000 to $57,000 in the coming weeks and months. 3. ** Bearish Scenario (Impulsive Decline) :** A less likely but possible scenario where Bitcoin breaks below $39,380, leading to a further decline towards $37,000 or $36,400. This scenario would come into play if the current rally fails to sustain and turns impulsive downward. ** Long-Term Outlook :** - ** Primary Expectation 0:** As long as Bitcoin remains above the support level of $39,400, the odds favor a bullish continuation towards the $50,000 to $57,000 region. - ** Alternate Bearish Outlook :** If Bitcoin breaks below key support levels, particularly below $37,000 and $34,000, it could signal a more bearish outlook and a potential top formation. ** Conclusion :** Bitcoin's current market behavior suggests a cautiously optimistic outlook, with a leaning towards a bullish continuation as indicated by the impulsive nature of the recent rally. However, traders and investors should remain vigilant and monitor key support levels for signs of any shift in trend. The coming weeks will be crucial in confirming the direction of Bitcoin's movement. ** Reminder :** Stay updated with our insights by marking our emails as important to ensure delivery. ** Disclaimer :** This analysis is for informational purposes only and should not be considered financial advice. Market conditions are subject to change, and investors are advised to conduct their research and consult financial professionals before making any investment decisions.

Palestinian_Bitcoiner
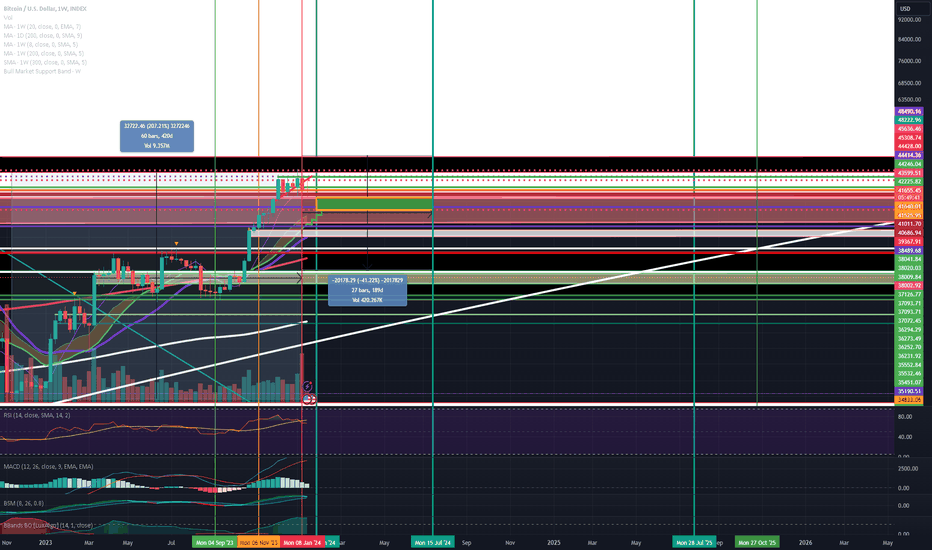
This analysis provides a long-term weekly perspective on Bitcoin (BTC), focusing on critical support and resistance levels from the current price of $41,670 to the projected bottom and potential highs. As we look towards a holding period from July 2024 to October-November 2025, understanding these levels becomes crucial for strategic planning. Current Situation: As of now, Bitcoin is trading at $41,670, showing signs of volatility within established ranges. Projected Long-Term Bottom: The 300-week moving average (MA), marked by a thick white diagonal line on the chart, suggests a potential long-term bottom in the vicinity of $26,000 to $29,000. This bottom is expected to be the absolute low from which Bitcoin could rebound. Key Support Levels (From $41,670 to $38,000): Immediate Support: Around the $40,276 mark, a psychological and technical level. Secondary Support: The $38,000 level, which has historically acted as both support and resistance. Critical Long-Term Support: The $26,000 - $29,000 range, aligning with the 300-week MA, represents a crucial zone for long-term holders. Key Resistance Levels (From $41,670 to $56,000): First Major Resistance : Around $44,000 to $46,000, where BTC has previously encountered selling pressure. Following Resistance: The $50,000 to $53,000 zone, which has acted as a strong psychological barrier. Major Resistance Target: The $56,000 level, which could cap any significant bullish runs in the medium term. (I don't think we go here before halving but would be nice) Strategy Going Forward: Planning to Hold (July 2024 - Nov 2025): Given the projected holding period, investors should prepare for potential fluctuations and bear in mind the long-term support at the 300-week MA. Watching Key Levels: It's crucial to monitor how Bitcoin reacts upon approaching these support and resistance levels, as they will provide valuable insights into market sentiment and trend strength. Conclusion: This long-term weekly perspective on Bitcoin suggests a cautious approach, with a focus on key technical levels. The projected bottom near the 300-week MA presents a potential buying opportunity for long-term holders, while the resistance levels up to $56,000 offer insight into potential sell-off points or profit-taking levels. As always, market conditions can change, and staying informed on global economic factors and market news is essential. Disclaimer: This analysis is for informational purposes and should not be considered financial advice. Always conduct your research and consult a financial advisor for personalized advice before making investment decisions.

Palestinian_Bitcoiner
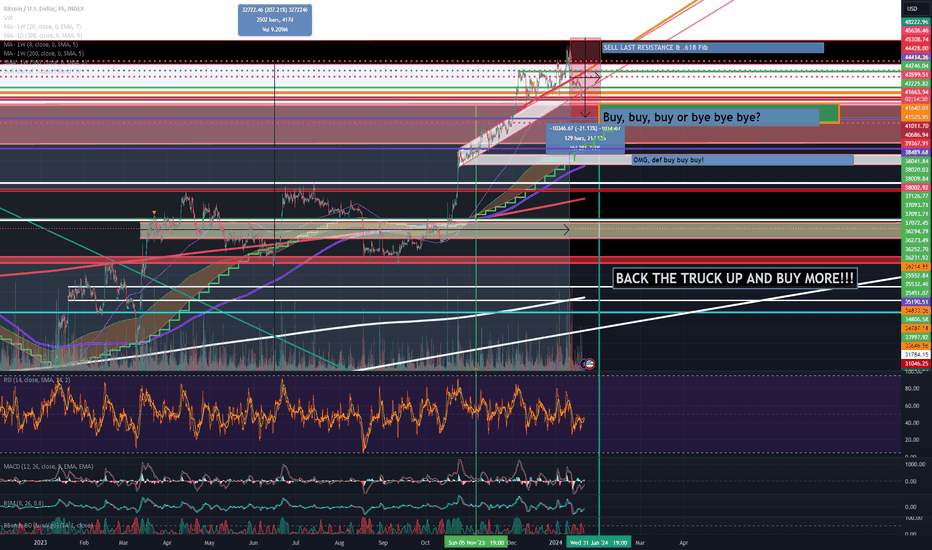
Navigating Uncertainty as BTC Closes near $41,667.77 on January 21st As the week concludes on January 21st, Bitcoin (BTC) finds itself at $41,667.77, marking the end of a second consecutive week in the red. The current market dynamics present a mixture of bullish and bearish scenarios, leaving traders and investors contemplating the cryptocurrency's next significant move. Key Observations: Current Price Level: BTC closed the week at $41,667.77, highlighting a continued downtrend from the previous week. Resistance and Support Levels: Resistance: The immediate resistance for Bitcoin is around $44,000. A breakout above this level, especially if sustained above $46,000, could test higher resistances at approximately $50,000 to $53,000. Support: Bitcoin's support levels lie between $40,000 and $38,000. The weekly 21 moving average also serves as a crucial support indicator. Bullish Scenario: In a bullish outcome, Bitcoin is in the early stages of a wave three extension that could propel it to new all-time highs. However, this scenario depends on Bitcoin breaking and holding above the aforementioned resistance levels, following either sideways consolidation or a deeper decline. Bearish Scenario: The bearish viewpoint suggests a potential ABC bearish wave count. This scenario could unfold if Bitcoin fails to breach the resistance levels and starts declining below $40,000 and $38,000. If these support levels do not hold, it could indicate a more pronounced bearish trend. Market Correlation: Bitcoin's movement appears to be correlated with broader market trends, particularly with the stock market's performance. The possibility of a bearish scenario increases if the stock market enters a wave five region. Technical Analysis: The hourly chart indicates an impulsive decline, suggesting bearish momentum. However, a breakout above key resistance levels could alter this perspective. Conclusion: As Bitcoin hovers below $44,000, traders should closely monitor its interaction with key resistance and support levels for signs of either a bullish breakout or a continuation of the bearish trend. The market remains in a state of flux, with both bullish and bearish scenarios plausible at this stage. The upcoming week's trading activity and market response will be critical in providing clearer insights into Bitcoin's trajectory. Note to Traders: Given the current market conditions, it is essential to approach trading with caution. Stay alert to global economic factors and market sentiment, as they can significantly impact Bitcoin's price movement. Ensure to set appropriate stop-loss orders to manage risk effectively. Yada Yada: This analysis is meant for informational purposes only and should not be construed as financial advice. Always do your research and consult with a financial advisor before making any investment decisions.

Palestinian_Bitcoiner
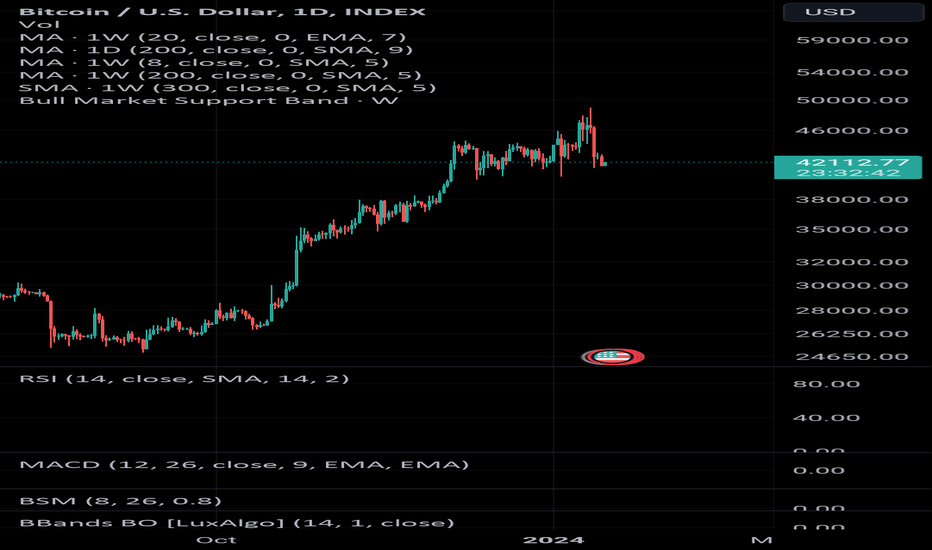
Given the recent drop in Bitcoin's price to exactly $42,000, the key levels to monitor are: Levels Above $42,000: 1. **$45,555:** An important level for a potential overlap, suggesting a corrective pullback if surpassed. 2. **$46,000 - $46,500:** A zone where overlaps could indicate a corrective trend. 3. **$48,500:** A significant resistance level coinciding with the 61.8% golden ratio retracement. 4. **$49,000 - $49,100:** A recent high, breaking above which could lead to higher resistance zones. 5. **$50,000 - $50,452:** A critical resistance area previously anticipated for a pullback. 6. **$53,000 - $56,300:** The next major resistance region if Bitcoin pushes through around $49,000. Levels Below $42,000: 1. **$40,000 - $40,100:** A potential lower target, as indicated previously. 2. **$39,857:** Marked as a 38.2% retracement level and a possible pullback target. 3. **$37,000 - $37,080:** Identified as a significant support zone. 4. **$34,000:** A crucial support level, where a breakdown could signal a move towards a bear market. These levels are pivotal in determining Bitcoin's short-term trend and potential reversal points. The importance of these levels lies in their ability to either support a rebound (if the price bounces off these levels) or to confirm a bearish trend (if the price breaks these levels downward). The reaction of Bitcoin's price at these levels will provide insights into the market's sentiment and potential future movements.

Palestinian_Bitcoiner
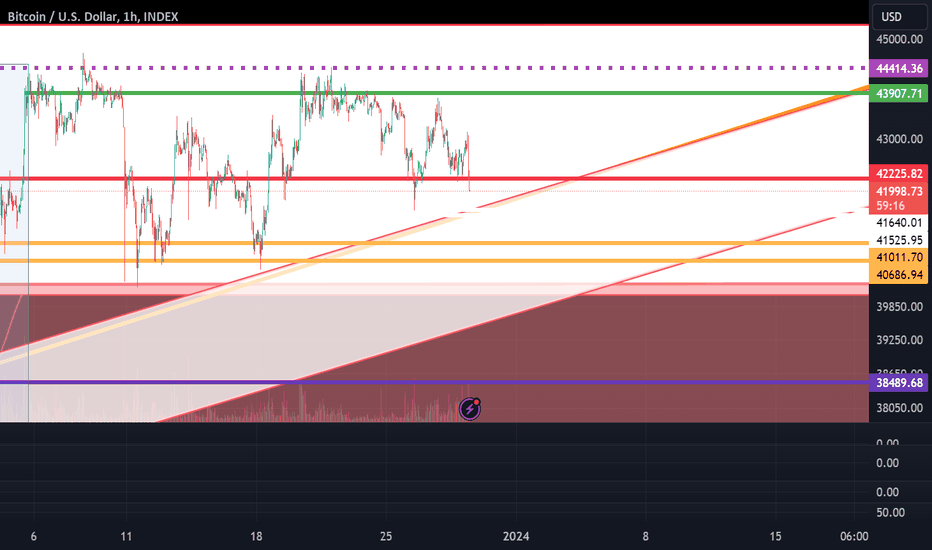
Long story short, because this is new in development. I am taking a tiny short term position in SHORT. Will be invalidated once/if it goes above 43,900 area. Green line has been my take profit on longs and buying back on red line. Now that we're breaking down below, it seems prescient to expect a down quarter. who knows, I'm just reacting off the levels I've built up over the years. Let's see how this goes, I'm not only going to close this tiny short and flip long if it starts cascading below 38K down to high 20s. I will be MEGA long by Spring time until Q4-2025. I don't care if it goes below 20K again, that's my sweet spot. Below? I WISH - backup the truck, know what I mean? LFGOh, forgot to mention, I might adjust my stop loss to thick red line. I think the upward trending parallel channel is worth watching. Anyway, any major bidders before $38,489 ?Welp - that didn't work

Palestinian_Bitcoiner
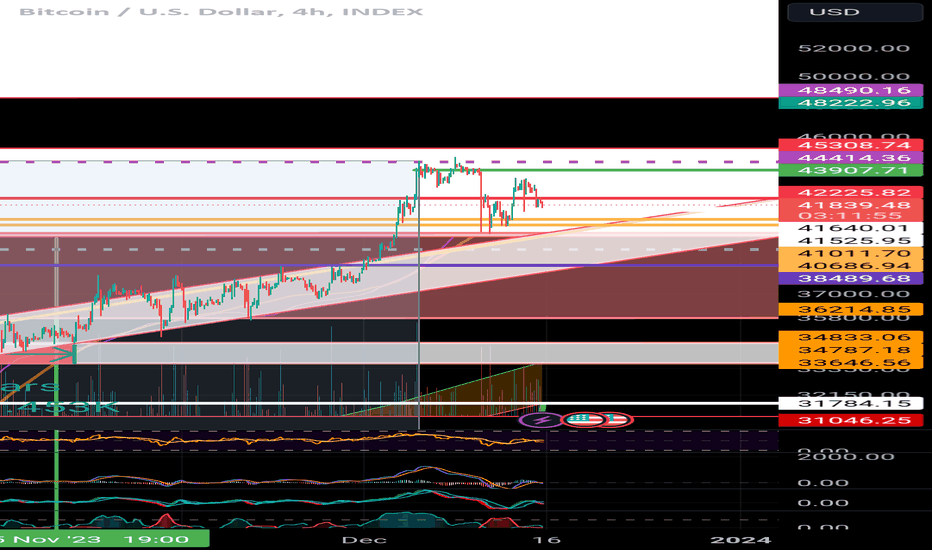
So look, I know I'm super obsessed and bulltarded permalong on long term, but we're going to consolidate until the halving in Spring 2024 (Q2) It's been an AMAZING run and I've been taking a nice victory lap. But I took a breath, pulled myself together and looked back at my chart. Slow and steady lads. Cheers to lovers of Zion Square, Jerusalem , the dwellers of Manara Circle and the rest of you plebs

Palestinian_Bitcoiner
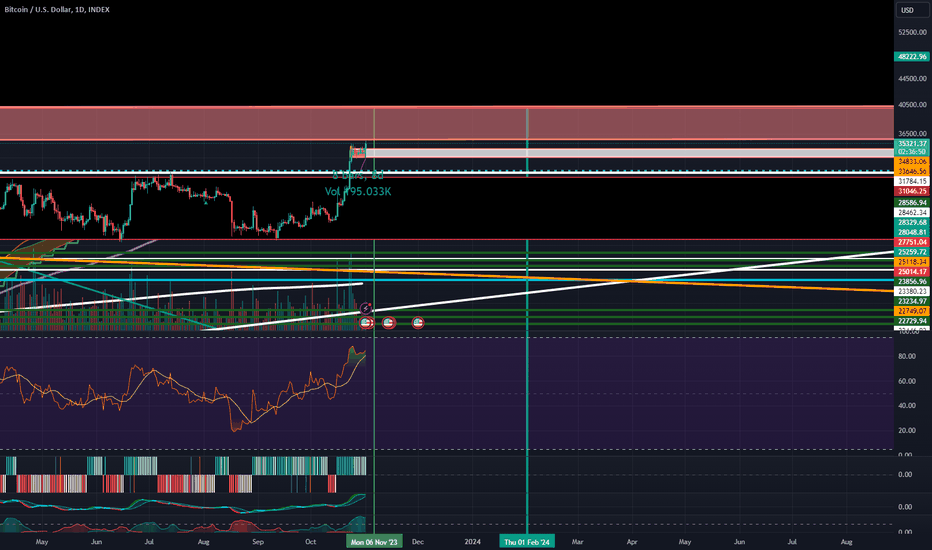
Sorry, since no one really reads my stuff Tradingview makes me fill out description of my chart - I just give GPT some info. Enjoy! (speaking to my current audience of 0 & potential future chart readers) The moving averages and key levels for Bitcoin (BTC) provide traders and investors with valuable insights into its price trends and potential future movements. Here are some observations and analyses regarding Bitcoin's moving averages and key levels as of late 2023: 200-Day and 200-Week Moving Averages: Bitcoin traded below its 200-day and 200-week moving averages as of a recent week, indicating a bearish trend. It had previously closed above its 200-day simple moving average on January 13, 2023, when this average was at $19,5151. 10-Period and 50-Period Moving Averages Crossover: On October 28, BTC's 10-period moving average crossed above its 50-period moving average, which could be a bullish signal. This trend had occurred 27 times over 2,862 trading days dating back to January 1, 20152. 50-Day Simple Moving Average: A recent breakout pushed Bitcoin above its 50-day simple moving average, which is often seen as a positive development for trend watchers. This could indicate a bullish trend if the momentum is sustained3. Key Levels: The sources did not provide specific key levels to watch, but mentioned a consolidation phase below the $35,000 zone and a resistance level below $35,0004. Other key levels might include support at $33,000 and resistance around $36,500 - $37,000 as speculated by analysts in earlier discussions regarding the FOMC meeting impact. Weekly Forecast: There was mention of a weekly forecast breaking down key BTC levels to accumulate for Q2, 2023, although the details were not available due to a restricted webpage access5. Recent Price Action: Bitcoin was up 3.42% on a particular day against the US Dollar, trading 17.88% below a prediction made on October 28, 2023. Over the last month, Bitcoin gained 16.09% and increased 60.78% since a year ago, with a price of $30,845 at the time of the report4. These indicators and levels can provide a foundation for further analysis and decision-making for those interested in the Bitcoin market. For a more detailed breakdown of key levels and moving averages, individuals might consider consulting real-time charting platforms or financial analysis services that specialize in cryptocurrency analysis.

Palestinian_Bitcoiner
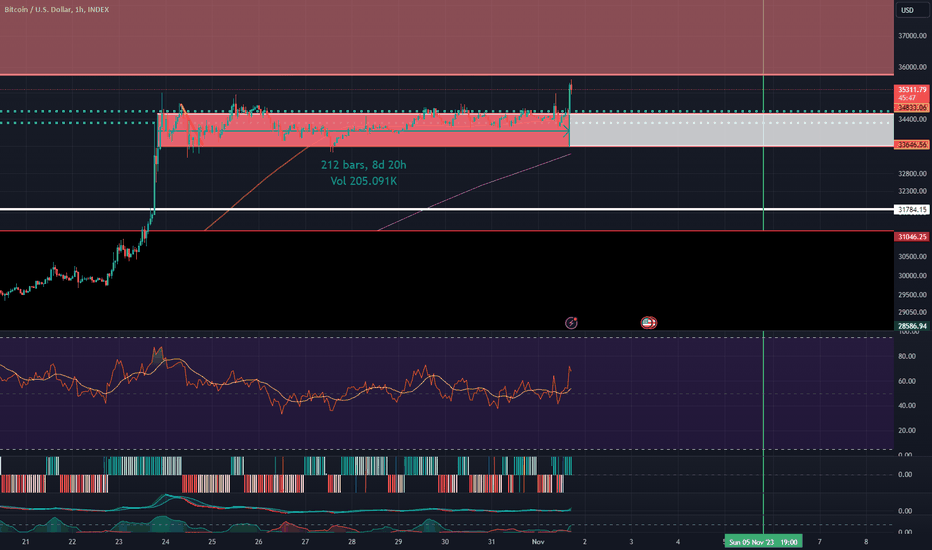
By Nov 5th, I'll hope to have known if we break up or down. Consolidation is bullish setup, but could be tricked. Fre3E P/-\L3 $T!NE :) The below is fluff from GPT-4 The price of Bitcoin (BTC) has shown a relationship with the recent Federal Open Market Committee (FOMC) meeting and the subsequent press conference by Fed Chairman Jerome Powell. Here's a breakdown of the different facets of this relationship: FOMC Meeting Outcome: The FOMC left the benchmark federal funds rate range unchanged at 5.25%-5.50% during its meeting on October 31 and November 1, 20231. This decision was widely anticipated, and the statement from the FOMC indicated concerns about tighter financial and credit conditions possibly affecting economic activity, hiring, and inflation. The extent of these effects was noted as uncertain, with the committee remaining highly attentive to inflation risks1. Bitcoin Price Reaction: Following the FOMC's decision, the price of Bitcoin remained relatively flat, trading just above $34,500, despite having known to experience a significant amount of intra-day volatility during past FOMC decision days1. On the day of the FOMC meeting, Bitcoin's price whipsawed near midday, spiking to a high of $35,200 before dipping to $34,080, and later climbing back above $34,6002. It was noted by some analysts that Bitcoin's price has been in a consolidation phase, with resistance below $35,000. The FOMC decision on interest rates could have triggered a minor dive to sweep liquidity as Bitcoin retests $33,000 support3. Market Expectations and Analysis: Market participants looked forward to Fed Chairman Jerome Powell's post-meeting press conference for insights into the future path of U.S. central bank policy, especially as some Fed speakers had hinted at one more rate hike before ending the historic rate hike cycle1. Some analysts speculated that Bitcoin's price could experience a correction and retest its support level at $33,000, while others observed a notable upswing in Bitcoin prices, fluctuating between $34,100 and $35,000 in the weeks leading up to the FOMC meeting45. The various analyses and market reactions suggest that while the FOMC meeting and subsequent statements by Fed officials have the potential to influence Bitcoin's price, the exact nature and extent of this influence can be complex and might be intertwined with other market factors. Bitcoin (BTC) is currently trading at approximately ~$35,400 USD. Here's a breakdown of its recent price action: Price Change (Last 24 hours): +$525.55 (an increase of approximately 1.49%) Price Change (Last 1 hour): +0.0195% Price Change (Last 7 days): +1.41% Price Change (Last 30 days): +26.37% Price Change (Last 90 days): +20.09% Price Change (Last 180 days): +18.73% 24-hour High: $35,173.46 24-hour Low: $34,133.18 7-day High: $35,173.46 7-day Low: $33,414.08 All-Time High (ATH): $67,617.02 (reached on November 9, 2021) All-Time Low (ATL): $0.0505 (reached on July 17, 2010) 24-hour Trading Volume: Approximately $10.40 billion
Disclaimer
Any content and materials included in Sahmeto's website and official communication channels are a compilation of personal opinions and analyses and are not binding. They do not constitute any recommendation for buying, selling, entering or exiting the stock market and cryptocurrency market. Also, all news and analyses included in the website and channels are merely republished information from official and unofficial domestic and foreign sources, and it is obvious that users of the said content are responsible for following up and ensuring the authenticity and accuracy of the materials. Therefore, while disclaiming responsibility, it is declared that the responsibility for any decision-making, action, and potential profit and loss in the capital market and cryptocurrency market lies with the trader.