
POLARMARKET
@t_POLARMARKET

What symbols does the trader recommend buying?
Purchase History
پیام های تریدر
Filter
POLARMARKET
سطح حیاتی بیت کوین کجاست؟ منطقه خطر ۱۰۷,۵۵۱ دلاری برای سرمایهگذاران!
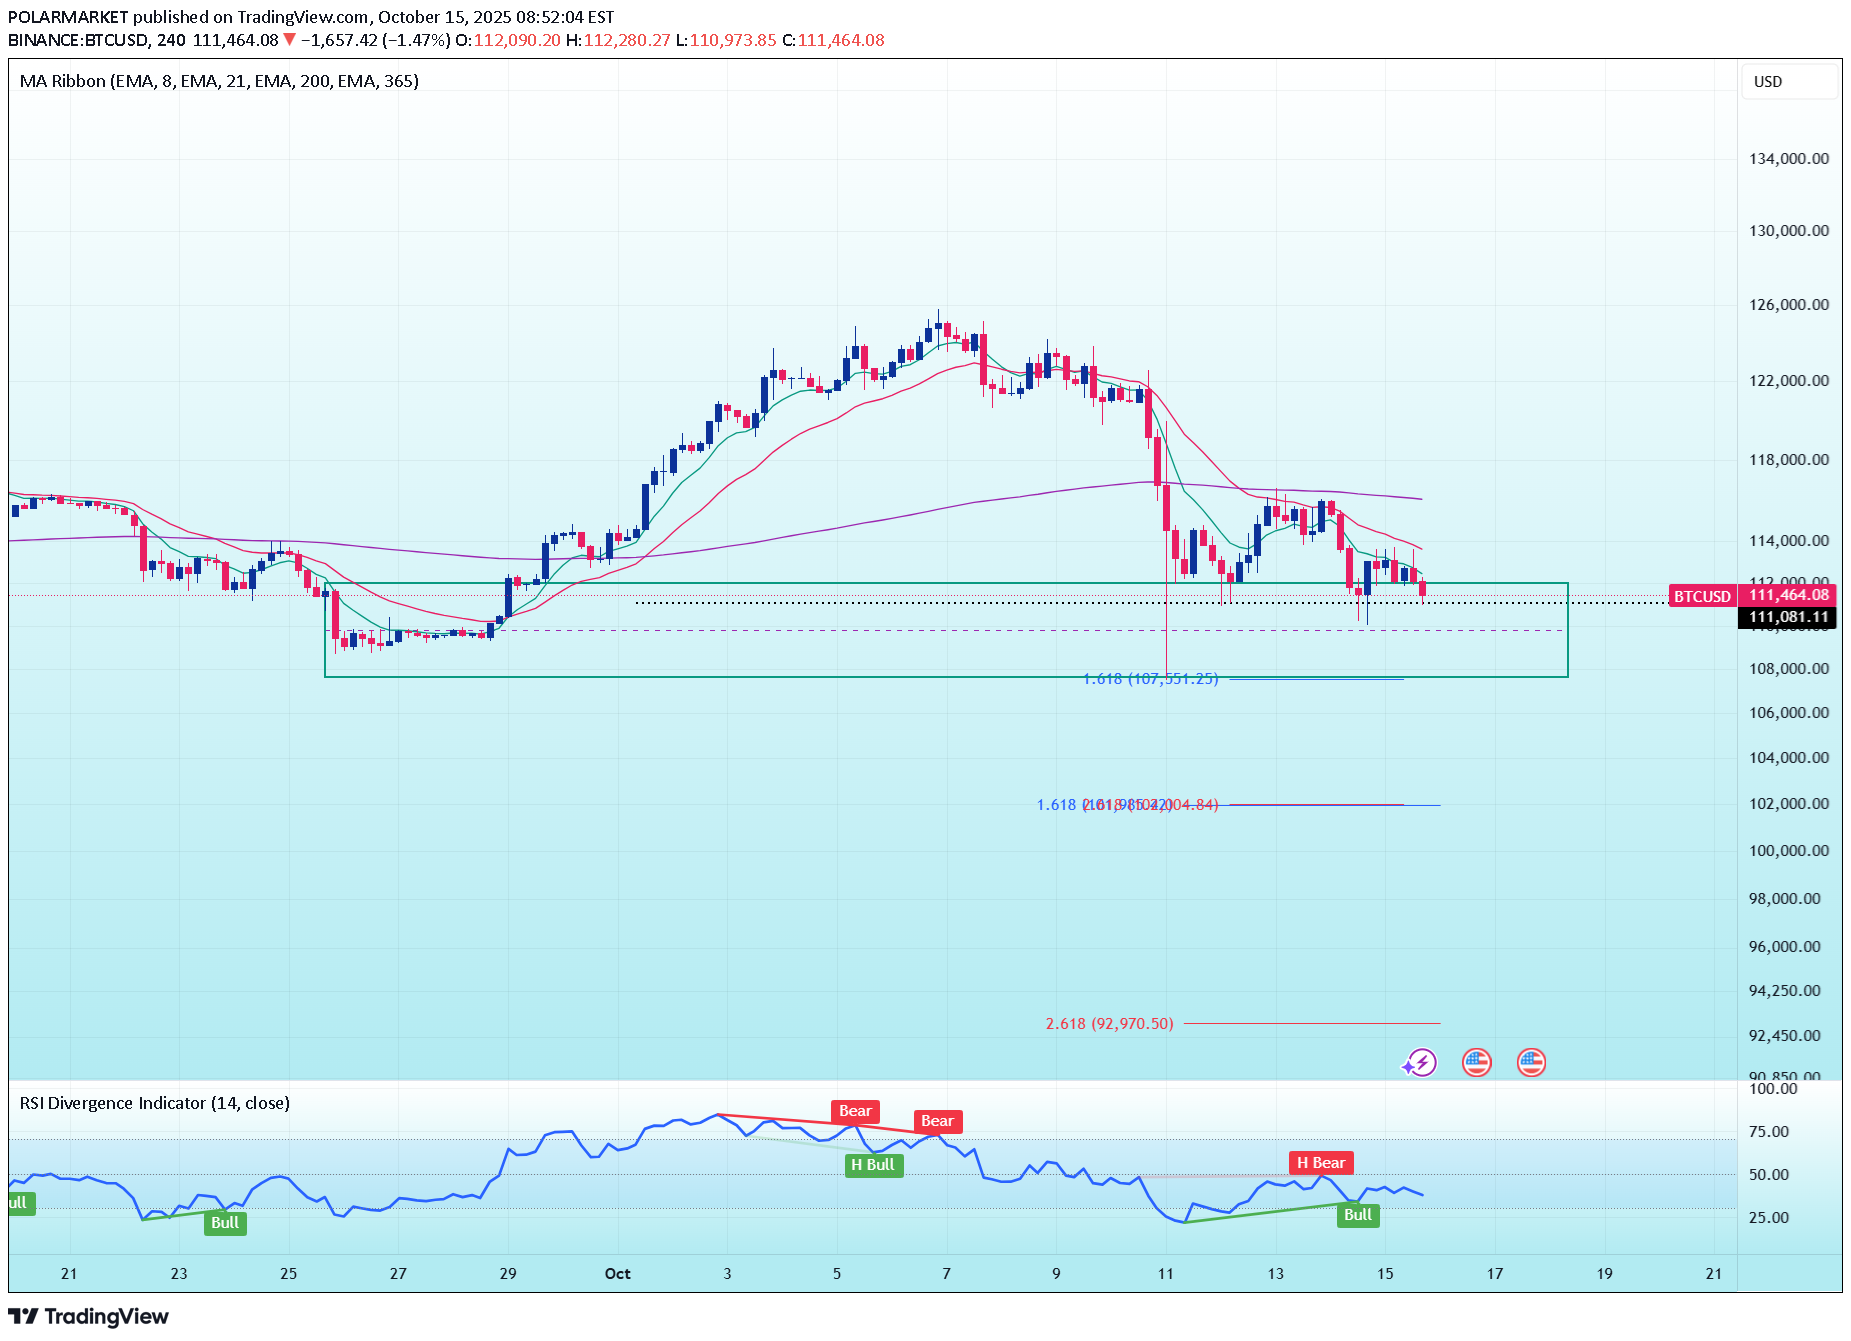
Given that the price of Bitcoin BTCUSD is falling below the 8-EMA, 21-EMA, and 200-EMA, technical analysis employing the H4 period suggests that the cryptocurrency is in a downward trend. The current price of Bitcoin is between $107,551 and $122,007, which is both a traditional support and a demand area. Many traders who established long positions were liquidated in the $108,261 range, according to Coinglass's liquidity data. Consequently, the $107,551–$108,261 range is regarded as a long-term area to monitor. If the price stays steady above the $107,551–$108,261 area, with a price increase towards the $116,108 region, Bitcoin could continue its upward trajectory. The price of Bitcoin will continue to drop, testing the $102,000 mark, if it breaks out below $107,551.
POLARMARKET
مسیر طلایی رسیدن طلا به ۴۲۴۰ دلار: پیشبینیها و فرصتهای بزرگ
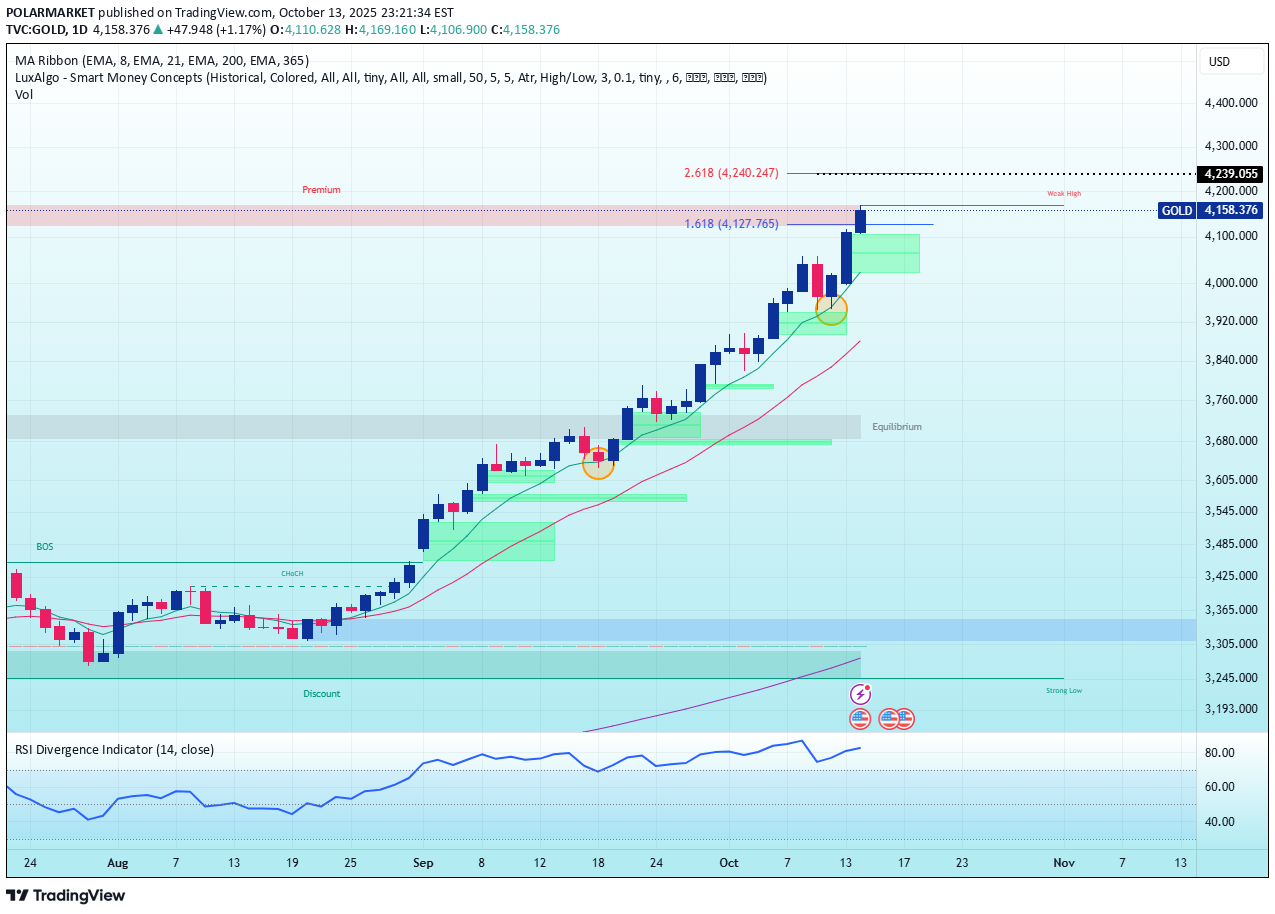
Gold and silver futures jumped to new highs on Monday, with gold breaking past $4,100 per ounce for the first time and silver exceeding its January 1980 peak. The jump was spurred by rising US-China trade tensions and the possibility of future interest rate reduction by the Federal Reserve, which increased demand for precious metals. October gold futures jumped 3.3% to $4,108.60 per ounce, while silver gained 6.8% to $50.13 per ounce. This year, gold has risen 56.3%, while silver has risen 74.2%. While some analysts expect a short-term pullback, the long-term view is still strong. According to Bank of America, gold prices might reach $5,000 and silver $65 per ounce by 2026. Julius Baer and Standard Chartered believe fundamentals continue to support an upward trend, but Goldman Sachs warns of increased volatility in silver due to its considerably smaller and less liquid market than gold. A physical supply deficit is also contributing to the pressure, with reports indicating that merchants have begun moving silver to London to capitalize on the price difference.
POLARMARKET
تحلیل بیت کوین: آیا قیمت ۱۰۷,۴۵۰ دلار حفظ میشود یا سقوط آغاز میگردد؟
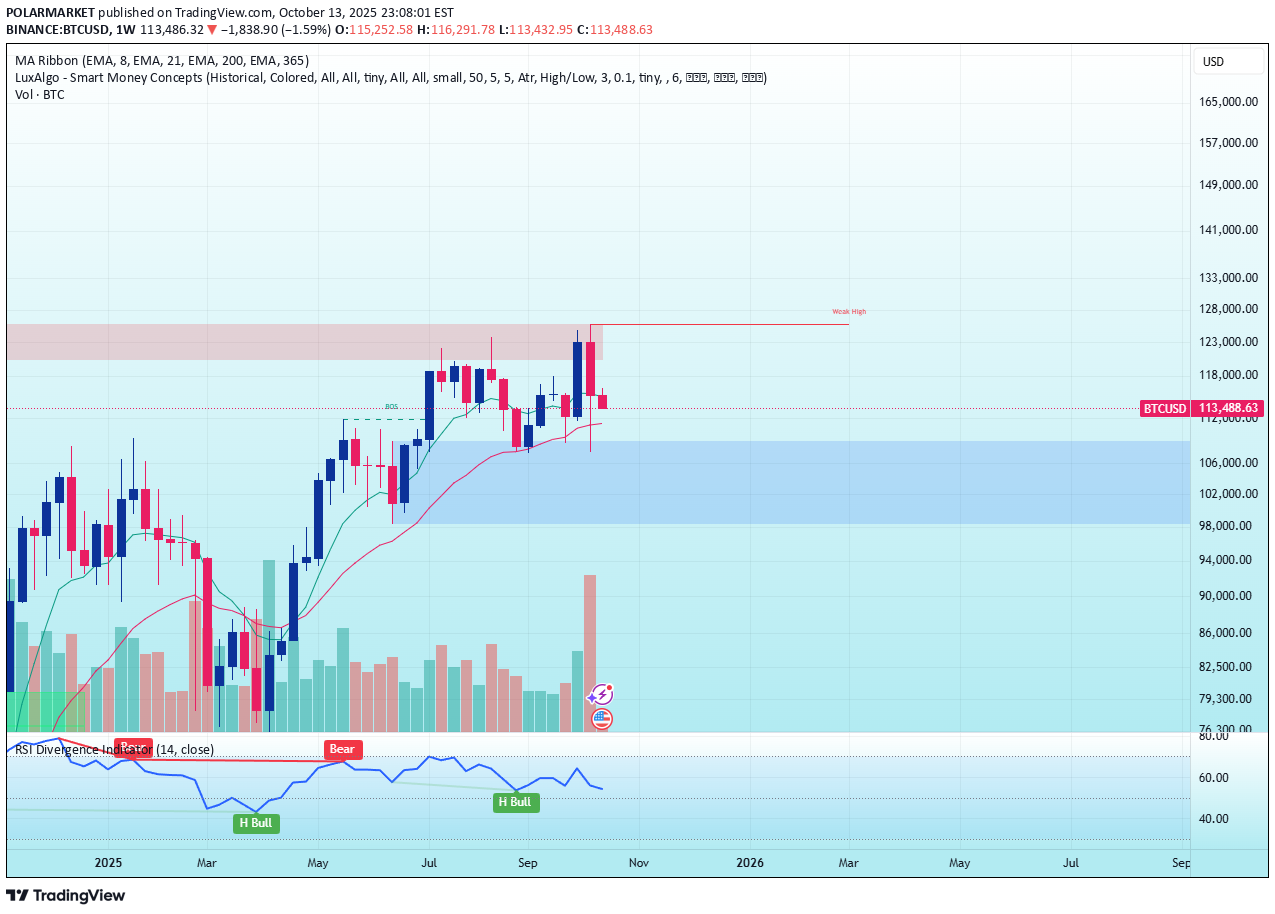
Bitcoin has dropped by almost 10% after Trump announced that he would impose 100% tariffs on China. The largest liquidation event in cryptocurrency history to date, totaling $19 billion, has also occurred. On the weekly timeframe, there is a chance for a breakout below the 8-day moving average (EMA8) even though the price movement of Bitcoin has rejected the 21-day moving average (EMA21). As a result, traders and long-term investors will be able to predict whether the price will reject the typical support area at $107,450 and continue its upward trajectory, or whether it will breakout below it and start a bear market.
POLARMARKET
فرصت انفجاری قیمت لیدو دائو (LDO): آیا زمان خرید فرا رسیده است؟

The price of Lido DAO (LDO) is at a critical point right now, according to technical analysis on the weekly timescale. It is testing the Double Bottom pattern's neckline around US$1.1108 and is also making an effort to break through the 8-EMA resistance at US$1.1957. The price has a broad range of potential for upward movement if it can effectively break out of the 8-EMA level and reject the neckline without dropping below the bullish trendline that supports it. The initial objective is about US$1.5683, and a more optimistic target is around US$2.1888.
POLARMARKET

At $114,500, the price of Bitcoin is currently getting close to the Classic Resistance level. As a result, there are several situations to think about. According to the Bull Case, the price of Bitcoin may continue its short-term upward trend if it breaks out of $114,500 with strong volume support. Nonetheless, there is still a chance that the price of Bitcoin will continue to drop to at least the $112,700 region if it can sustain trade and refuses the $114,500 region.
POLARMARKET

Why: Price just hit the upper rail of a rising channel after a strong Rally-Base-Rally, typical mean-revert toward the midline/base before the next leg. DXY Overlay: Red DXY line is weak overall but sitting near minor support, a dollar bounce often = gold dip. Watch for shooting star / bearish engulfing at the roof to confirm the pullback. Only flip aggressively bullish if we close above the channel and retest it from above (classic pullback-after-breakout). Key levels Resistance: current highs at the upper rail. Support: channel midline / last base (buy-zone on dip); deeper lower rail if momentum cools. Trading idea (use your risk rules) - SELL near the upper rail, TP: midline/base, SL: just above the roof. - BUY the dip at midline/base, TP: upper rail/new highs, SL: below the base. Invalidation: H1/H4 close above the channel + successful retest → target an extension equal to channel height.
POLARMARKET
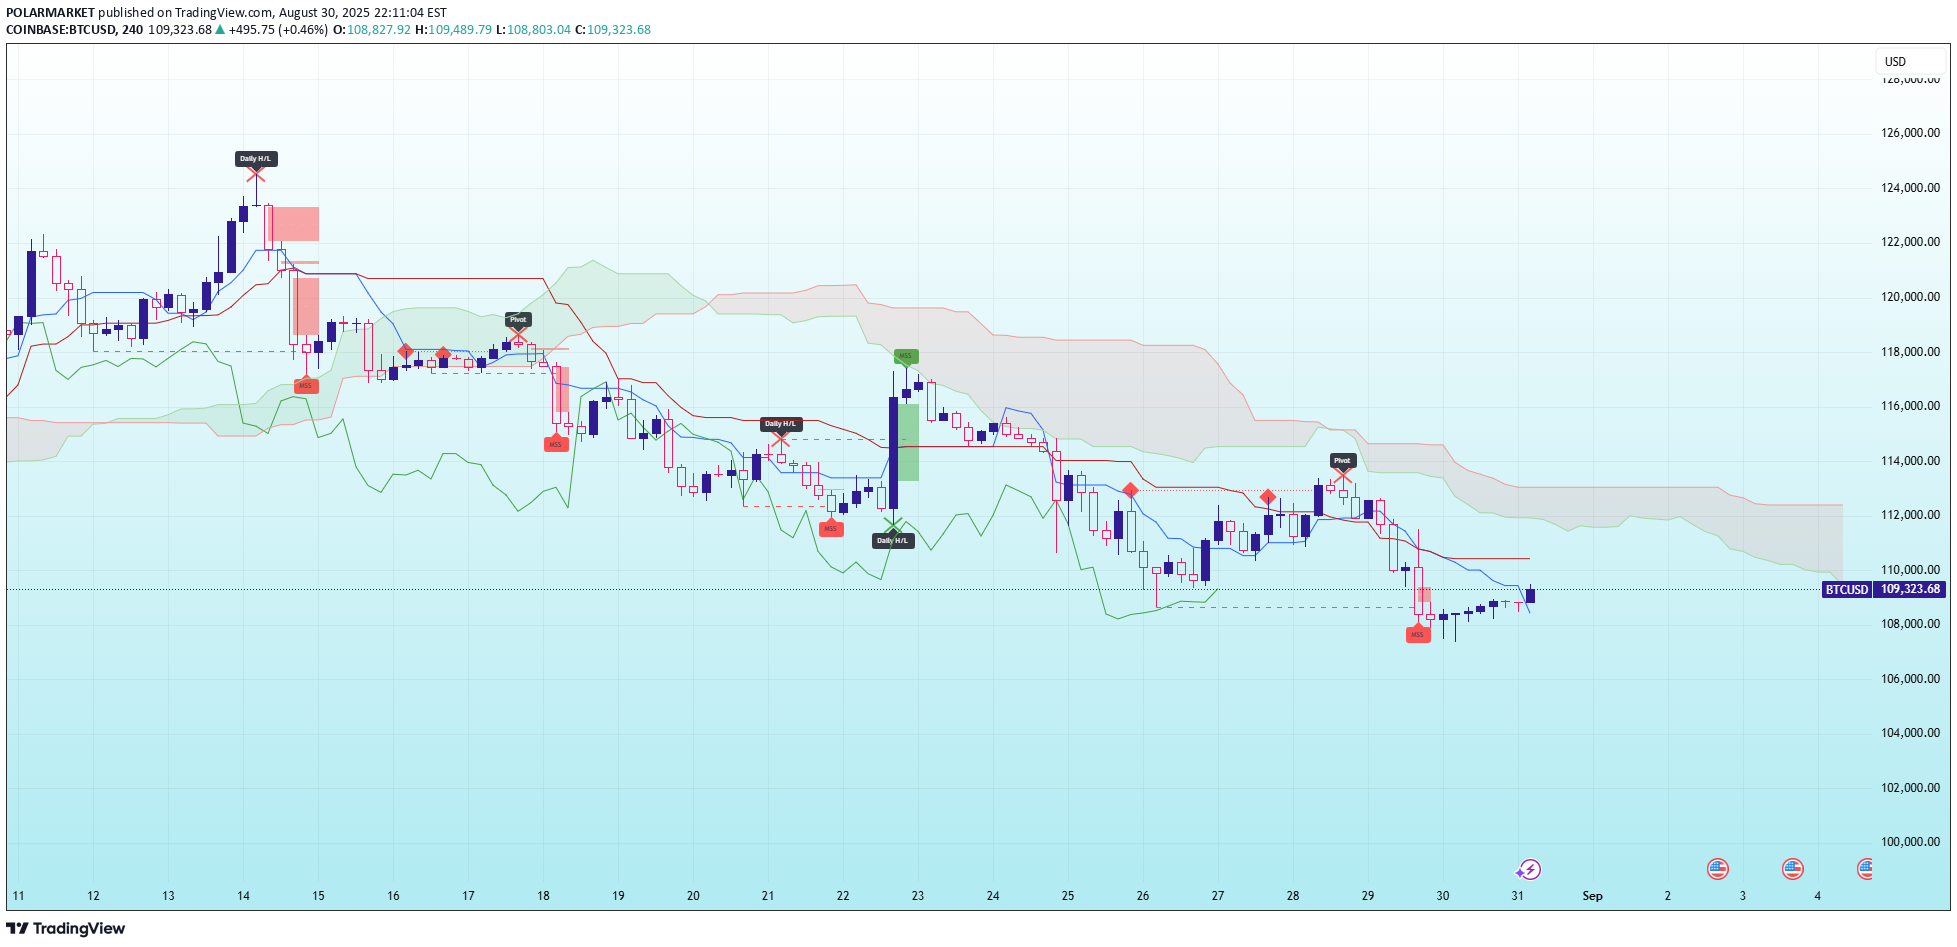
Why: Ichimoku: Price below Kumo, Tenkan < Kijun, future cloud down, Chikou below price → downside momentum. Pullback into Drop-Base-Drop Supply / Bearish OB at 110.8k–111.6k + former support (109.8k–110.2k) → resistance (structure retest). Weak rebound with small bodies/upper wicks = bear flag after the 30th dump; 28th move was a fakeout into new supply. Key Levels Resistance: 109.8k–110.8k (OB + Tenkan/Kijun), 111.6k (Kumo underside; invalidation). Support: 108.6k → 107.2k → 105.8k. Reason: Retest of OB/Supply under Kumo (continuation). Flip Long (only if invalidated): BUY only on clean H1/H4 close & retest above 111.6k → 112.8k / 114.0k targets; SL 110.8k.
POLARMARKET

Bitcoin is hovering around 108,457, sitting on a critical demand zone (108,900 – 109,800). Momentum is stretched on the downside (RSI near 33), hinting at exhaustion from sellers. If this base holds, the market could stage a recovery back toward 111,500 – 112,188. Losing 108,900, however, would shift the focus to deeper retracement. In short: This is a pressure point where the next impulse will be decided.
POLARMARKET

Gold is currently trading around 3,406, after moving higher within a rising channel. Price has slipped out of the channel, suggesting a potential pullback before resuming the uptrend. Key Zones to Watch Support: 3,396 → 3,374 → 3,350 Resistance: 3,420 – 3,430 Outlook: As long as price holds above 3,374, the broader bullish structure remains intact, with room to climb toward 3,420 – 3,430. A clear break below 3,374 would expose the next support near 3,350.
POLARMARKET

On the daily timeframe, Bitcoin BTC is showing signs of potentially forming a Double Top reversal pattern , indicating a possible trend shift from bullish to bearish. Should the price break below $111,950, Bitcoin could decline toward the $104,320 range, which also coincides with a fair value gap area. Although the liquidation map from Coinglass highlights liquidation clusters between $110,841 and $111,905, traders and investors are advised to remain cautious in anticipating Bitcoin’s volatile price movements.
Disclaimer
Any content and materials included in Sahmeto's website and official communication channels are a compilation of personal opinions and analyses and are not binding. They do not constitute any recommendation for buying, selling, entering or exiting the stock market and cryptocurrency market. Also, all news and analyses included in the website and channels are merely republished information from official and unofficial domestic and foreign sources, and it is obvious that users of the said content are responsible for following up and ensuring the authenticity and accuracy of the materials. Therefore, while disclaiming responsibility, it is declared that the responsibility for any decision-making, action, and potential profit and loss in the capital market and cryptocurrency market lies with the trader.