
PIPsOptimizer
@t_PIPsOptimizer

What symbols does the trader recommend buying?
Purchase History
پیام های تریدر
Filter
Bitcoin (BTC/USD) – Bearish Breakdown & Key Levels to Watch

Market Overview:Bitcoin is trading at $84,185, showing a +1.63% increase. The price action suggests a potential breakout towards the upside.🔹 Chart Structure:BTC has been consolidating in a range-bound structure after a sharp upward move.Previous rising wedge patterns led to corrections, but the price is holding key support levels.A breakout setup is forming with a target towards $88,500 – $90,000.🔹 Key Levels to Watch:✅ Resistance: $85,249, $86,934, $88,500, $90,000✅ Support: $82,000, $81,400🔹 Potential Trade Setup:📈 Bullish Scenario:If BTC holds above $84,000, a push towards $86,500 – $88,500 is likely.A breakout above $88,500 could lead to $90,000+.📉 Bearish Scenario:If BTC rejects $85,000, a pullback to $82,000 – $81,400 may occur before another move up.🔹 Conclusion:Bias: Bullish above $84,000Target: $88,500 – $90,000Invalidation: Below $81,400Would you like a more detailed trade plan with stop-loss and entry points? 🚀
"Gold Approaching Key Support – Will Bulls Take Control?"

🔹 Market Structure:Gold is currently in a corrective phase after a strong bullish run, facing a pullback from recent highs around $3,160. The price has now approached a key horizontal support zone near $2,980 - $3,020.🔹 Key Levels:✅ Resistance: ~$3,160 (previous high)✅ Horizontal Support: ~$2,980 - $3,020 (marked in blue)✅ Target Level: ~$3,099 (potential bounce area)🔹 Potential Scenarios:1️⃣ Bullish Reversal: If the price finds support in the marked zone and forms bullish confirmation (e.g., hammer candle, bullish engulfing), we could see a retest of $3,099 and potentially higher levels.2️⃣ Breakdown Scenario: If support fails, gold may see further downside towards $2,950 or lower.🔹 Trading Plan:📈 Buy Setup: Look for bullish confirmation near support (~$3,020) with a target of $3,099 - $3,120.📉 Sell Setup: If support breaks, short positions could target $2,950 - $2,920.🔸 Bias: Bullish above support, bearish below it.🔸 Risk Management: Use a stop-loss below support (~$2,980) to manage risk.Would you like me to refine this further or add any indicators like RSI, Moving Averages, etc.? 🚀
Gold (XAU/USD) Breaks Ascending Channel – Bearish Move Ahead?
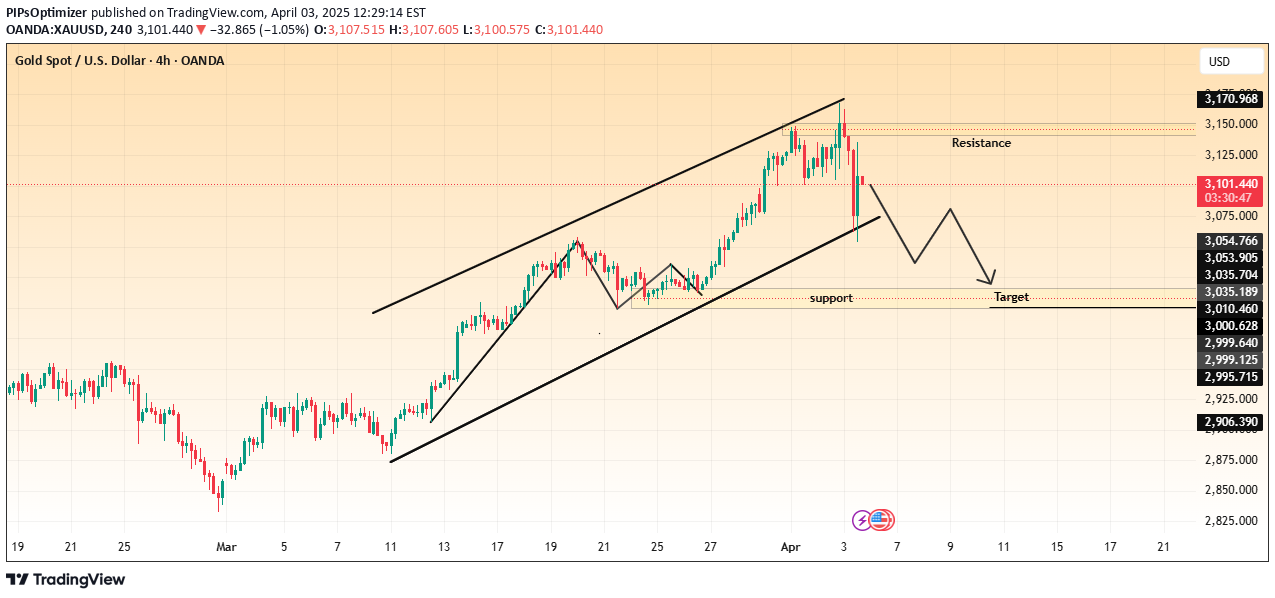
📉 Market Structure:Gold was moving in an ascending channel, but price has now broken below the support trendline.This suggests a possible trend reversal or correction.📌 Key Levels:Resistance: $3,125 - $3,170Support: $3,054 - $3,035Target: $3,000 - $2,995📊 Trade Idea:A pullback to support-turned-resistance could give a short entry.Bearish target: $3,000 if rejection holds.Invalidation: If price reclaims $3,125.🔍 Watch for:Price reaction at the former channel support.Possible retest before further drop.Let me know if you need any modifications! 🚀
(ETH/USD) Breakout from Falling Wedge – Bullish Momentum Ahead?

Ethereum (ETH/USD) Breakout from Falling Wedge – Bullish Momentum Ahead?This 4-hour Ethereum chart shows a breakout from a falling wedge pattern, a bullish reversal formation. The price has started forming higher lows, signaling potential upside movement. The projected target is around $2,411, indicating a significant recovery.A successful retest of the breakout level could confirm further upward momentum. Traders may consider long positions while monitoring resistance levels.📌 Key Levels:Support: ~$1,879Target: ~$2,411Resistance Zones: $2,100 - $2,200Would you like me to refine this further? 🚀
Bitcoin (BTC/USD) Reversal? Rising Wedge Breakdown Signals Sell!

The chart suggests a potential bearish move after a rising wedge pattern breakdown.Key Observations:Rising Wedge Breakdown:BTC formed a rising wedge, which is a bearish reversal pattern.The price has broken down from this wedge, indicating a potential downtrend.Support and Resistance Levels:Resistance Zone: Around $88,188 – $88,792, marked as a key level where selling pressure may increase.Support Zone: Around $85,368 – $84,226, where buyers may step in.Target: $81,429 – $81,258, a strong support level where price could drop.Bearish Setup:The chart suggests a sell opportunity near resistance, expecting a downward move toward the target zone.Trading Idea:Entry: Sell near $88,000 after confirmation.Target: $81,429 – $81,258 (support zone).Stop-Loss: Above $89,991 (resistance zone).This setup suggests Bitcoin could decline further, making it a potential short trade opportunity. However, traders should watch for confirmation and overall market sentiment before executing trades.
Gold (XAU/USD) Bullish Breakout: Next Target $3,181?"

Key Observations:Current Price: Gold is trading at $3,127.450 at the time of the chart.Trend: The chart exhibits a strong uptrend, with higher highs and higher lows.Support Levels: Several support levels are marked in the $3,010 - $2,999 range, extending down to around $2,906.Resistance and Target:The immediate price range is highlighted, suggesting possible consolidation.A breakout above this range could lead to a target around $3,181.Chart Annotations:A retracement (red structure) indicates a short-term correction before continuation.A breakout structure (black lines) suggests a previous significant upward movement.The range and possible continuation are marked, indicating that the price may consolidate before attempting to reach the target.Trading Perspective:If price holds above the range, we may see bullish continuation towards $3,181.A break below support levels could signal a deeper pullback towards $3,010 or lower.This chart suggests a bullish outlook, with potential for more upside if momentum continues. Traders might look for confirmations before entering long positions.
"ETH/USD: Breakout Incoming? Buy Signal from Falling Wedge!"

It illustrates a downward trend with a falling wedge pattern, which is a bullish reversal pattern.Key Observations:Falling Wedge Pattern:The price has been trading within a downward-sloping channel.The wedge pattern suggests a potential breakout to the upside.Breakout Opportunity:The price is currently near the lower boundary of the wedge, suggesting a potential buying opportunity.A buy signal is indicated at a key support level.Target Price:The chart has a target zone around $2,531 – $2,562, which suggests an expected upward move.Technical Indicators:The price is currently around $1,815, indicating a possible bottom formation.A bullish move from this level is expected.Trading Idea:Entry: Buy near the current price ($1,815).Target: $2,531 – $2,562.Stop-Loss: Below $1,723 for risk management.This analysis suggests a bullish reversal with a potential breakout from the falling wedge. However, traders should confirm with volume and other indicators before entering a trade.
"Bitcoin Breakout Setup: Potential Rally Towards $94K!"

Key Observations:Support Zone: A crucial support level is marked below the broken channel, indicating a potential area for a price reversal.Bullish Projection: A breakout above this support level could push BTC higher towards the target price of 94,101.24 USD.Technical Patterns: The price initially showed a strong downtrend, followed by a recovery forming an ascending channel, and now a potential bullish breakout is expected.Trading Plan:Bullish Scenario: If BTC holds above the support level, a strong move upwards toward 94,101.24 USD could be expected.Bearish Scenario: A failure to hold support could result in further downside toward lower key levels.Conclusion:Traders might look for buying opportunities near the support zone with a potential upside target of 94,101.24 USD while managing risk in case of further breakdown.Would you like to refine this further or add specific indicators? 🚀
"Gold (XAU/USD) Approaching 3,110 – Sell Setup in Play?"

The price is in an uptrend, making higher highs and higher lows.A potential reversal zone is identified around $3,110, marked as a possible sell entry.The chart suggests that after reaching $3,110, the price may decline towards the support zone at $3,010 - $2,999.Confirmation of the sell trade can be considered if price action forms a bearish structure around resistance.Key support levels are at $3,010, $2,999, and $2,981, which could act as potential take profit targets for short positions.Trading Strategy:Sell Entry: Around $3,110, if resistance holds.Target: $3,010 - $2,999 zone.Stop Loss: Above $3,120 to manage risk.This idea follows technical price action, making it crucial to watch for confirmation signals before executing a trade. 🚀📉
(ETH/USD) Poised for a Major Breakout

Market Structure & Analysis:Falling Wedge Breakout: Ethereum previously broke out of a falling wedge pattern, which is a bullish reversal signal.Ascending Triangle Formation: Price is currently forming an ascending triangle, indicating potential for a breakout.Support Levels:$2,021 – Local support.$1,926 - $1,873 – Strong demand zone.Resistance Levels:$2,120 - $2,251 – First resistance zone.$2,531 - $2,564 – Final bullish target zone.Trading Plan:Buy Setup:Enter long on breakout above $2,120 with strong momentum.Stop Loss: Below $2,021 (support level).Take Profit Targets:TP1: $2,251 (first resistance).TP2: $2,531 (main target).TP3: $2,564 (extended bullish target).Risk Factors:A failure to break $2,120 could result in a pullback to $1,926.Macroeconomic factors or Bitcoin’s movement may impact Ethereum’s trend.
Disclaimer
Any content and materials included in Sahmeto's website and official communication channels are a compilation of personal opinions and analyses and are not binding. They do not constitute any recommendation for buying, selling, entering or exiting the stock market and cryptocurrency market. Also, all news and analyses included in the website and channels are merely republished information from official and unofficial domestic and foreign sources, and it is obvious that users of the said content are responsible for following up and ensuring the authenticity and accuracy of the materials. Therefore, while disclaiming responsibility, it is declared that the responsibility for any decision-making, action, and potential profit and loss in the capital market and cryptocurrency market lies with the trader.