
OzgunDashdan
@t_OzgunDashdan

What symbols does the trader recommend buying?
Purchase History
پیام های تریدر
Filter
OzgunDashdan
LTCUSDT LONG POZİSYON
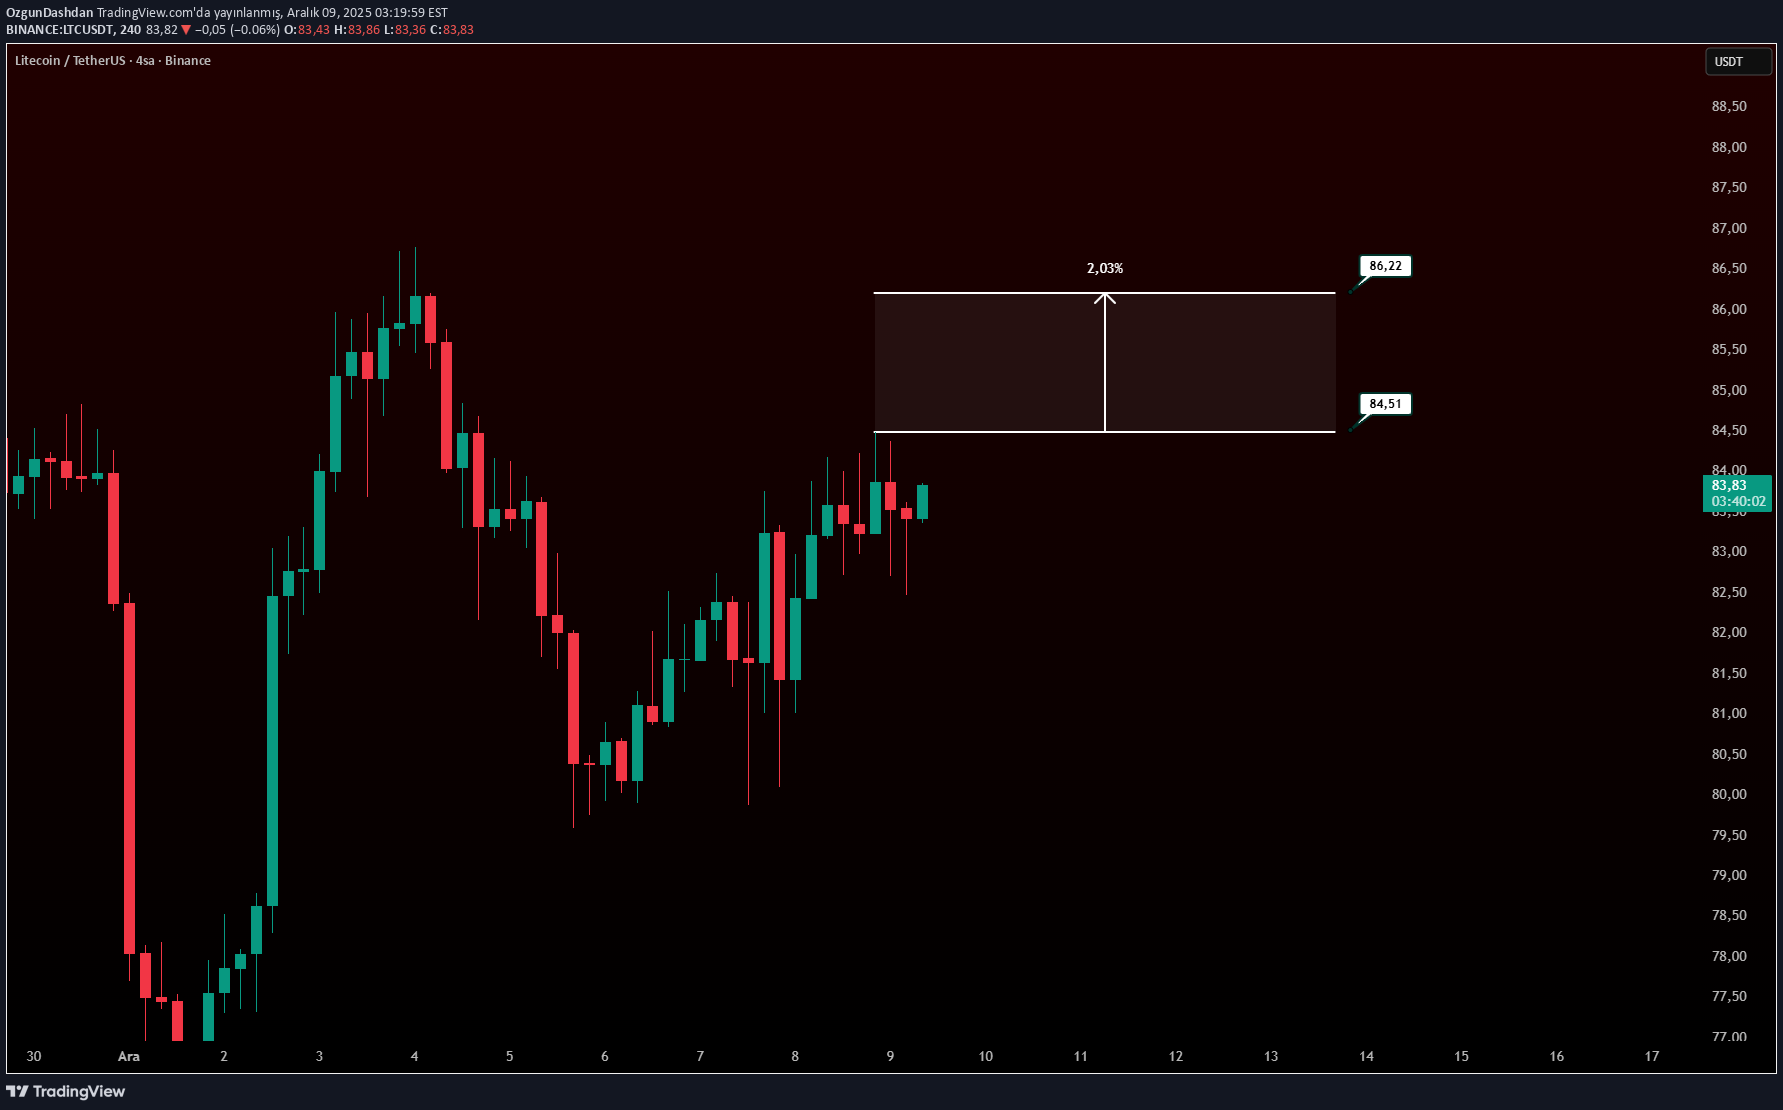
Entry: 84.51 Stoploss: 1/3 Take Profit: 86.22 Do not open a trade without using stoploss and prepare your orders before entering the position! Take a risk with a small percentage of your cash, be careful as we are before the data week and interest rate decision!
OzgunDashdan
تحلیل و استراتژی ترید روزانه BCH: ورود و خروج دقیق با تأیید کندلها
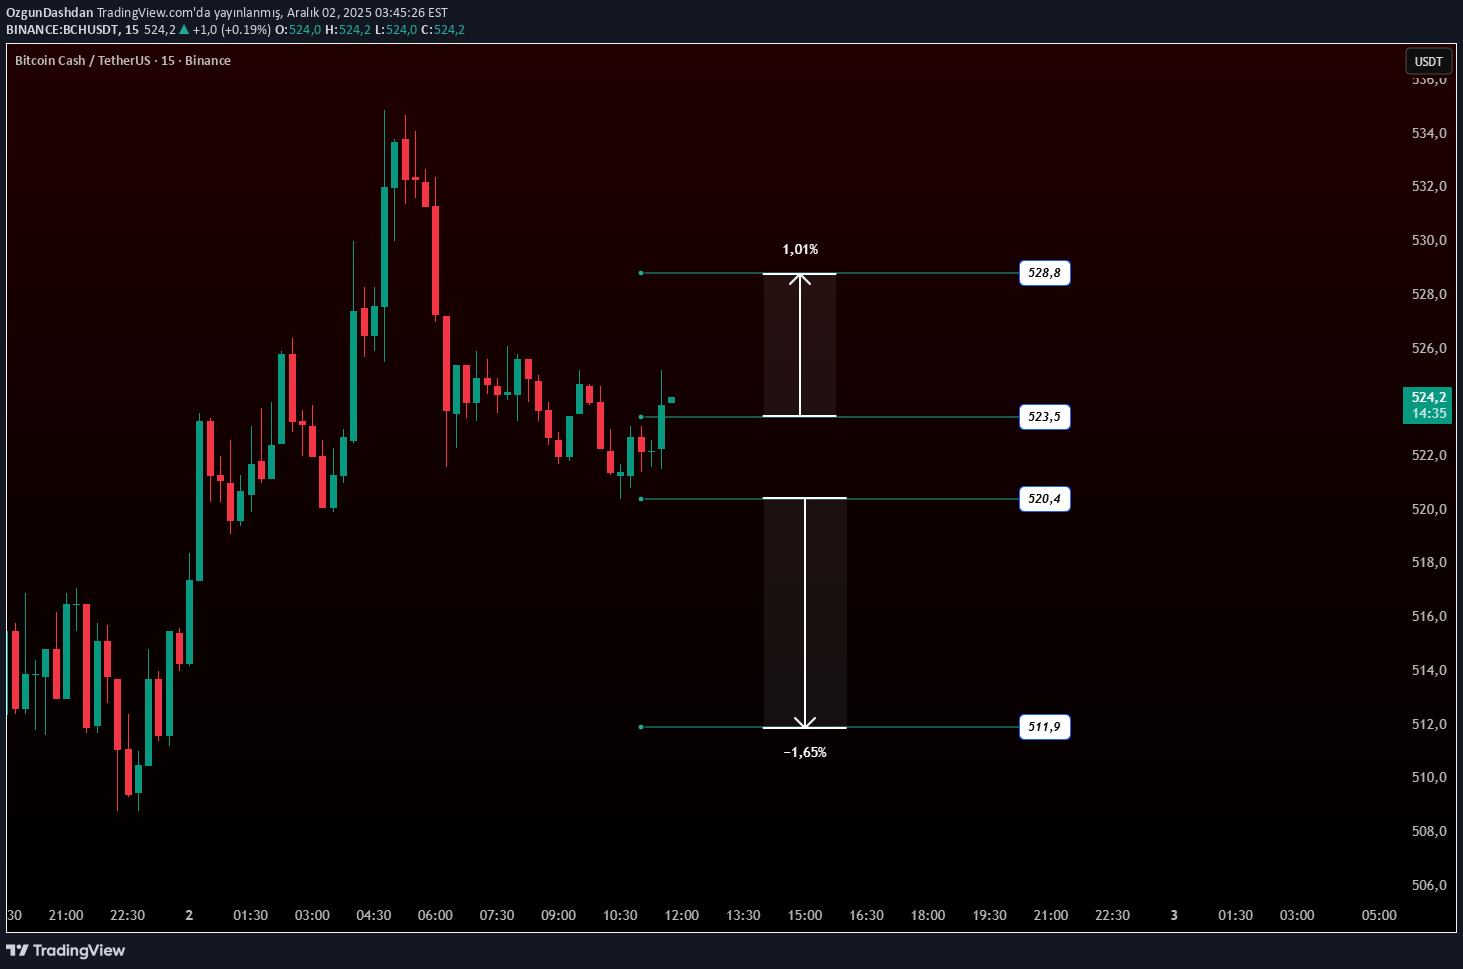
LONG ENTRY 523.5 STOPLOSS: 1/2 TAKE PROFIT 528.8 SHORT ENTRY 520.4 STOPLOSS: 1/2 TAKE PROFIT 511.9 Two candle confirmations in the same direction should be expected on the 15-minute chart. Two red candles for short Two green candles for Long
OzgunDashdan
ترید روزانه بیت کوین: استراتژی دقیق ورود لانگ و شورت (با تاییدیه کندل)
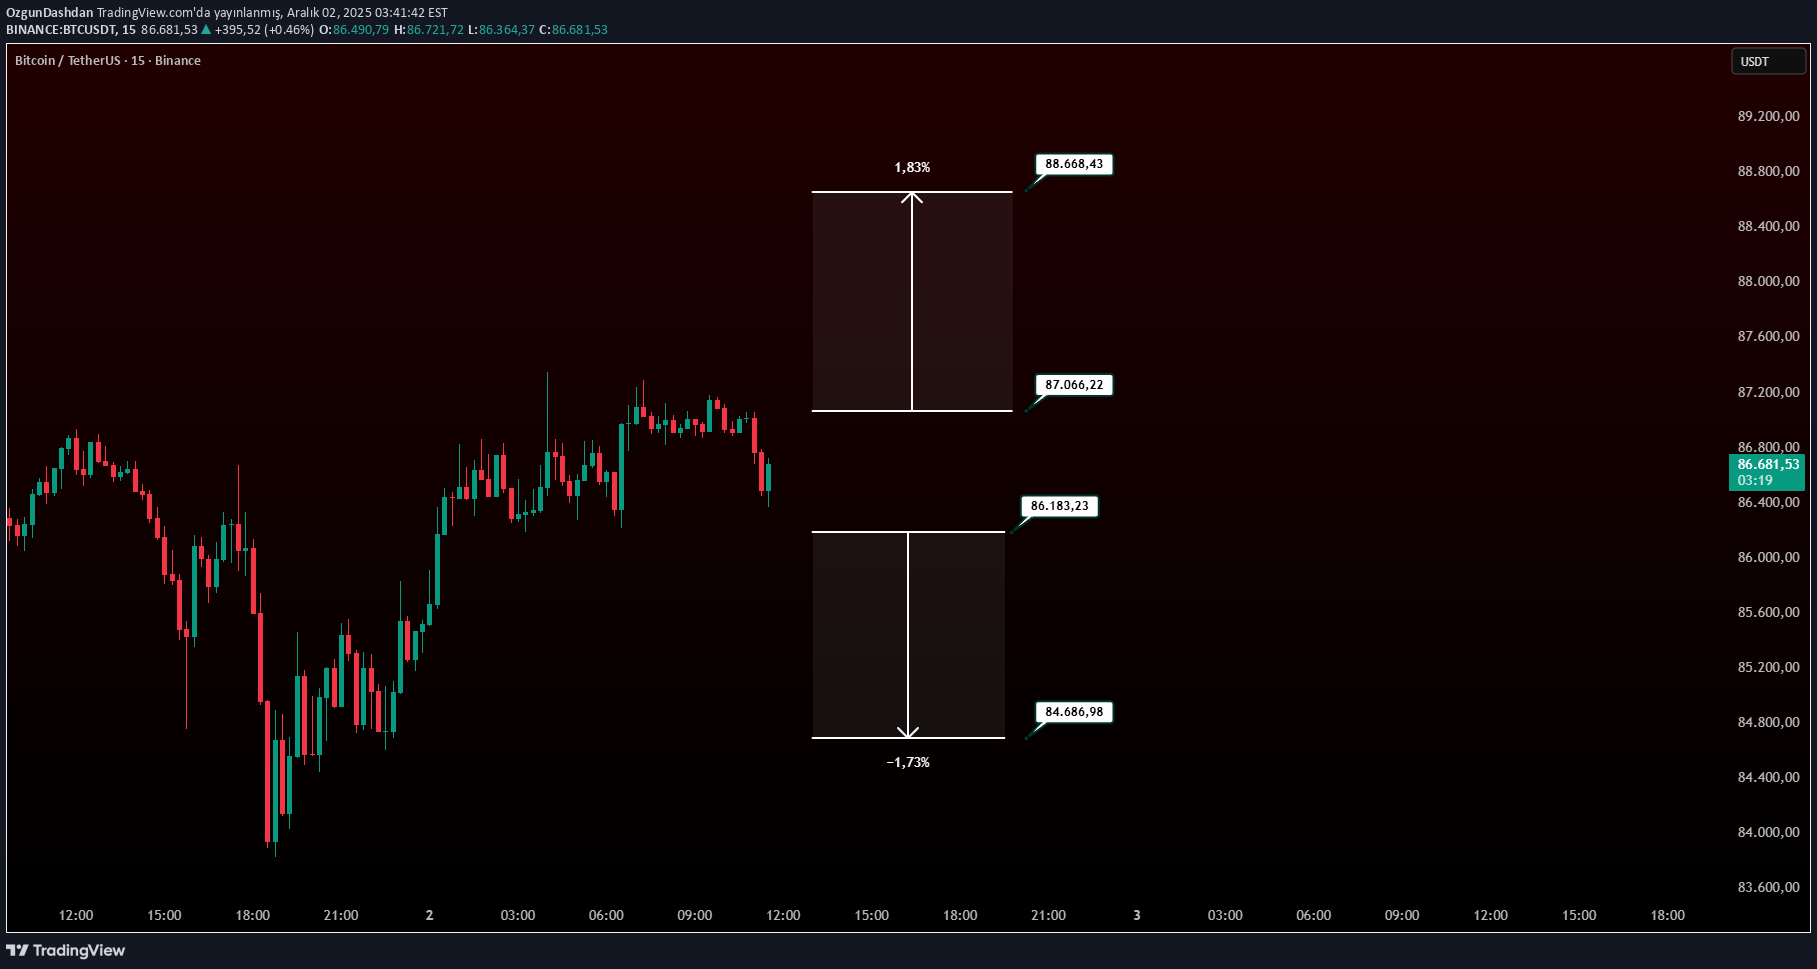
long entry: 87066.22 stop loss: 1/2 take profit: 88668.43 Short entry: 86183.23 stop loss: 1/2 take profit: 84686.98 Two candle confirmations in the same direction should be expected on the 15-minute chart. Two red candles for short Two green candles for Long
OzgunDashdan
سیگنال ورود فوری: پیشبینی سقوط دوج کوین (DOGE) با جزئیات کامل!
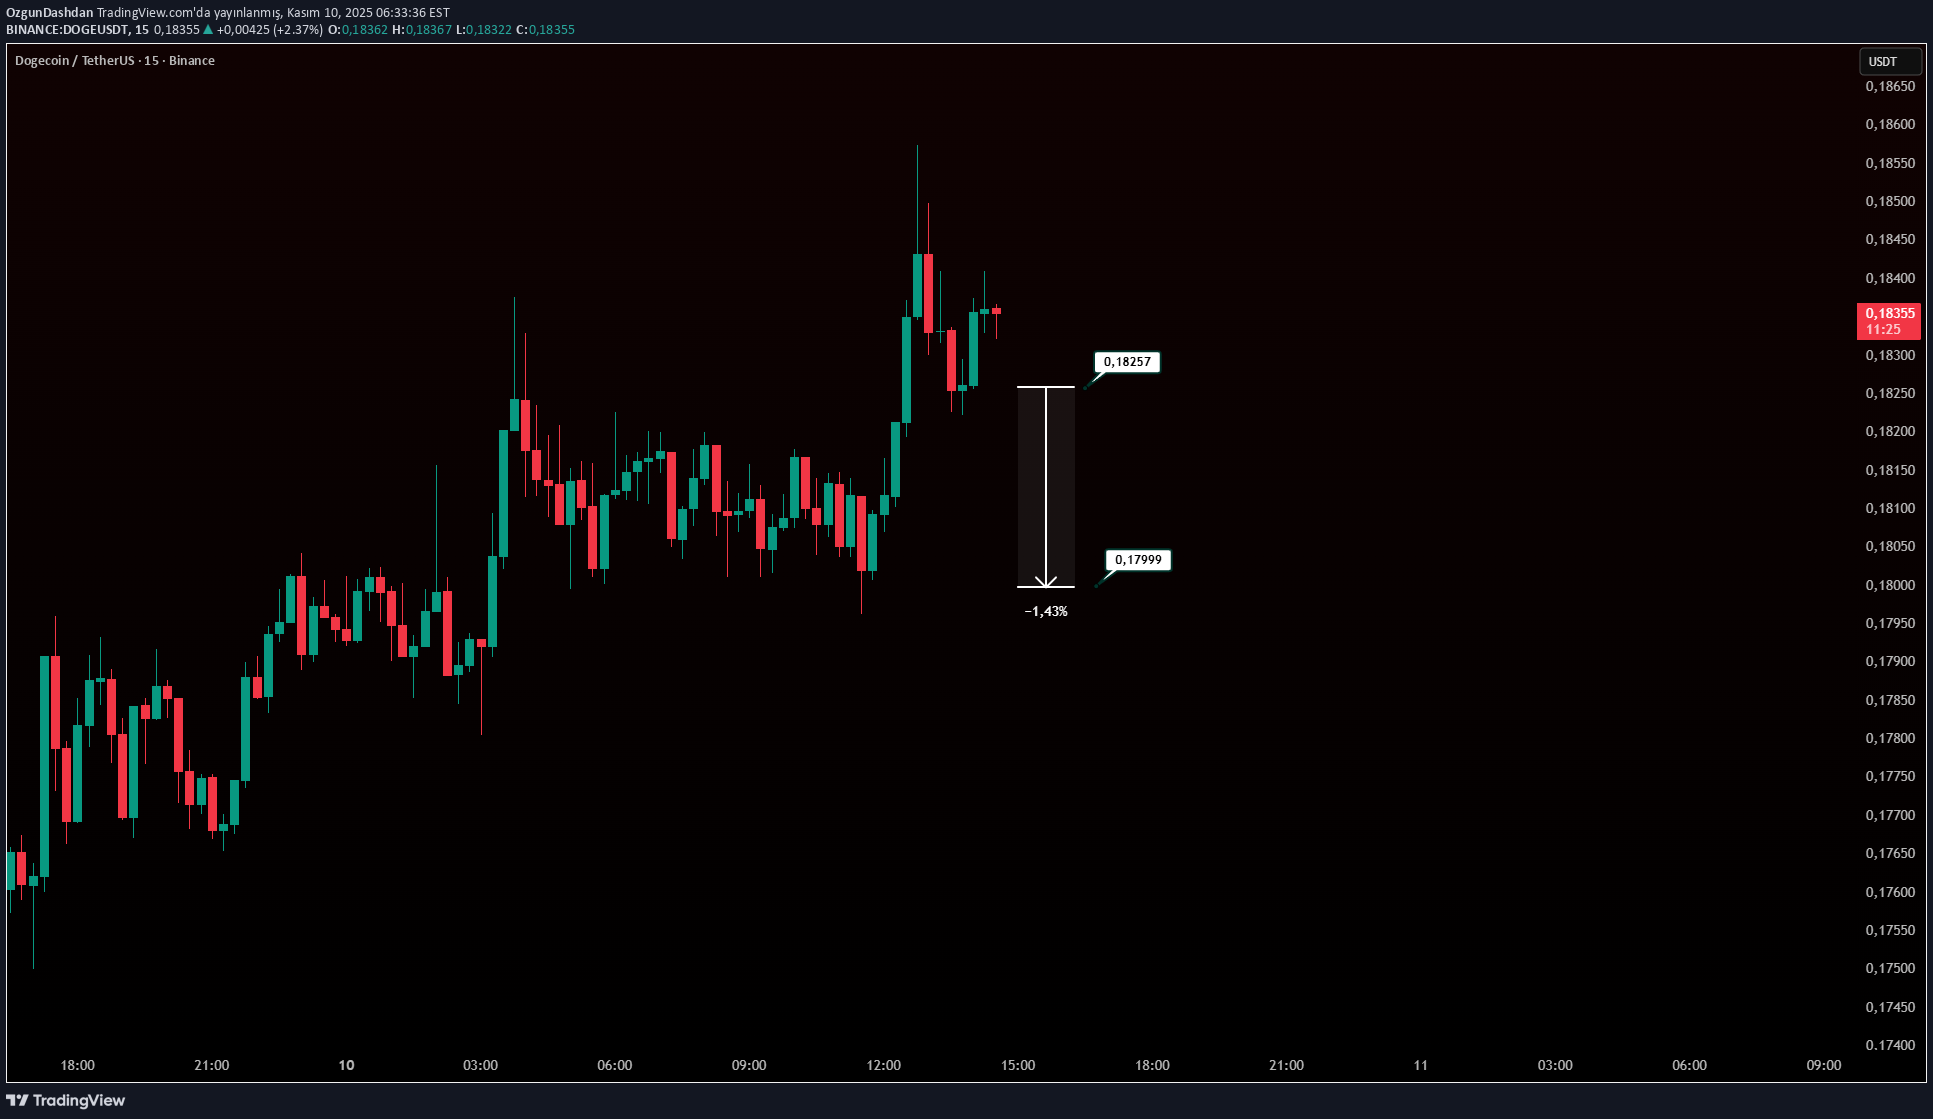
Entry: 0.18257 Take Profit: 0.17999 Stoploss: 1/3 Expect two red candle closes on 15-minute candles at the entry level. When these conditions are met, you can enter the position!
OzgunDashdan
تحلیل بیت کوین (BTCUSDT): آیا سقوط ادامه دارد؟ سطوح حیاتی و سناریوی پیش رو
BTCUSDT Analysis Bitcoin updated the local bottom at 98,900 during a fresh liquidation wave as it tested the 100,000 region. The market is weak; The bulls are waiting for the panic to pass. Following the sharp decline, a pullback phase is currently occurring. In this process, the price may retest the break-even and interest zones, which are previously broken support zones. Buyers are not showing strongly in the market at the moment. There is an intermediate bottom at 98.900 in the short term. On the upper side, the 105,200 level represents the upper limit of the local price range. The range 105.200 – 107.200 – 108.200 is important; because there is a liquidity pool in these regions for downward movement. The market maker (Market Maker) can pull the price down to these liquidity zones and then return it to the trading range. Technical Levels Resistance: 105.182, 107.271 Support: 101.130, 98.900 Possible scenario: If the price retests the 105.182 resistance, but the rise does not continue, this level can be confirmed as a false breakout. This may trigger the price to fall towards local targets again. However, the possibility of the price rising to the 107.270 – 108.200 band for a short time should not be ignored. However, in general terms, there is no signal of trend reversal yet.
OzgunDashdan
تحلیل بیت کوین (BTCUSDT): راز دوقلو کف و مسیر صعودی میانمدت!

The validity of the dual foot formation depends on the condition that the price will be closed with a green candle above 117,900 levels. If this happens, the primary target will be 124,474 levels. Momentum indicators in the daily graph also signal in favor of rise.
OzgunDashdan
تحلیل فوری بیت کوین (BTCUSDT): آیا ریزش در راه است؟ (تا 117.900)

I expect that the momentum will weaken after the 117,900 level is tested and strong sales will be realized in these regions. The price is currently in the premium zone and a significant price imbalance during the rise has been formed. I think the market will tend to clean this imbalance in the short term. My short -term expectation is that the rise wave continues for a while; It is then the start of a decrease movement with the loss of momentum. This analysis only applies to short term. Should be evaluated accordingly. ⚠️ If the price closes above 117,900 levels, this scenario will be considered invalid.
OzgunDashdan
تحلیل DOGE/USDT: نقشه گنج (لیکوییدیشن) برای سود 15 درصدی و مدیریت ریسک حرفهای

Risk Management with Dogeusdt Analysis and Liquidation Data Price View (Dogeusdt): Dogecoin Tests the strong daily trend line and support zone. If this level is preserved, the price has the potential to move to the resistance of 0.28 with a 15 %rise. Entry: 0.25058 Take Profit: 0.28 Stoploss: 1/2 Market Psychology and Liquidation Clusters Liquidation zones are the traps used by major investors to direct the market. In periods of collective fear, excessive emotional processes cause false positions. It is risky to carry out high volume operations in these regions; Disciplined risk management is essential. Technical Risk Management Approaches Liquidation data + candle analysis: Safety input levels. ATR: Volatility Measurement → Really Stop Loss Distance Determination. VWAP: Average price and direction determination. Multiple time periods: Short -term movement + Follow the big trend at the same time. Position Size: Reduces the risk of decreasing the volume of the process in liquidation clusters. OPPORTUNITY AREAS In areas where one -way liquations are intense, the price tends to reversal. Combining liquidation data with RSI and MACD provides more robust input approval. Processing over 70 %liquidation density is considered to be overly risky. Vehicles to be used on tradingView Liquidation Data → Determine risk clusters. Volume Profile → Seeing critical supply-demand levels. ATR & VWAP → Technical Base for Stop/Snow levels. Alarm installation → Get notification when approaching the risky area. Summary and Recommendations Be sure to check the liquidation clusters before opening the process. Staying on a single indicator; Combined with ATR, VWAP, RSI, MACD. Position size and Stop Loss Flexible Adjust the market behavior.
OzgunDashdan
SHIBUSDT | GÜNLÜK ANALİZ

Shıbusdt shows a strong potential by breaking the falling wedge structure, which is a classic bull's return formation. What makes this movement even more convincing is the bull mismatch seen in RSI, MACD and stochastic RSI. All these indicators are aligned to support the upward movement of the price. After the re-testing of the support line in a healthy way from the current price level, the installation still provides a 1: 3 risk-core ratio for short-term investors, which is a very solid opportunity. For those who target higher risk-informal opportunities, expecting a more pronounced rejection can allow them to enter with more strict risk parameters. However, the disadvantage of this approach is that if the market does not give a second chance, the movement has the risk of completely abduction. The critical point here is that if the price breaks down and closes below the level of invalidity, this bull scenario becomes completely invalid. In this case, the approach, which is much smarter, is to stand aside and wait for a cleaner price movement and a high probability installation. Momentum is in favor of the decline for now. * We are at a significant level of support. * If a red candle closure comes below 0.00001150, Short position will take place. * If the closing of green candles above 0.00001237 comes, the long position will be triggered. Long position Entry: 0.00001237 Stoploss: 1/3 Take Profit: 0.00001361 Short position Entry: 0.00001150 Stoploss: 1/3 Take Profit: 0.00001061
OzgunDashdan
BTC Kısa Vade Ayı Bayrağı - 4H Grafik

BTC Short Maturity Bear Flag - 4H Graphics In addition to the latest BTC review I shared, I prepare this analysis for short -term look. I think the bear flag formation will work for a while. When we look at the Momentum indicators, we see that they all return to positive and give long signals. However, this ascension movement is only a correction in the general decline trend. Even though I wait for a upward correction movement in the short term, I think that the downward trend will continue. The possible level that we can see in this process is 117,900 regions, the last hill. If the market can close above this level, we can think that the trend has changed direction and a long -rowing structure is formed. With my general perspective, I would like to point out that our direction is still inferior. There is no change in my decision; I will share new developments and updates in the following analysis.
Disclaimer
Any content and materials included in Sahmeto's website and official communication channels are a compilation of personal opinions and analyses and are not binding. They do not constitute any recommendation for buying, selling, entering or exiting the stock market and cryptocurrency market. Also, all news and analyses included in the website and channels are merely republished information from official and unofficial domestic and foreign sources, and it is obvious that users of the said content are responsible for following up and ensuring the authenticity and accuracy of the materials. Therefore, while disclaiming responsibility, it is declared that the responsibility for any decision-making, action, and potential profit and loss in the capital market and cryptocurrency market lies with the trader.