
NuggetsWarriors
@t_NuggetsWarriors

What symbols does the trader recommend buying?
Purchase History
پیام های تریدر
Filter
NuggetsWarriors
Today's gold trading analysis
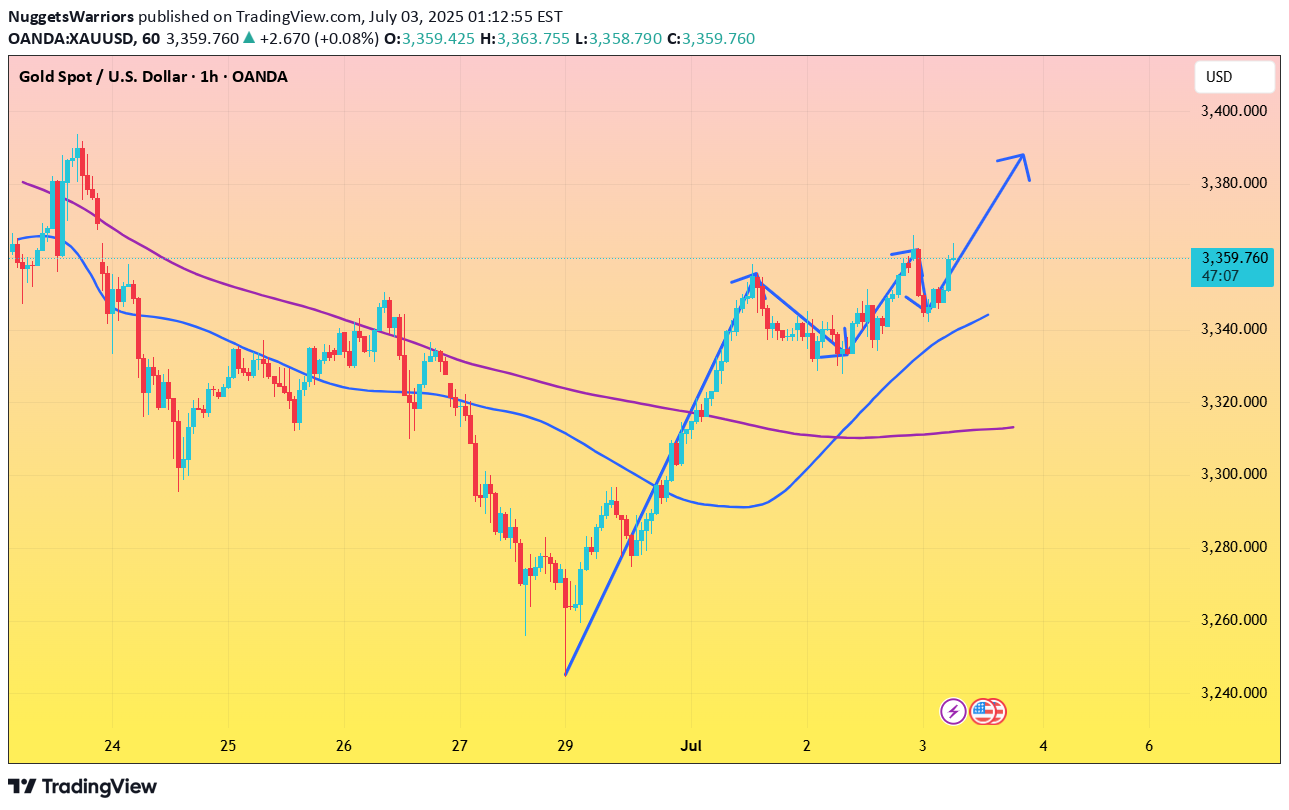
Technical Review:Technical gold closed strongly on the daily line, and the continuous positive structure broke through the 3350 mark. The New York closing price stood above the MA10-day moving average of 3336, breaking through the middle track of the Bollinger Band at 3348. The price of the short-term four-hour chart extended the high point of the moving average to move up, the Bollinger Band opened upward, and the price was running in the middle and upper track. The hourly moving average opened upward and the Bollinger Band opened upward. Gold fluctuated upward, and intraday trading pulled back to buy at a low price. After the early morning rush, the Asian session came to a sudden brake, rising to 3365 and then falling below 3341. Tonight, the variables on the eve of non-agricultural are relatively large. At present, it is a relatively obvious wide-range oscillation structure. Today, focus on 3330. The ADP data of the next day recorded a negative number of "small non-agricultural" people, which was the largest drop since March 2023, which may further strengthen the expectation of interest rate cuts and benefit spot gold.Today's analysis:Gold is still in a rhythm of fluctuating upwards, and the trend is still biased towards buying. The rise is not the top, and gold will continue to be bought to the end. Gold buying is in full swing, and there is hope for further gains!Gold’s 1-hour moving average continues to form a golden cross and the buying arrangement diverges upward. Gold buying still has upward momentum. Gold continues to rise after the Asian session opens to a new high in recent days. So gold is obviously still in a buying trend. Although gold has adjusted during the day, in the short term, gold above 3330 is an opportunity to buy on dips!Operation ideas:Short-term gold 3330-3333 buy, stop loss 3322, target 3360-3380;Short-term gold 3363-3366 sell, stop loss 3375, target 3330-3310;Key points:First support level: 3332, second support level: 332, third support level: 3308First resistance level: 3366, second resistance level: 3378, third resistance level: 3387
NuggetsWarriors
XAU/USD(20250703) Today's Analysis
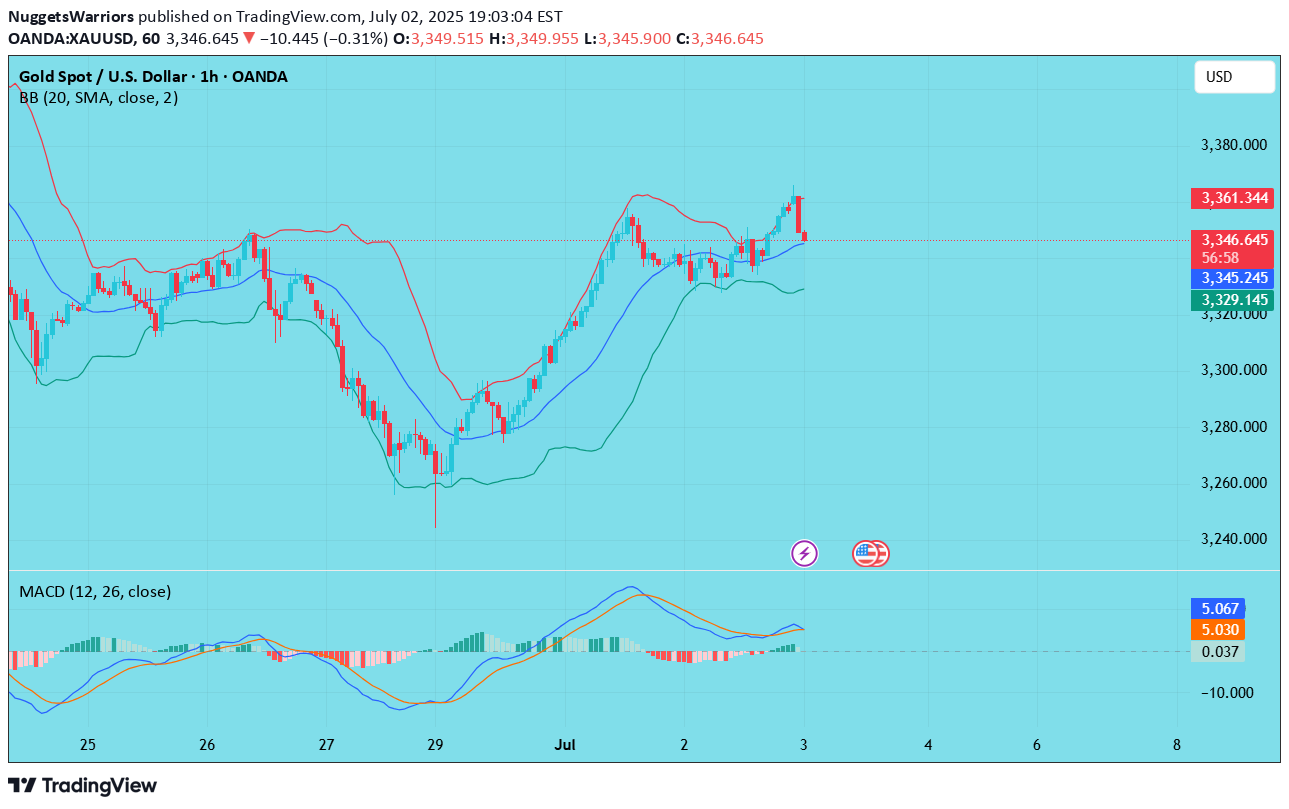
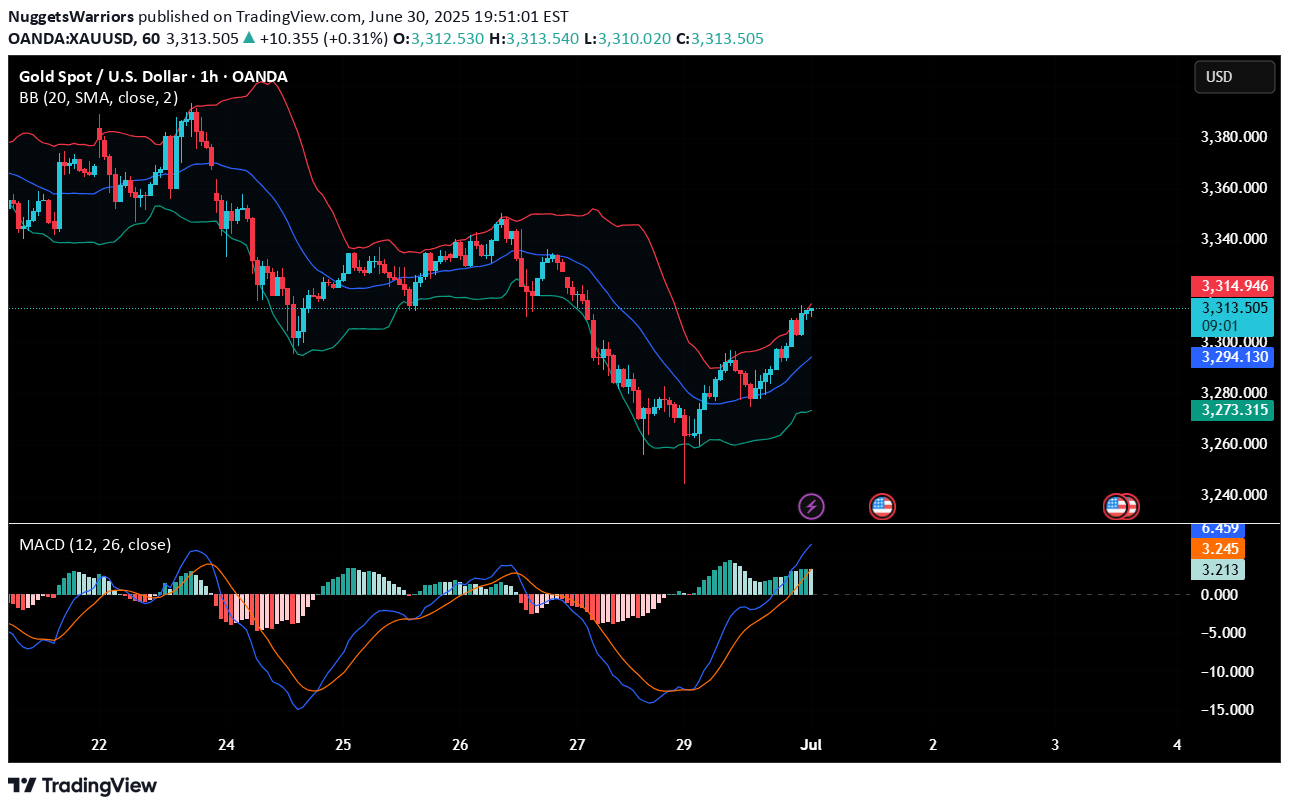
Market news:U.S. June employment data: ADP employment fell by 33,000 in June, the largest drop since March 2023; Challenger layoffs in June were 47,999, the lowest since December 2024; interest rate futures almost fully priced in the Fed's September rate cut.Technical analysis:Today's buying and selling boundaries:3348Support and resistance levels:338033683360333533273315Trading strategy:If the price breaks through 3360, consider buying in, with the first target price of 3368If the price breaks through 3348, consider selling in, with the first target price of 3335
NuggetsWarriors
XAU/USD(20250702) Today's Analysis
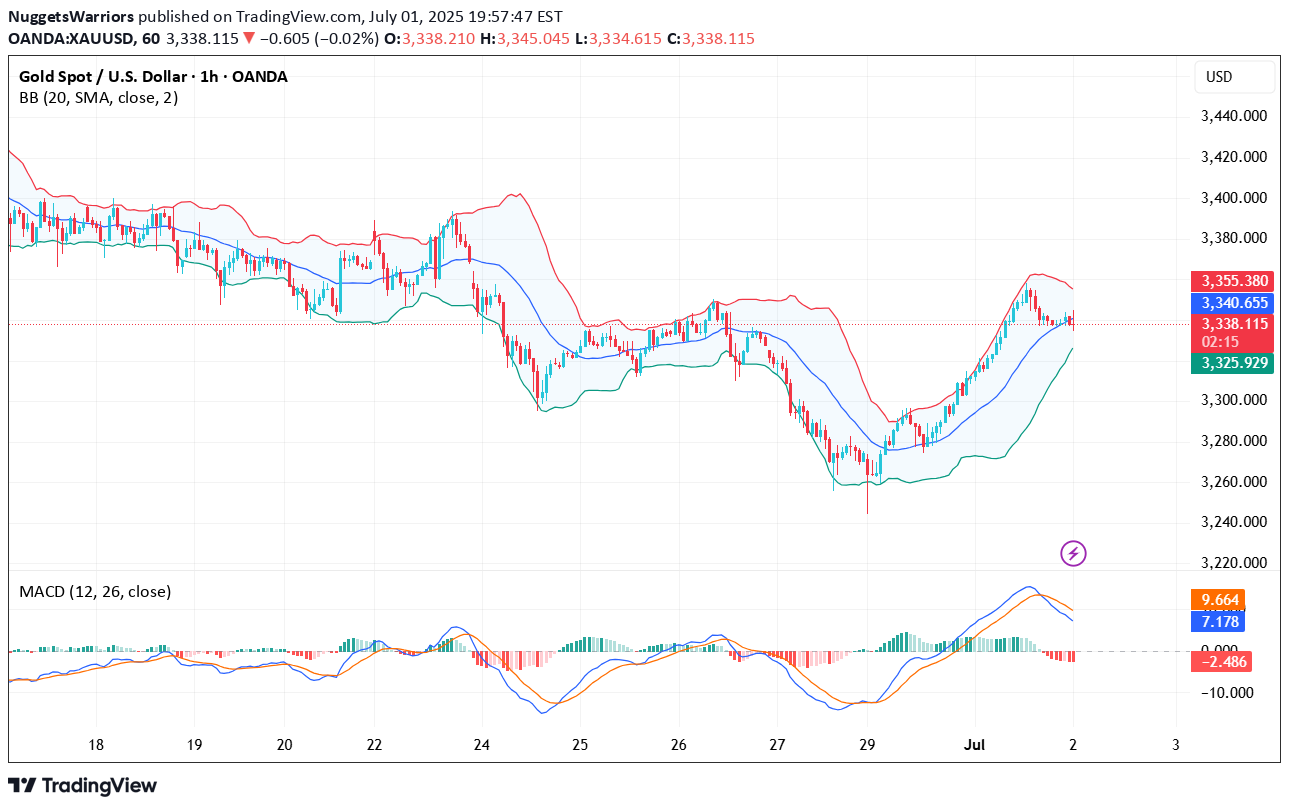
Market news:Jolts job openings in the United States unexpectedly rose to the highest level since November last year in May, and traders slightly reduced their expectations of a rate cut by the Federal Reserve.Technical analysis:Today's long-short boundary:3332Support and resistance levels:338733673354331132983277Trading strategy:If the price breaks through 3354, consider buying in, with the first target price of 3367If the price breaks through 3332, consider selling in, with the first target price of 3311
NuggetsWarriors
ETH-----Sell around 2475, target 2430-2405 area
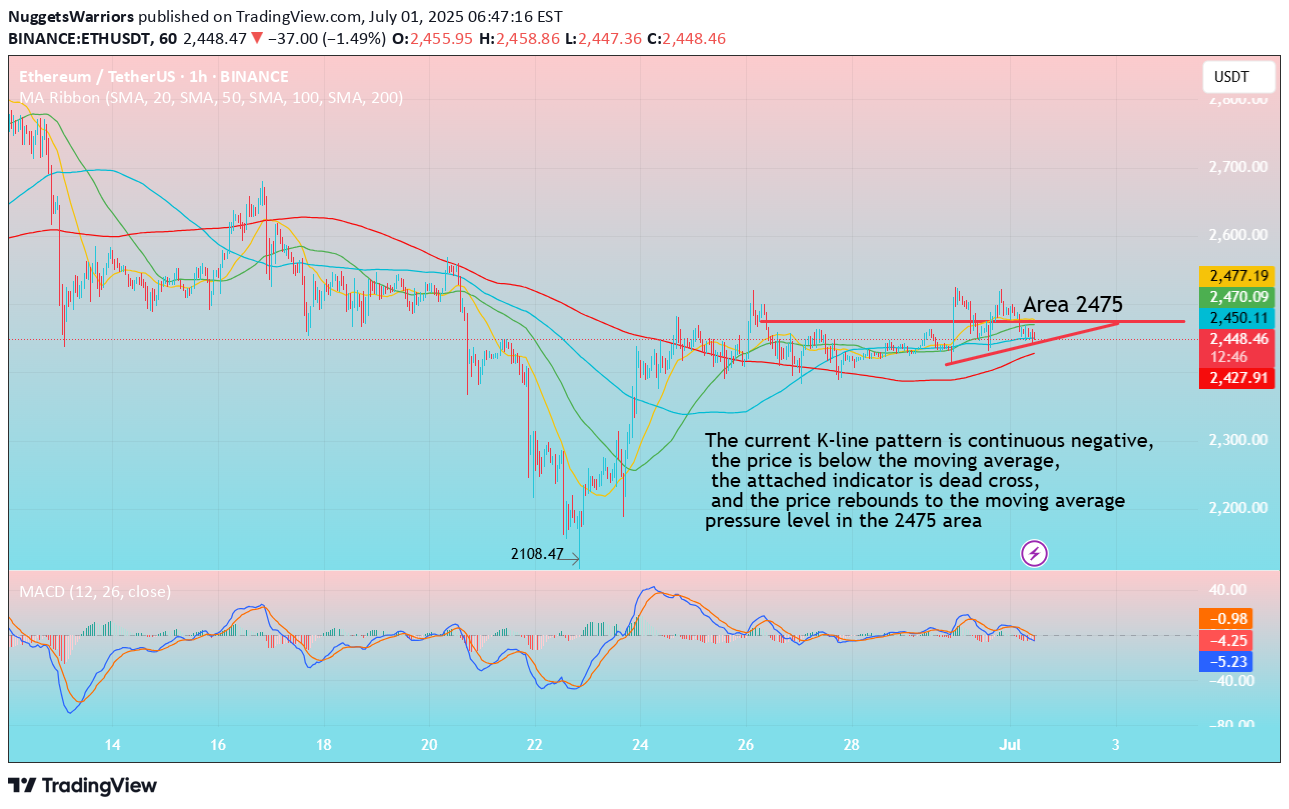
Technical analysis of ETH contract on July 1:Today, the large-cycle daily level closed with a small negative line yesterday, the K-line pattern was a continuous positive single negative, the price was at a high level, and the attached indicator was running in a golden cross. The overall upward trend is still very obvious, but it is still necessary to emphasize the risk of a large price retracement. Trading continues to be short-term and just follow the trend; the short-term hourly chart currently continues the overall trend of yesterday, the K-line pattern is a continuous negative, the attached indicator is running in a dead cross, and the price is below the moving average, so it is likely that the decline will continue during the day, and the lower low point will focus on the 2430 area; in addition, the price returns to the moving average pressure position near the 2475 area;Today's ETH short-term contract trading strategy:Sell at the 2475 area when it rebounds, stop loss at the 2505 area, and target the 2430 break to see the 2405 area;
NuggetsWarriors
BTC-----Sell around 107200, target 106300-105700 area
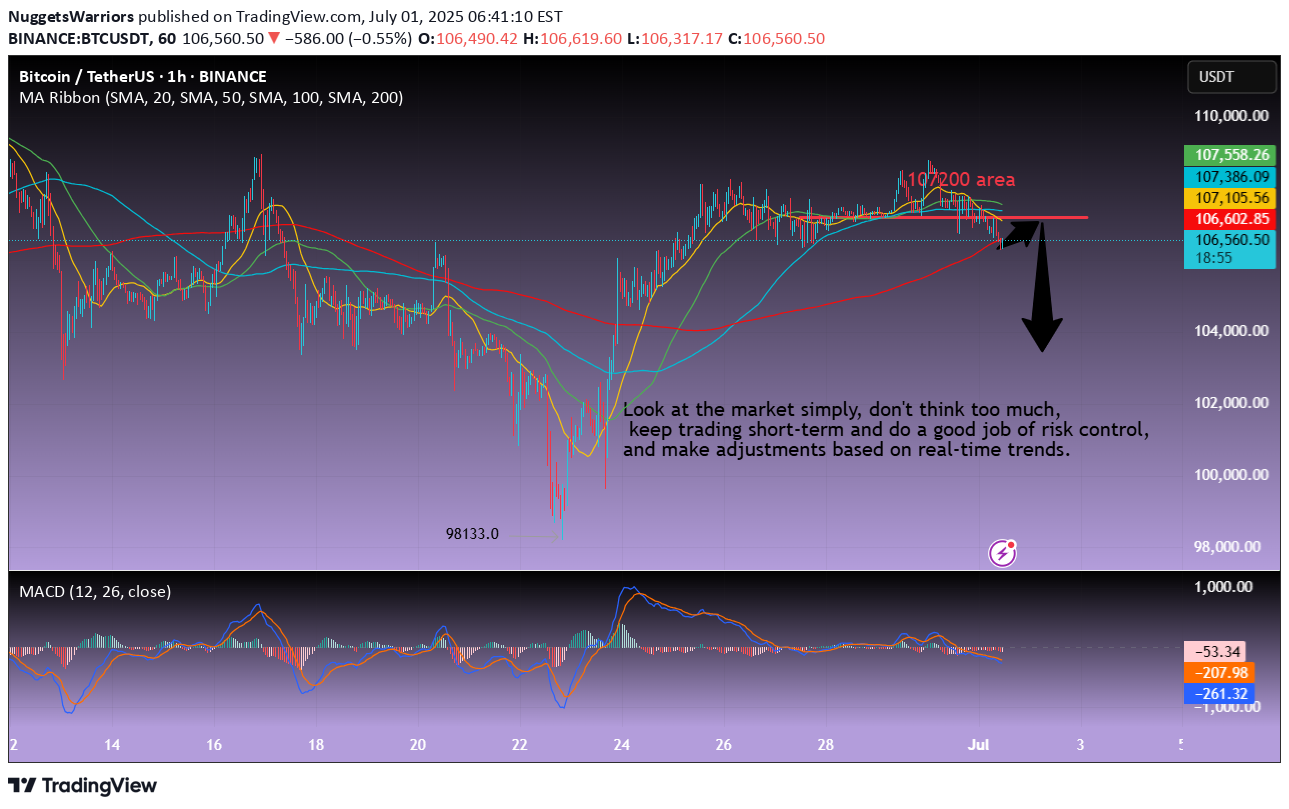
Technical analysis of BTC contract on July 1:Today, the large-cycle daily level closed with a small negative line yesterday, the K-line pattern was a single negative line, the price was above the moving average, and the attached indicator was a golden cross with a shrinking volume. The current general trend of rising is still relatively obvious, but the price did not continue yesterday and the downward correction trend still broke the starting point, so today we need to consider the issue of continuation; the short-cycle hourly chart currently continues the trend of the early morning, the K-line pattern is a single positive line, the price is at a low level and deviates from the moving average, and the pressure position of returning to the moving average is near the 107200 area, and everyone can see that the pullback is not strong, so today we still have to look at the continuity of the decline;Today's BTC short-term contract trading strategy:Sell at the pullback 107200 area, stop loss at the 107700 area, the target is to first look at the 106300 area, and then look at the 105700 area;Today we sold BTC at 107200. Now the market price has reached our strategy target and even exceeded our expectations. We have made a profit. Now we will analyze the next trading signal. If you need it, please contact me!The goal has been reached, we will analyze the next trading signal. If you need it, please click Contact Me to get it.
NuggetsWarriors
XAU/USD(20250701) Today's Analysis
Market news:The Chicago Business Activity Index in June fell slightly from 40.5 in May to 40.4, lower than the expected 43.0, the lowest level since January, which means that economic activity has shrunk for 19 consecutive months; the Dallas Fed Business Activity Index has shrunk for the fifth consecutive month.Technical analysis:Today's buying and selling boundaries:3286Support and resistance levels:334733243310326332483225Trading strategy:If the price breaks through 3310, consider buying in, the first target price is 3325If the price breaks through 3286, consider selling in, the first target price is 3263Today we bought gold at 3310. Now the market price has reached our strategic target and even exceeded our expectations. We have made a profit. Now we will analyze the next trading signal. If you need it, please contact me!The goal has been reached, we will analyze the next trading signal. If you need it, please click Contact Me to get it.
NuggetsWarriors
Gold-----sell near 3290, target 3260-3370
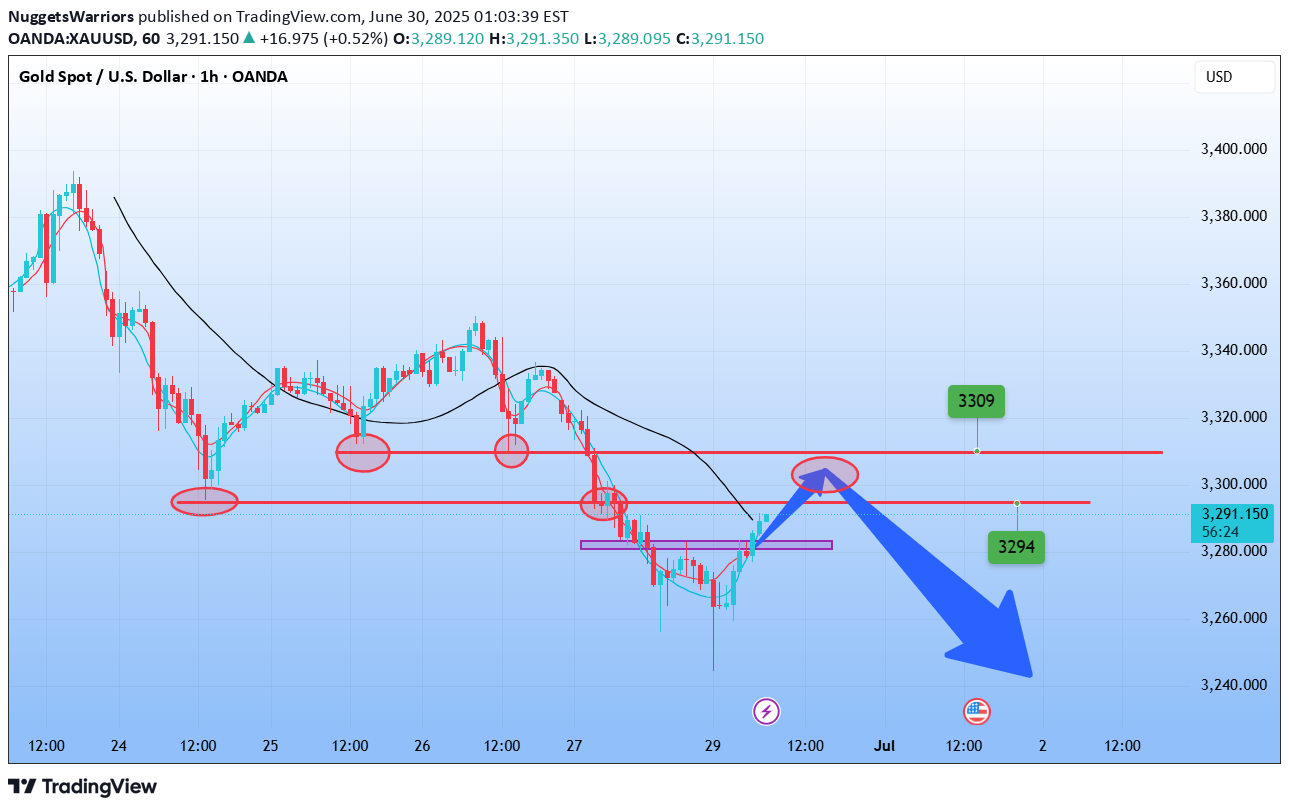
Gold market analysis:Last week, gold was basically a sell-off. It basically fell from Monday to Friday. There were two repairs in the middle. In the end, the daily line still closed with a negative line, and the weekly line broke the key support. The sell-off formed a new top in the cycle. If gold continues to decline this week, it is very likely to form a double top on the weekly line. The cyclical rise of gold is due to the situation in the Middle East. Now that the situation in the Middle East has eased, gold will enter a cyclical decline. In the short term, we should try to sell bearish at a high price. Today, Monday, I predict that gold will repair and rebound and continue to fall. There is a long tail in 4H, and it is difficult to fall in the short term. Today's idea is to buy short and sell long. There are only 4 days in the US market this week, there are holidays, and there are heavy data to be released.We cannot predict the height of its rebound in the Asian session. We can be sure that there is a double bottom in the hour and stabilization in the 4-hour session. The first small suppression is around 3282, and the strong suppression is 3294 and 3309. There is also an integer level of 3300 in the middle. I estimate that these positions will be obstacles to buying. If the Asian session first reaches around 3268, consider buying opportunities. If there is a rebound in the middle, you can also sell directly at the suppression position. The selling order takes a longer time.Support 3268-3263, strong support 3247, and the watershed between strength and weakness of the market is 3283.Fundamental analysis:This week is a data week, and there is a holiday on Friday, because the non-agricultural data on Friday will be announced in advance on Thursday.Operation suggestion:Gold-----sell near 3290, target 3260-3370Today, many friends lost a lot of money in this market, but my fans made huge profits with my help. This is how the market works. Some people lose money and some people make money. If you don’t have professional trading knowledge and skills, it will be very difficult for you to make stable profits in this market. But you can follow me. I will share real-time trading signals every day to help you make profits.
NuggetsWarriors
Analysis on subsequent gold price trend!
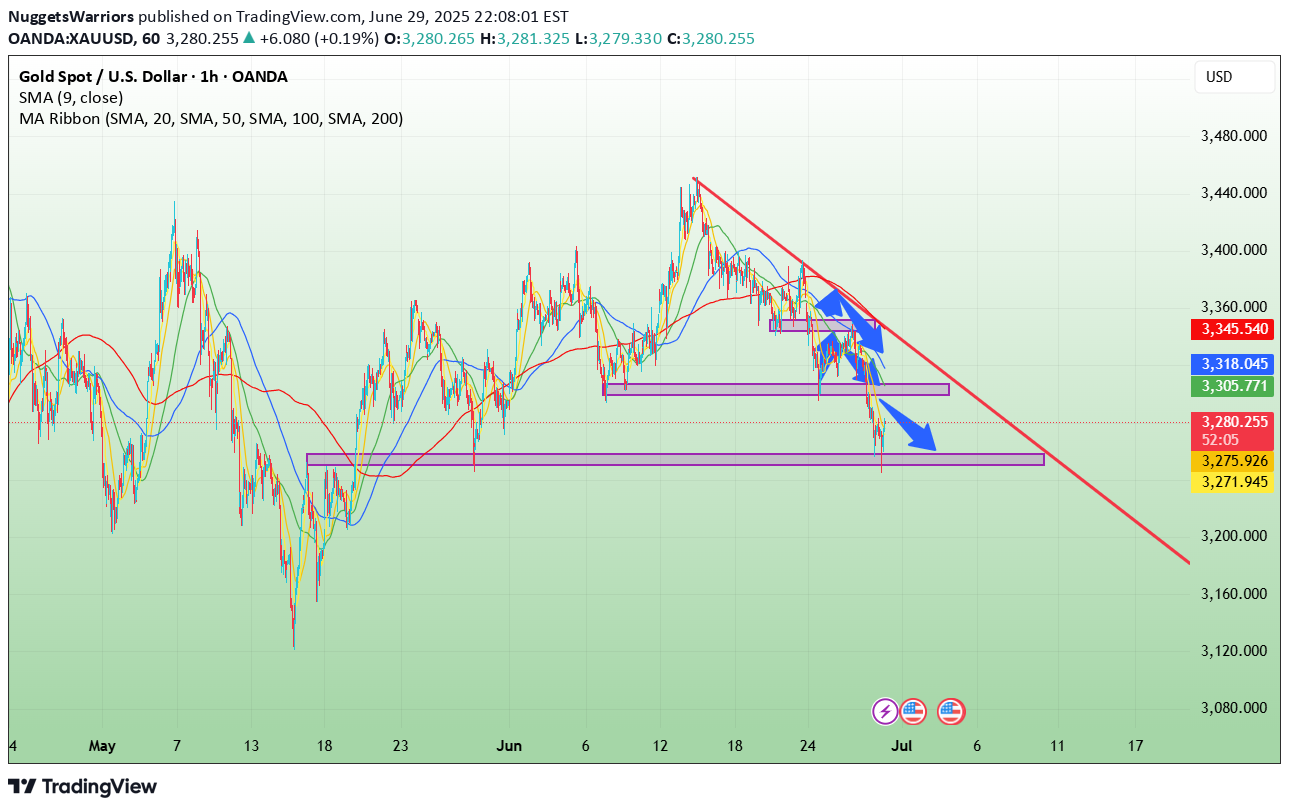
Market news:After the Asian trading session opened on Monday (June 30), spot gold fell sharply, with the London gold price falling to as low as $3,247/ounce, a sharp drop of nearly $30 during the day. Due to the ceasefire agreement between Israel and Iran and the easing of trade tensions, the market risk appetite has rebounded, weakening the brilliance of gold as a safe-haven tool. International gold plummeted last week, hitting a new low since May 29!Although the ceasefire agreement between Iran and Israel has been maintained, the geopolitical situation has not been completely calm. Trump made a tough statement last Friday, saying that he would consider bombing Iran again and abandoning the plan to lift sanctions on Iran. These events have reignited the market's risk aversion. Gold prices bottomed out and rebounded in early Asian trading on Monday, showing support for bargain hunting.This week will face the impact of the US non-farm payrolls report. It is necessary to pay close attention to key economic data and events this week, which will provide more clues to the Federal Reserve's monetary policy path and thus affect the trend of gold prices. Against the backdrop of geopolitical and economic uncertainties, the gold market may continue to show high volatility, and investors need to remain cautious and respond flexibly!Technical Review:Gold maintained a wide range of fluctuations. It opened high in the Asian session and rose to 3281.5 before falling sharply to 3247.8. After a large wash, it returned to above the 3270 mark. The MA10 daily moving average of the short-term four-hour chart opened downward, and the price continued to move down along the moving average. The RSI indicator ran on the lower track of the middle axis, and the price was in the middle and lower track of the Bollinger Band channel and was running short.The daily and weekly charts have a continuous negative structure, and the RSI indicator runs below the 50 value of the middle axis. Technically, the overall trend of gold is biased towards selling, but it should be considered that the recent trends are all wide-range structures with large price ranges, which are not easy to chase orders. Trading ideas: sell at a high price on the rebound and assist in buying at a low price.Today's analysis:Gold opened high and closed low in the Asian session, and the Asian session directly broke the low point of last Friday. The market direction remains weak. For our short-term layout direction, we still follow the general trend to rebound and sell! The key points above focus on the high point of 3283 in the Asian session, followed by the moving average pressure level of 3295. When the rebound reaches the upper resistance, you can start selling!The gold 1-hour moving average continues to cross downward and arrange for selling, and there is a possibility of further downward divergence. The selling momentum of gold is still very strong. After gold fell below the last low of 3295, gold did not have any strong rebound, but has been under pressure and fluctuated downward. Therefore, 3295 is still the key to gold trading in the short term. Gold continues to sell at high prices under pressure at 3295 during the day.Operation ideas:Buy short-term gold at 3252-3255, stop loss at 3244, target at 3280-3300;Sell short-term gold at 3293-3296, stop loss at 3305, target at 3260-3240;Key points:First support level: 3292, second support level: 3306, third support level: 3320First resistance level: 3268, second resistance level: 3253, third resistance level: 3242Today, many friends lost a lot of money in this market, but my fans made huge profits with my help. This is how the market works. Some people lose money and some people make money. If you don’t have professional trading knowledge and skills, it will be very difficult for you to make stable profits in this market. But you can follow me. I will share real-time trading signals every day to help you make profits.
NuggetsWarriors
ETH-----Buy around 2500, target 2565 area
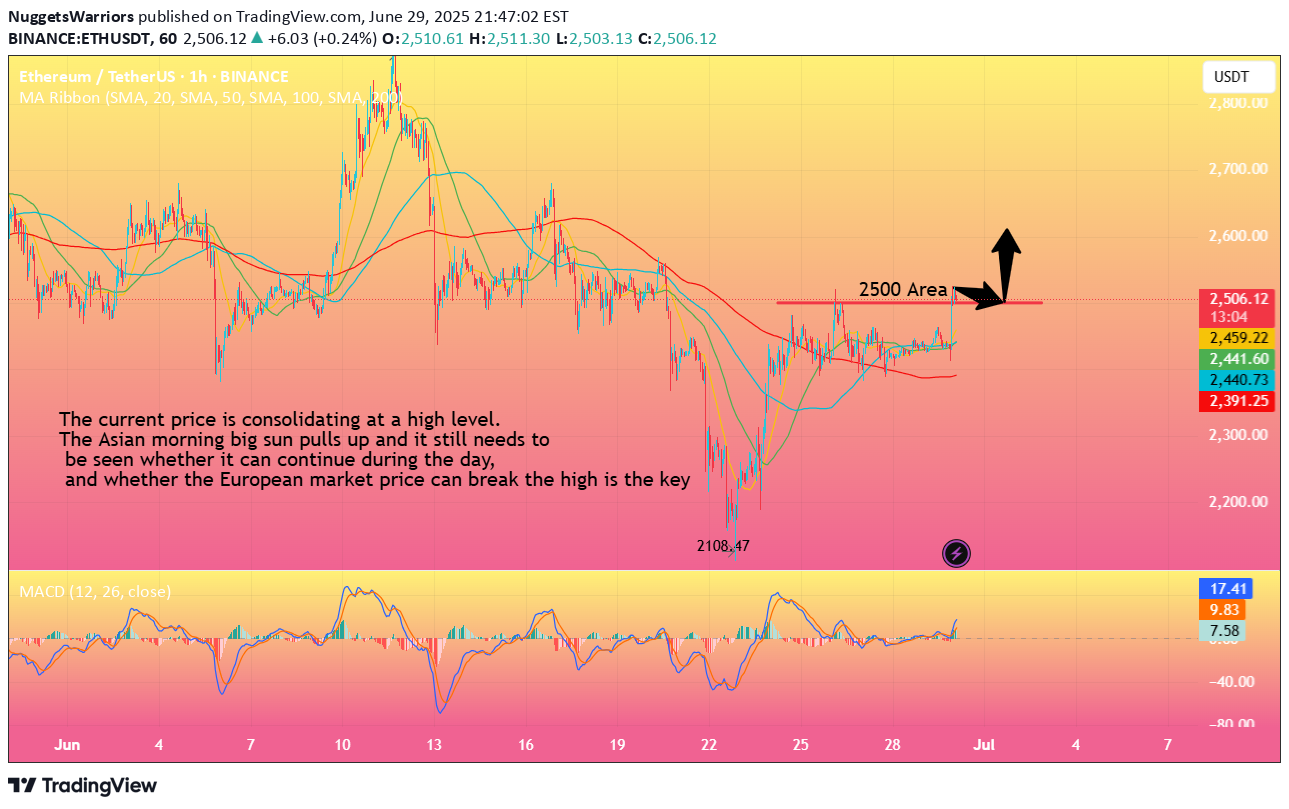
Technical analysis of ETH contract on June 30:Today, the large-cycle daily level closed with a small positive line yesterday, the K-line pattern was a continuous positive and a single negative line, the price was above the moving average, and the attached indicator was in a golden cross. The current rise in the general trend is very obvious, but the price has not shown a very strong trend or a trend of breaking high directly. In this way, the transaction should still be kept short to prevent the risk of a large price retracement; the short-cycle hourly chart rose in the morning, and the current price is consolidating at a high level. The attached indicator is in a golden cross, and the retracement small support position is near the 2500 area. If the rise continues during the day, the European session must break high, otherwise the US session will be difficult to continue.Today's ETH short-term contract trading strategy:Purchase at the 2500 area, stop loss at the 2470 area, and target the 2565 area;
NuggetsWarriors
BTC-----Buy around 108200, target 109200 area
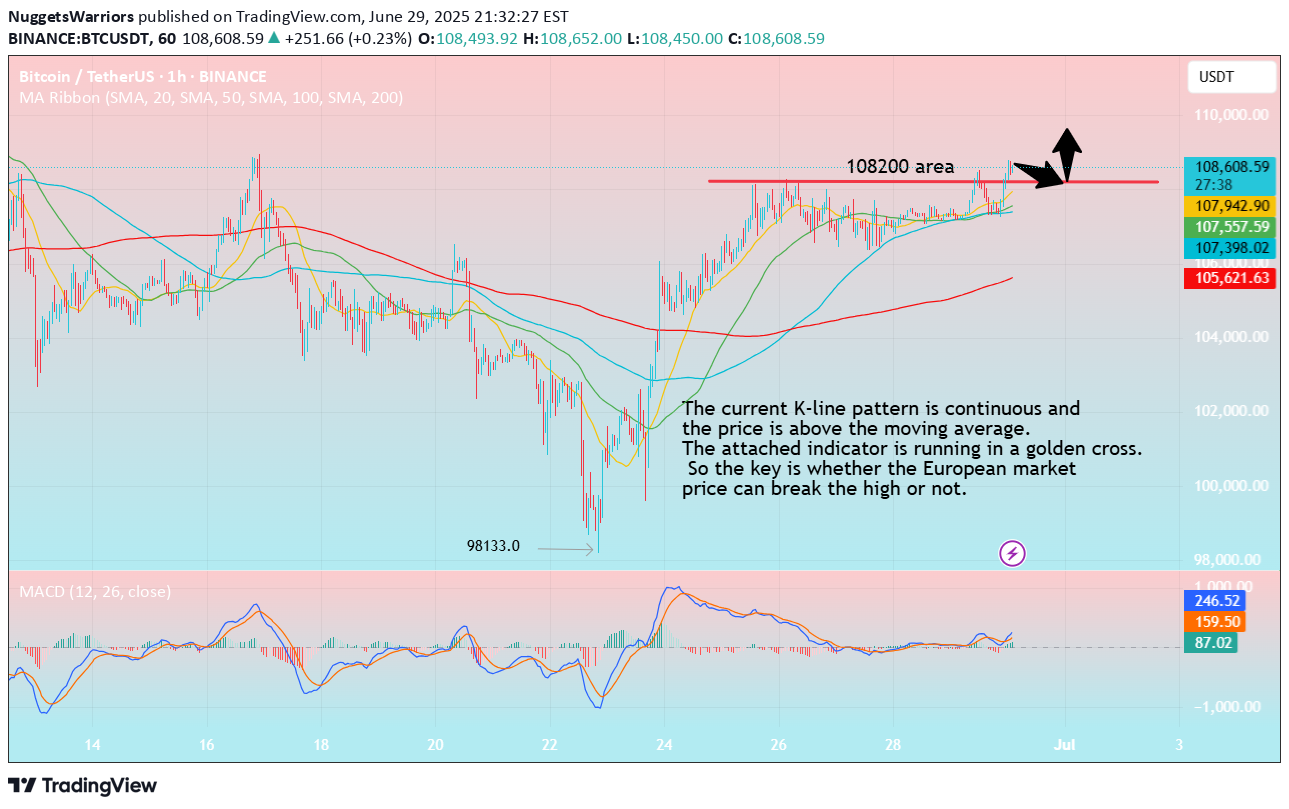
Technical analysis of BTC contract on June 30:Today, the large-cycle daily level closed with a small positive line yesterday, the K-line pattern continued to rise, the price was above the moving average, and the attached indicator was running in a golden cross. The general trend of rising is currently quite obvious. Although the price has not broken the high, the current continuation and strength are slowly showing signs, so breaking the high is just a matter of time, and trading is still mainly short-term; the short-cycle hourly chart Asian morning price support rebound, the low point is near the 1107200 area, the current K-line pattern is continuous, the price is above the moving average, and the attached indicator is running in a golden cross, so there is still a high probability of intraday rise, so what needs to be paid attention to is whether the European session has broken the high.Today's BTC short-term contract trading strategy:Purchase at the 108200 area when retreating, stop loss at the 107700 area, and target the 109200 area;
Disclaimer
Any content and materials included in Sahmeto's website and official communication channels are a compilation of personal opinions and analyses and are not binding. They do not constitute any recommendation for buying, selling, entering or exiting the stock market and cryptocurrency market. Also, all news and analyses included in the website and channels are merely republished information from official and unofficial domestic and foreign sources, and it is obvious that users of the said content are responsible for following up and ensuring the authenticity and accuracy of the materials. Therefore, while disclaiming responsibility, it is declared that the responsibility for any decision-making, action, and potential profit and loss in the capital market and cryptocurrency market lies with the trader.