
Neldjouw
@t_Neldjouw

What symbols does the trader recommend buying?
Purchase History
پیام های تریدر
Filter
Signal Type
Neldjouw

Summary Quant (QNT) remains in a multi-year accumulation range" since its 2021 cycle top. The asset shows textbook signs of liquidity engineering, and the next decisive move hinges on structural breaks above key price levels. Institutional momentum is quietly building beneath the surface, supported by both technical and fundamental factors. Macro Structure & Price Context QNT's price action has respected a clear horizontal accumulation zone between $56 and $160 since 2021. The range has repeatedly swept liquidity both above and below key horizontal levels, signaling methodical accumulation by larger entities. This behavior aligns with institutional patterns where liquidity is engineered prior to expansion phases. The Fibonacci retracement levels from the previous bull market cycle illustrate confluence with price action: 0.382 retracement aligns near current accumulation. 0.618 - 0.786 retracements ($260-$280) serve as long-term targets where liquidity inefficiencies remain unmitigated. The $160 level is especially critical, as historical rejections confirm its role as a structural ceiling within this macro range. A successful breakout would shift the asset into price discovery towards $200-$280. Mid-Term Structure & Momentum Indicators Cup & Handle Formation (4H / Daily) A well-formed cup & handle structure has emerged on the 4-hour and daily timeframes, signaling potential bullish continuation. The handle portion is consolidating above $104-$113, which has flipped from resistance to potential support. Golden Cross (Daily) A golden cross between the EMA 50 and EMA 200 on the daily chart further strengthens the bullish bias, marking a potential shift into a sustained uptrend. Liquidity Sweep & Reaction Recent price action filled a FVG zone at $85, sweeping liquidity and rebounding with strength. This move suggests the lower bound liquidity has been harvested and may no longer attract price in the near term. Liquidity & Volume Pressure Zones Order book depth indicates significant unexplored price action above $110. Liquidity clusters and volume profiles suggest minimal resistance between $110 and $130, with price requiring acceptance above $110 to justify exploration beyond $130 and $160. Above $130: Clearer path to $160. Above $160: Opens inefficiencies towards $200-$280. Liquidity & Momentum Zones Above $130: Positive sentiment, confirms handle formation, increases probability of testing $160 again. $160 Breakout: Structural shift from range-bound to trending. Opens doors to rapid liquidity grabs towards $200-$280. Below $104: Reverts to bearish range-bound behavior, risks another sweep towards $85 and $56 liquidity pools. $56: Ultimate liquidity grab zone if macro conditions worsen (unlikely in current market). Fundamental & Macro Drivers Regulatory Tailwinds QNT's alignment with ISO 20022 and emerging CBDC infrastructure positions it as a compliant, institutional-grade token. EU partnerships and banking adoption continue to solidify its fundamental narrative. US Crypto Strategy The US is aggressively positioning itself as a global crypto hub. Regulatory clarity and institutional interest support compliant assets like QNT. Market Environment BTC dominance is declining, suggesting capital rotation into altcoins is near. Historical patterns show sub-60% BTC.D aligns with altseason triggers. Altcoin ignition phases typically follow periods like the current, where BTC sustains ATH and dominance contracts. Geopolitical Developments Tariff adjustments and easing global tensions free capital for risk-on assets. Increased cross-border financial innovation benefits QNT's positioning. Conclusion & Institutional Perspective QNT is postured for a late-stage accumulation breakout. Institutional players are likely targeting the inefficiencies left in the $200-$280 zone. The presence of a strong macro structure, clear liquidity engineering, and aligning fundamentals in both EU regulation and US market positioning make this asset attractive. The path of least resistance, provided BTC continues to hold above its ATH and dominance slides, points towards an eventual breakout of $160. Above this level, QNT’s inefficiencies demand mitigation, and the $280 magnet is a realistic mid-term institutional target. Risk below $104 remains, but structurally the asset favors upside as long as it respects the $130 area and BTC dominance trends lower.
Neldjouw

Price Resilience Amid Geopolitical Stress Bitcoin demonstrated remarkable strength during the Israel-Iran conflict, briefly dipping to ~$98K but swiftly rebounding above $105K. This aligns with historical patterns where BTC initially sells off on geopolitical shocks but recovers aggressively within weeks, outperforming gold and equities by 15-60% post-crisis. There is a $96K-$94K "footprint" that coincided with institutional accumulation, evidenced by $1.37B in spot ETF inflows during the conflict week, led by BlackRock's IBIT ($240M single-day inflow) according to official information. This institutional backstop and many others might single-handedly prevented a deeper correction for now, remember that smart money psychology is to create cause out of thin air and buy during selling and indecisive times. Critical Levels to Watch Immediate Support: $108k area is vital. A sustained hold here maintains short-term bullish momentum. The 50-day SMA near $102.8K (tested during June 13 conflict sell-off) remains a macro support floor. Resistance & Targets: The $112K ATH is the near-term ceiling. Breaking this requires stronger spot demand—currently, net exchange inflows are negative, indicating weak retail participation or traders that are backing off for now.There's a $120K target (0.618 Fib) aligned with Standard Chartered’s $150K year-end model if ETF inflows persist. Risk Zones: A close below $108.3K risks a slide to $105K. Failure here opens path to $96K and a further break of this 92k to 96k zone could lead directly to 70k area or even lower if economical and social activities are not favorable in the near to medium future.Dominance above 55% (currently 65%) delays alt season, but a break below 60% could ignite alts in a positive way. Macro Catalysts & Market Sentiment Policy Tailwinds: Trump’s "One Big Beautiful Bill" (proposing $5T debt ceiling hike and U.S. strategic BTC reserves) could weaken the USD, boosting BTC’s "digital gold" narrative. DXY’s -9% YTD drop already correlates with BTC’s 54% post-election rally. Fed Influence: Pressure to cut rates (amid cooling employment data) may accelerate institutional rotation into BTC. ETF inflows hit $2.75B in late June, signaling renewed institutional FOMO. Geopolitical Cooling: Iran-Israel ceasefire talks reduced immediate panic, but residual volatility risk remains. Traders note BTC often rallies 20-40% within 60 days of conflict events. Structural Challenges Liquidity Fragility: Whale moves (for example: 10K BTC sell orders) now impact prices more due to ETF-driven liquidity concentration. Recent $98K flash crash exemplified this. Regulatory Overhang: MiCA compliance costs in the EU and U.S. security-reclassification proposals could pressure smaller tokens, though BTC’s status appears secure 28. Seasonal Slump: July historically sees 6.1% of annual crypto volume—low volatility may delay breakouts until August 4. Strategic Outlook A July breakout above $112K could ignite the next leg to $120K, but a retest of $107K-$105K is likely first. Altcoins remain subdued until BTC dominance breaks <55%—select projects with institutional backing (for example, ETF candidates) or real-world utility for asymmetric opportunities. Conclusion: BTC’s resilience amid chaos confirms its institutional maturity. Trade the $108.3K-$112K range aggressively, with a break above ATH targeting $120K by September. Always hedge tail risks (escalations, regulatory shocks) in this volatility-rich asset class. While this great surge in institutional inflow is good for BTC it also indicates a reduction or slower pace of other crypto currencies. This is my analysis for BTC, let me know what you think and I hope you like it!BTC performing as expected! Lets see how this level plays out, I expect madness this weekend!Target reacted exactly as predicted! Closing 70% of this :)Please leave a comment or like if you'd like more analysis :)All targets reached! Closing now :) We got some really juice profits over there. Please follow for more!
Neldjouw
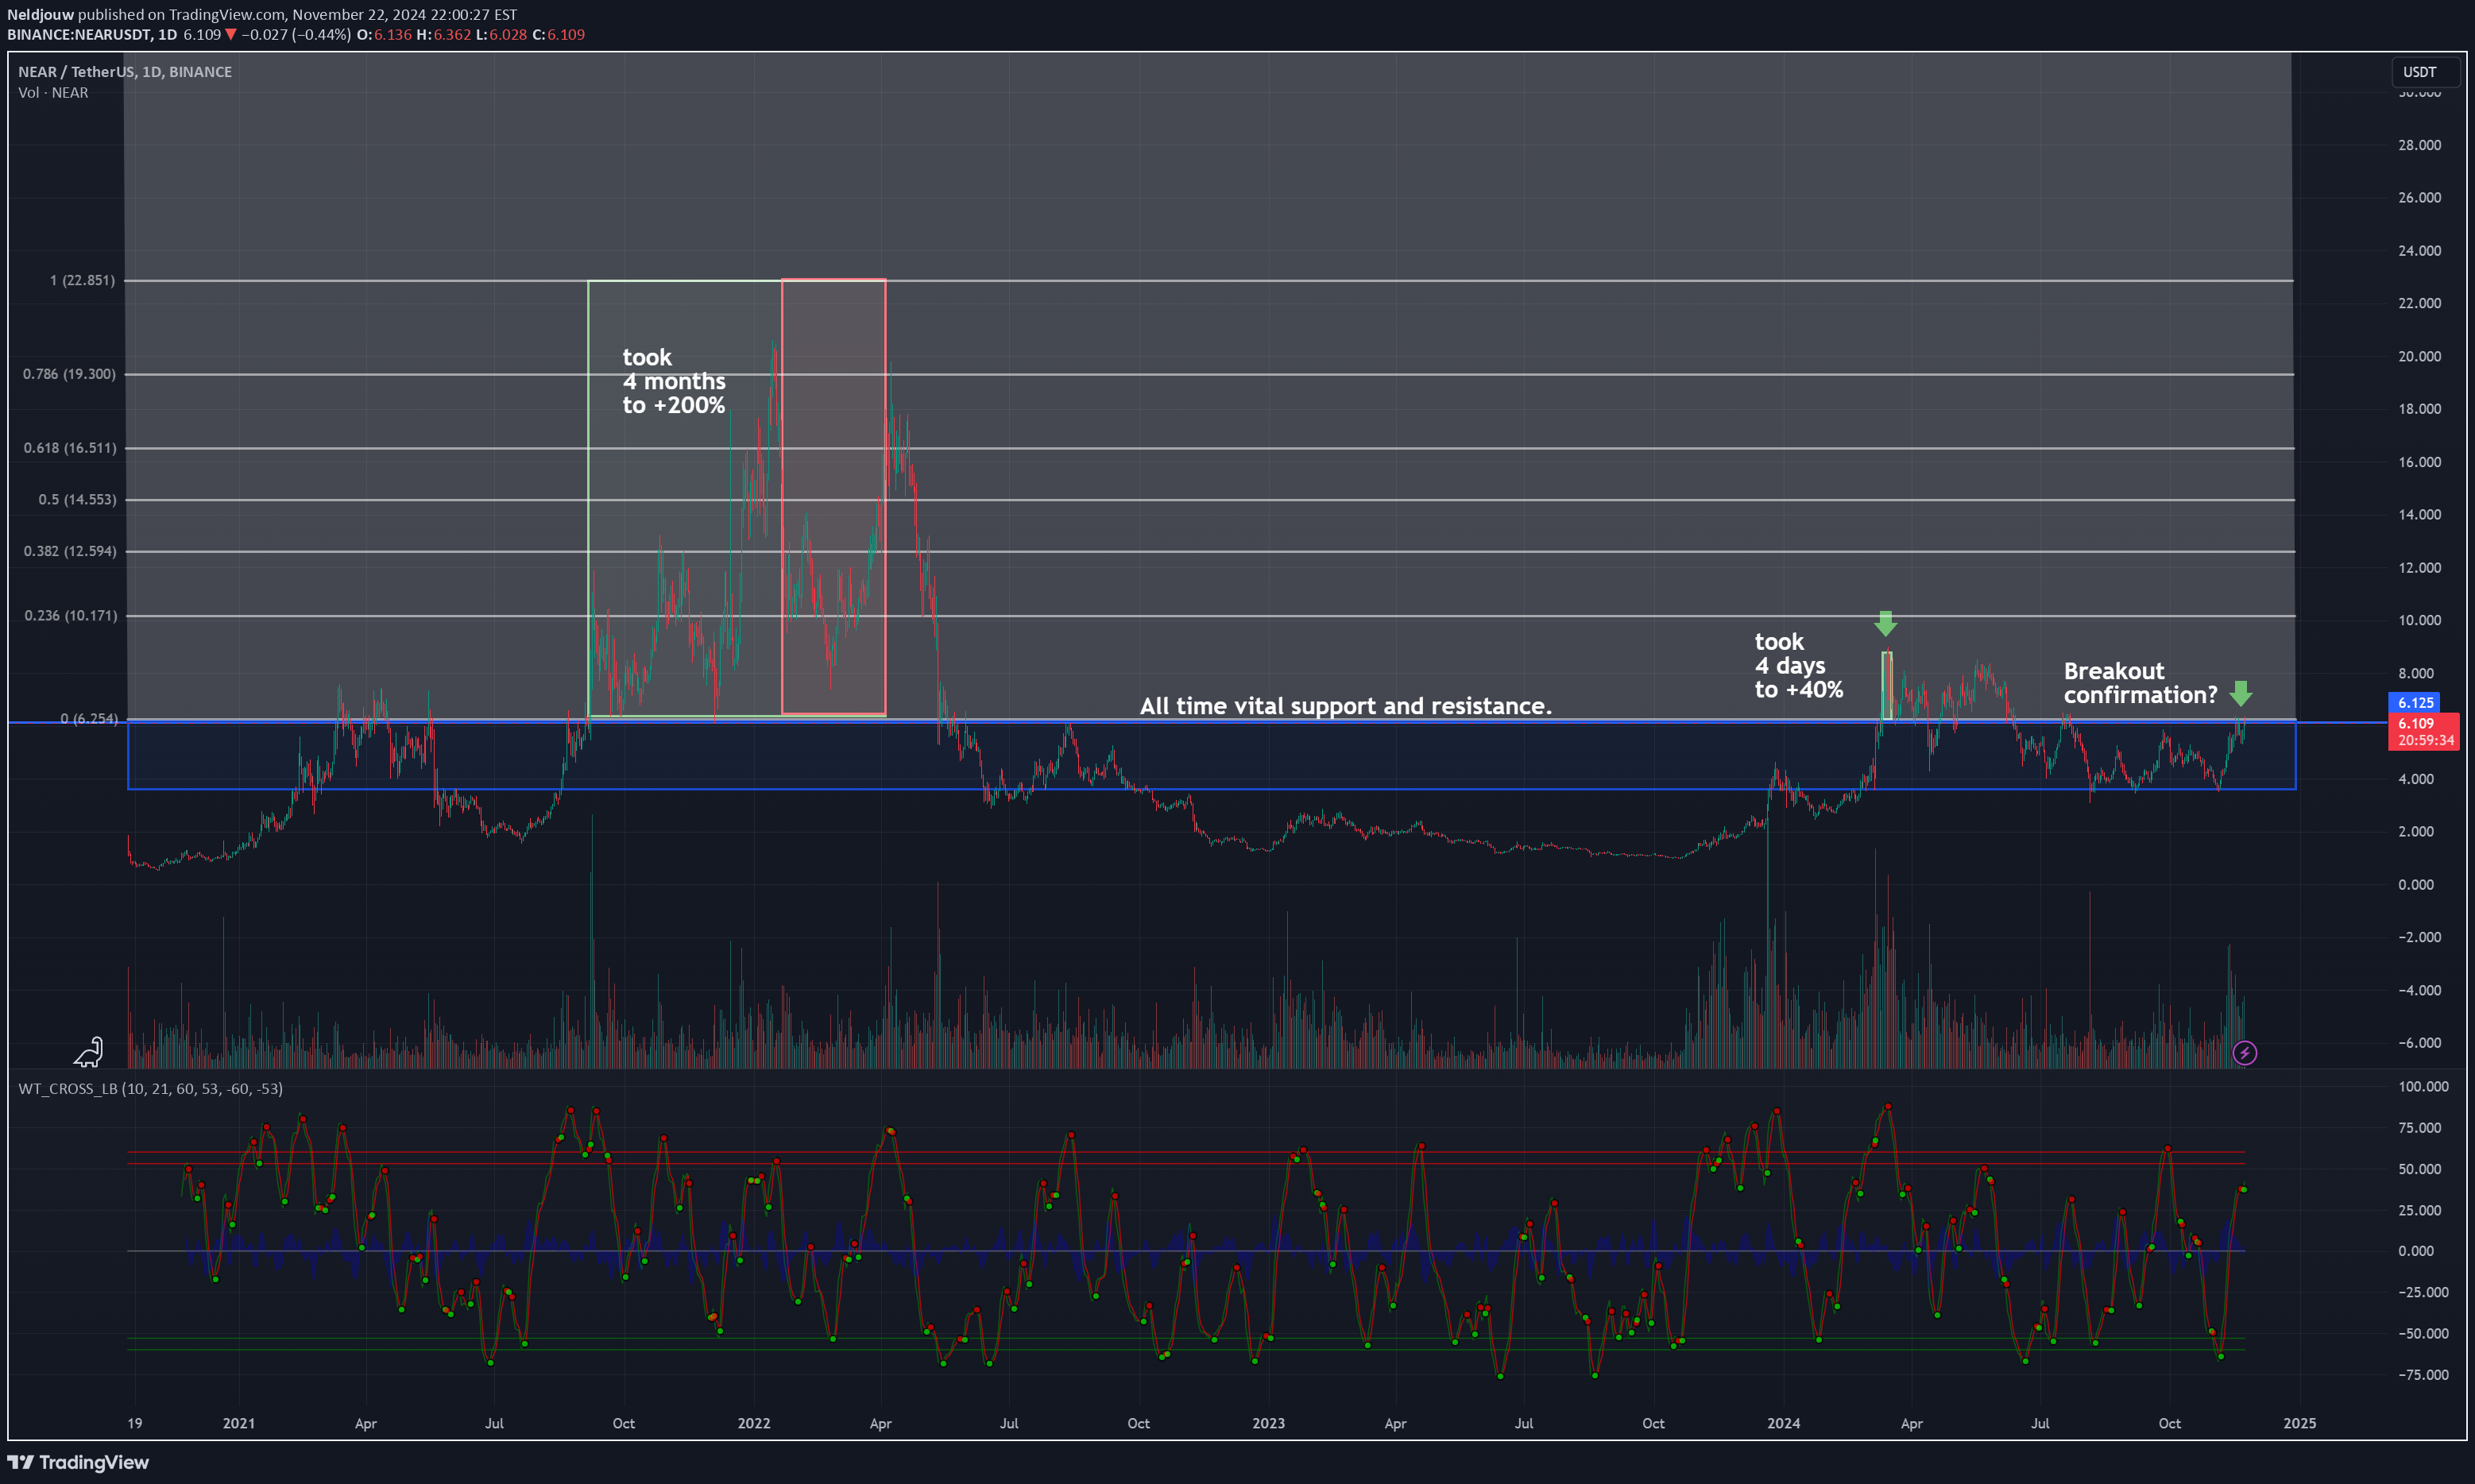
Hey there! Today we have NEAR/USDT in the radar. Current price at: $6.15 This pair came out of an initial deep bearish zone initiated on January 2022 and ending it's level 1 bearish season on February 2024, specifically the 24th. From this date on, price has been accumulating for 4 months straights until finally broke successfully it's $5 support on Nov 15th 2024 (Yes, a week ago). This type of tokens tend to move slower, but once we break a life-time resistance ($6), growth is inevitable. The last time NEAR approached to the all time vital support ($6) it grew up a 40% in 4 days. Impressive huh? Even tough this pair wasn't ready to increase the price at that time it shows resilience, a very strong community and utility of this project in the crypto world. We've also been seeing a lot of volume increase in the past week of more than 80%. This only means and happens when a possible break-out is about to happen. This is my idea. Remember trading is risky and DYOR. ---------------------------------------------------------------------- We are going LONG in NEAR/USDT. LEVERAGE x4 - x8. OR SPOT. Entry price: $5.8 - $6.1 TIGHT STOP-LOSS: $5.3 TARGETS: TG1 --------> $8.44 ( IT COULD BE $10.1 DEPENDING ON THE VOLUME OF THE BREAKOUT) TG2 --------> $12.62 TG3 --------> $19.31 Thank you for reading! :)
Neldjouw

Hi there! ICP/USDT turning bullish in the weekly and daily time frames after hitting $22 on March earlier this year (7 MONTHS AGO). The price has been consolidating strongly for almost 4 months trying to break the $8.662 resistance a couple times in order to chase it's second resistance at $10.63 (were the price have been playing around the past couple of days). Bitcoin's divergence and smart money manipulation have been retracing the growth of this token and most altcoins in order to find better prices for the next bulls season. In the daily frame, this is also the first time in months that volume increases strongly since July. We might be in presence of a possible breakout in the short-term. NOTE: Market is being extremely volatile in the past few weeks! Be careful and DYOR. We are going LONG in ICP with a tight SL! Chart is setting up with a bullish momentum. I drew a Fibonacci extension to identify and confirm targets and resistances. Everything for this trade in depicted in the chart :) Open LONG-trade between -----------> $9.5 and $10 SL: -----------> $8.77 TARGETS: TG-1 -----------> $12.247 (Short-term) TG-2 -----------> $14.027 TG-3 -----------> $18.023 Thank you for reading! Have a gr8 day ahead.
Neldjouw

Hello everyone, Hope you are all doing great! Here, I'm showing you $FFT/USDT as you can see since the token successful broke the $3.5 resistance we've seen wonders in the price. For now, the chart in 4hrs period is showing an ascending triangle. The price has been accumulating in this zone, volume has increased a lot as it shows that whales are trying to maintain the price. The possibility for a breakout is almost imminent, hold your bags cause this is gonna be huge! At least, 30% from this point in the next few days. Since FTX went bankrupt, this past few weeks we've seen an enormous amount of interest in this token since the Reboot notice from the new and former CEO. Also the approval by FTX and Alameda to sell their assets worth of millions to pay its creditors was approved. These are positives steps for what's possibly coming in the FTX world. If you are new to this token and you wanna be part of this, hold on! The time for an entrance was a few days ago, around $3.5 and $4.0. If a possible correction happens it should be inside the accumulation zone. When the price breaks the $4.8 resistance and tests it again following the uptrend it might be a good opportunity to dive into the wave :) This is just my analysis, time will tell if I was right. In the meantime, never seize your learning, let the good energies come to your life, have patience and be smart. This is not financial advise, DYOR. Namaste.Life is easier when you know what you are doing. I bought this coin in $3.5 so its almost %100 of growth since and 25% since I called it here. This is the time to go from now on, its major resistance at 4.9 has been broken. Expect the price to be highly volatile, the price NEEDS to rest around this price ($4.9 - $6) for at least a few hours or days, and then the projection we are looking for which is around $9 / $10. If we close on green this week just Image how green everything is gonna look next week. Is the moment to buy! Not a financial advise, DYOR. Targets: 1. $6.3 2. $8 3. $12 Thank you everyone again, and remember, keep learning, let the good energies come to your life, have patience and be smart.Wee keep waiting, still in the correction phase. Seller been trying to push the price back but failed each time. Remember FTT token is more than 80% whales and the rest is us, that's why we've seen crazy prices in the last few days. We have two scenearios right now. If seller break the resistance at 4.8 we can see prices again at $3.5 or $2.9. If not, get ready, cause I'm watching this coin going to $12 in the medium-term. Tomorrow is a big day for FTX and its token FTT. Lets have some patience and be careful with your stoploss.
Disclaimer
Any content and materials included in Sahmeto's website and official communication channels are a compilation of personal opinions and analyses and are not binding. They do not constitute any recommendation for buying, selling, entering or exiting the stock market and cryptocurrency market. Also, all news and analyses included in the website and channels are merely republished information from official and unofficial domestic and foreign sources, and it is obvious that users of the said content are responsible for following up and ensuring the authenticity and accuracy of the materials. Therefore, while disclaiming responsibility, it is declared that the responsibility for any decision-making, action, and potential profit and loss in the capital market and cryptocurrency market lies with the trader.