NebrasChart
@t_NebrasChart
What symbols does the trader recommend buying?
Purchase History
پیام های تریدر
Filter
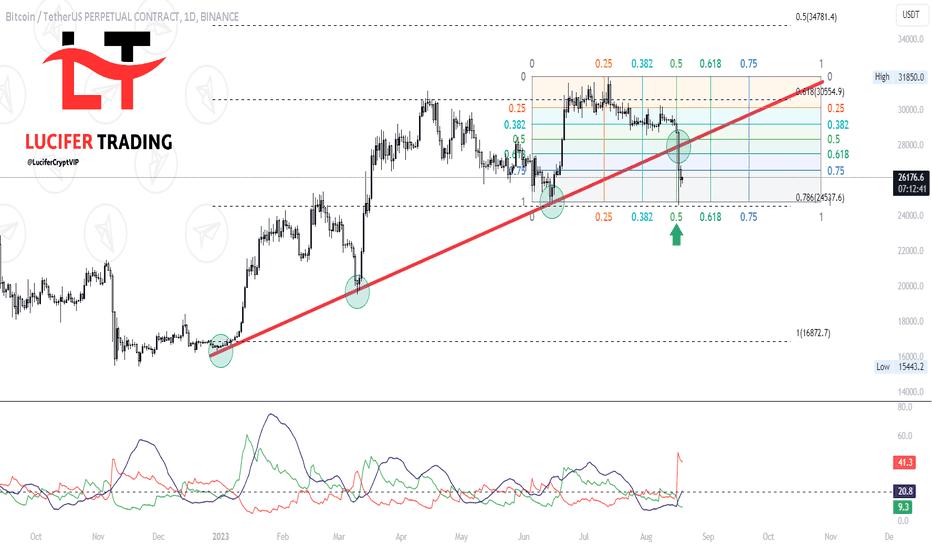
Technical Analysis and BTC Update 📈🔍

After Bitcoin reached the support level in the Jan square bottom region and broke the trendline on the daily timeframe, the situation becomes clear as follows 🧐📊: Our expectations point towards price oscillation in the upcoming period, where the price will range between the zone of 26500 and 24770. This movement might coincide with the entry of a new time cycle within the Jan square 🔺. We have noticed the expansion of significant resistance along the same distinctive red trendline. A potential interaction between the price and this area could eventually lead to the formation of a bearish pattern 📉🔴. We must closely monitor the price action developments following the significant preceding momentum. If the price manages to break the support level at $24500 and closes below it with a daily candle, this could potentially trigger a sharp descent and the formation of a new bottom 🚨 ⚠️📉. Please note that this technical analysis is based solely on current data, and we recommend attentively following upcoming developments to make well-informed decisions 🚀👀.
INJUSDT Short Setup Swing Trade

📊 ** Analysis by @LuciferCryptVIP ** INJUSDT.P ** INJ/USDT Short Setup Analysis ** 📉 ** Support and Liquidity Swap Levels: ** - Buy Zone: 5.022 - 3.845 - Strong Support: 3.845 📈 ** Resistance Levels: ** - Resistance 1: 7.661 - Resistance 2: 8.285 🎯 **P otential Targets: ** 1. Target 1: 6.341 2. Target 2: 5.930 3. Target 3: 5.206 📌 **Current Price: 7.079** 📊 ** Technical Analysis: ** - INJ/USDT is currently trading near a pivotal resistance level at 7.661. - The price has exhibited consolidation, suggesting an imminent price movement. - Strong support at 3.845 is a key level to monitor for potential reversals or continuations. - The target levels offer potential exit points for traders, with incremental downside potential. - Effective risk management and stop-loss strategies are recommended. 📈 ** Trade Idea: ** - **Short Position Entry:** Consider entering a short position upon a confirmed breach below the strong support at 3.845. - **Targets:** Take profits at 6.341, 5.930, and 5.206. - **Stop-Loss:** Set a stop-loss above the resistance level at 8.285. 🚨 ** Risk Warning: ** Trading carries substantial risk and may not be suitable for all investors. Comprehensive understanding of risks and prudent risk management are essential. This analysis is intended for educational purposes and is not financial advice. It is essential to conduct personal research before executing any trading decisions. Best of luck! @LuciferCryptVIP 🌟 (Note: This analysis is not financial advice. Please conduct your own research before making trading decisions.)
TOMOUSDT 12H Timeframe Short setup !

📊 **Analysis by @LuciferCryptVIP ** **TOMO/USDT Short Setup Analysis** 📉 **Support and Liquidity Swap Levels:** - Buy Zone: 1.0834 - 1.0461 - Strong Support: 1.0461 📈 **Resistance Levels:** - Resistance 1: 1.5273 - Resistance 2: 1.6109 🎯 **Potential Targets:** 1. Target 1: 1.3428 2. Target 2: 1.2153 3. Target 3: 1.0988 📌 **Current Price: 1.4900** 📊 **Technical Analysis:** - TOMO/USDT is currently trading near a critical resistance level at 1.5273. - The price has exhibited a consolidation pattern, indicating a potential upcoming move. - Strong support lies at 1.0461, serving as a crucial level to monitor for potential reversal or continuation. - The targets present possible exit points for traders, with progressive downside potential. - Traders are advised to exercise proper risk management and consider stop-loss strategies. 📈 **Trade Idea:** - **Short Position Entry:** Upon a clear break below the strong support at 1.0461, consider entering a short position. - **Targets:** Take profits at 1.3428, 1.2153, and 1.0988. - **Stop-Loss:** Set a stop-loss above the resistance level at 1.6109. 🚨 **Risk Warning:** Trading involves substantial risk and may not be suitable for all investors. Ensure you understand the risks and have a solid risk management strategy. This analysis is for educational purposes and not financial advice. Always do your own research before making trading decisions. Good luck! @LuciferCryptVIP 🌟 (Note: This analysis is not financial advice. Please do your own research before making any trading decisions.)FULL TARGET DONE! -30%
Disclaimer
Any content and materials included in Sahmeto's website and official communication channels are a compilation of personal opinions and analyses and are not binding. They do not constitute any recommendation for buying, selling, entering or exiting the stock market and cryptocurrency market. Also, all news and analyses included in the website and channels are merely republished information from official and unofficial domestic and foreign sources, and it is obvious that users of the said content are responsible for following up and ensuring the authenticity and accuracy of the materials. Therefore, while disclaiming responsibility, it is declared that the responsibility for any decision-making, action, and potential profit and loss in the capital market and cryptocurrency market lies with the trader.