
NaranjCapital
@t_NaranjCapital

What symbols does the trader recommend buying?
Purchase History
پیام های تریدر
Filter
NaranjCapital
هشدار بزرگ: آیا بازار سهام آمریکا در آستانه سقوط 15 درصدی است؟ (سیگنالهای فنی و ارزشی)

After a rough day on Wall Street, the S&P 500 dropped about 1.2%, pulling U.S. markets lower. But there’s more behind this fall than just profit-taking. What’s Really Happening? Warning Signs from Wall Street Two top banking leaders raised caution. Morgan Stanley’s Ted Pick expects a 10–15% correction, calling it a “healthy normalization.” Goldman Sachs’ David Solomon warned that tech stocks are showing bubble-like behavior, with prices running much faster than earnings. AI Boom Driving Market Concentration The AI craze and tech optimism have made a few mega-cap companies dominate the market. In fact, just 10 big tech firms now make up nearly 40% of the S&P 500’s total value, making the market more fragile. Fed Confusion Adds to Uncertainty The Federal Reserve is sending mixed signals — some officials talk about possible rate cuts by December, while others say rates should stay high because the economy is still strong. Adding to the mess, a partial U.S. government shutdown has delayed key data, leaving investors and the Fed guessing about what’s really happening in the economy. What the Chart Reveals From a technical standpoint, the U.S. market’s rally has been nothing short of extraordinary. Since the April bottom near 4,835, the index has soared nearly 42%, touching a recent peak around 6,920 — and even gained about 12–13% before the latest (April 2025) pullback began. But now, the momentum seems to be fading. The chart is flashing early warning signals — RSI divergence suggests that while prices made new highs, the underlying strength (momentum) did not. That often hints at a potential trend reversal. If this weakness deepens, the index could correct swiftly by around 10%, targeting the 6,200–6,100 zone. And if the “healthy normalization” predicted by Morgan Stanley’s Ted Pick (a 15% drop) plays out, the index might slide further to around 5,700 — a level that would reset valuations to more reasonable territory after the sharp run-up. Valuation Check Let’s set aside all the opinions and headlines for a moment and focus on the key valuation metrics that truly help us understand the real picture of the U.S. market. The Price-to-Earnings (P/E) Ratio — The Market’s Mood Meter P/E Ratio = Current Market Price/Earnings Per Share (EPS) So, Current Market Price = P/E Ratio*EPS Currently, the S&P 500’s P/E ratio stands at 30.8x, with an EPS of $222.5. When you multiply the two — 30.8 × 222.5 = roughly $6,800 — it perfectly aligns with the index’s recent market level. Now, to find out what the fair value of the market should be, let’s use the 5-year median P/E ratio, which is around 25.4x. Fair Market Price = 25.4*222.5 = 6,650. This aligns perfectly with the technical chart levels, suggesting that a 15% correction would be a healthy pullback to help cool down the overheated U.S. market. The Buffett Indicator — Market Cap vs. GDP One of Warren Buffett’s favorite valuation tools compares the total U.S. stock market capitalization to the country’s GDP — essentially measuring how large the market has grown relative to the real economy. At present, this ratio stands at around 224%, far above the long-term fair value range of 100–120%. Even when compared to its 5-year median level of 192%, the market still appears significantly overvalued. To return to its median level, the ratio would need to drop by roughly: [(224-192)/192]100 = 16.6% That’s roughly a 15–16% correction, which again perfectly aligns with both the technical chart signals and Ted Pick’s projection of a healthy market normalization. The Bottom Line The U.S. market’s extraordinary rally has been built on a mix of AI optimism, liquidity hopes, and investor euphoria, but the fundamentals are starting to whisper caution. Both valuation metrics and technical signals point to the same conclusion — the market is stretched, and a 10–15% correction wouldn’t be a disaster; it would be a return to balance. History shows that every overheated bull run needs a pause — not to end the story, but to give it a stronger foundation. So if the coming months bring some red on the screen, smart investors will see it not as fear, but as the market taking a deep breath before its next big move.
NaranjCapital
Market Mood Sours as Inflation Surprises Again
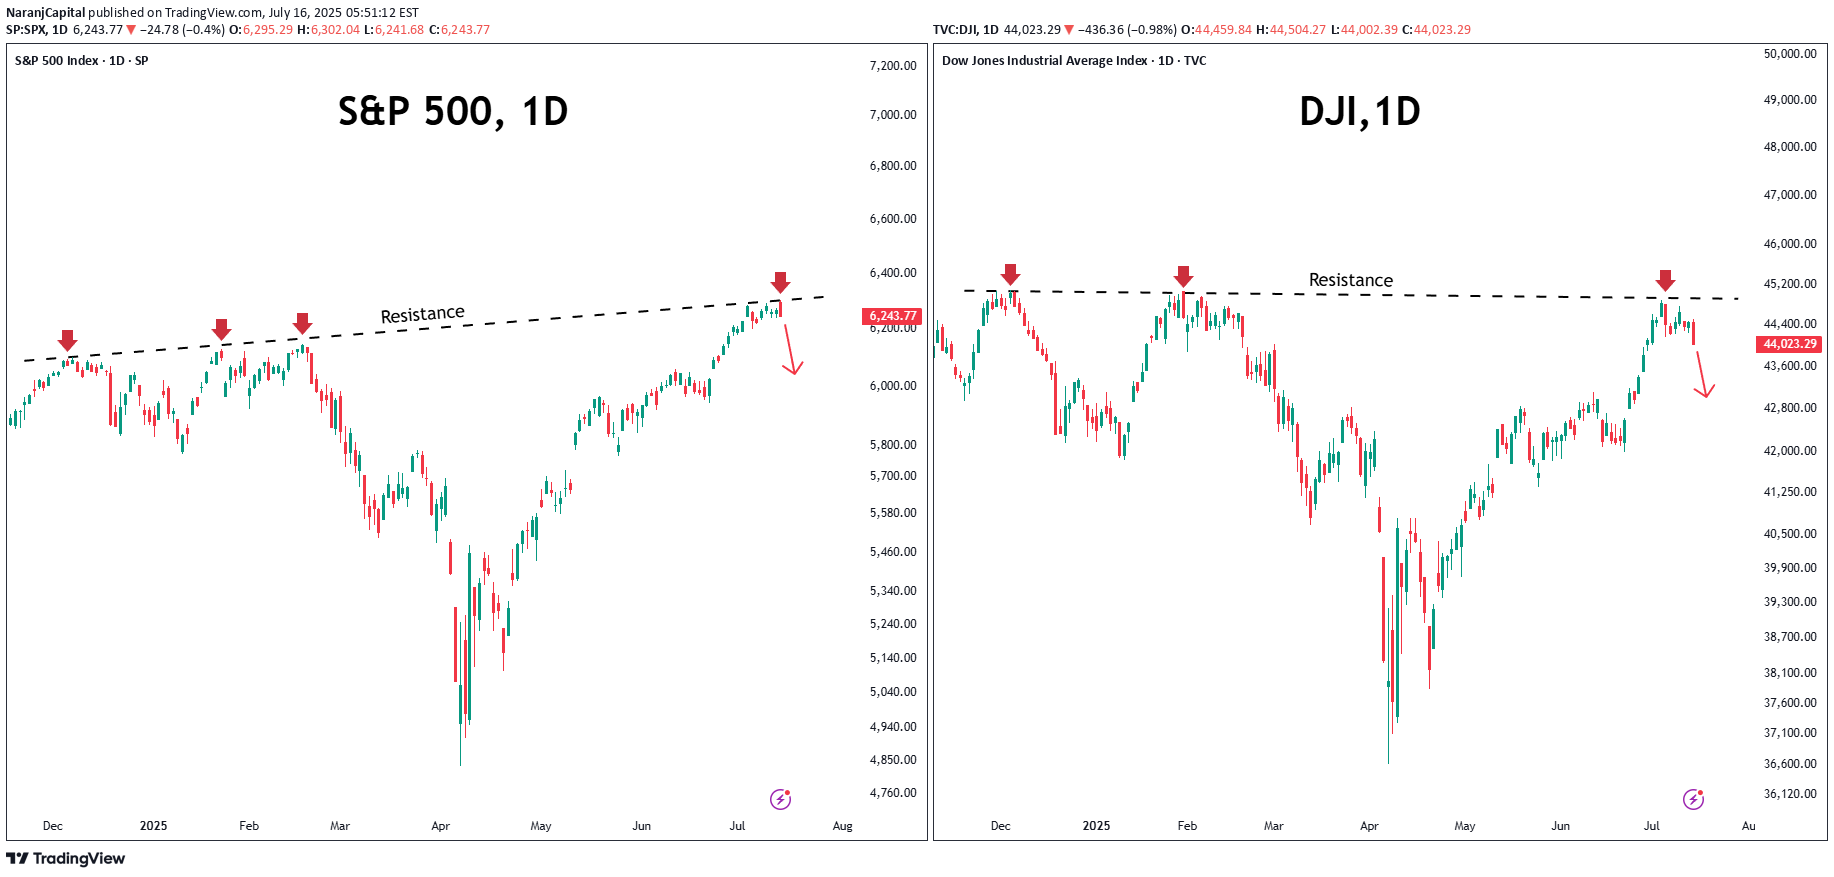
U.S. stock markets were under pressure on Tuesday after new inflation data came in higher than expected. This has made investors rethink how soon the Federal Reserve might cut interest rates. What Happened? ● The Consumer Price Index (CPI) recorded its biggest monthly rise in 5 months. ● Core inflation (which excludes food and energy) jumped by 2.9% compared to last year — more than the Fed's 2% target. What It Means ● Investors had expected the Fed to cut interest rates multiple times in 2025. ● After the inflation report, they now think the Fed will cut less than expected. ● The chances of a rate cut in September also dropped sharply. Market Impact ● Bond yields went up — the 10-year U.S. government bond yield rose to 4.49%, making borrowing more expensive. ● Stock futures fell (Dow, S&P 500, Nasdaq), as higher yields tend to hurt company profits and stock prices. S&P 500 and Dow Struggle at Resistance ● Both the S&P 500 and Dow Jones faced resistance near all-time highs. ● This rejection suggests potential for further short-term pullback, especially if macro pressures like inflation and rate uncertainty persist. Near-Term Outlook With inflation running hotter than expected, hopes for early Fed rate cuts have cooled. Traders and investors should remain cautious, manage risk actively, and prepare for continued volatility in the coming weeks.
NaranjCapital
Nvidia’s Sell-Off Deepens: How to Capitalize on the Decline?
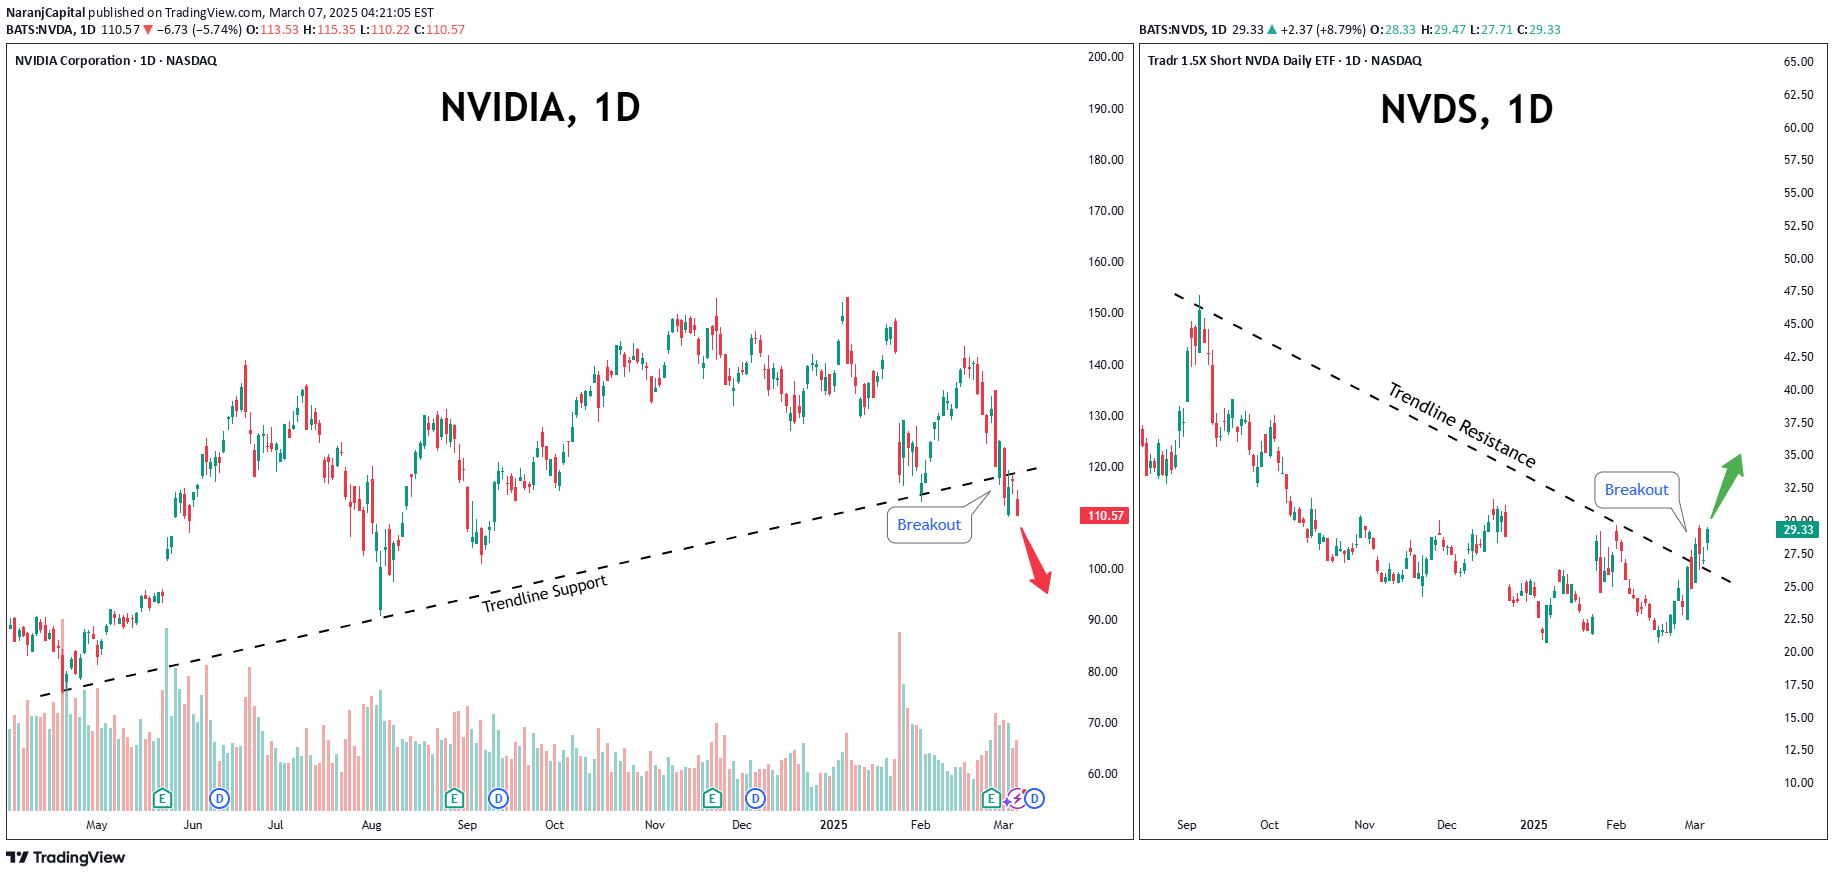
📉 Nvidia’s Technical Breakdown: ● Nvidia’s stock has been caught in a storm of selling pressure over the past month. ● The recent breach of critical trendline support levels suggests the downward trend could gain momentum in the days ahead, opening the door for savvy traders to capitalize on the bearish momentum. 🔄 NVDS: The Perfect Inverse Play for Nvidia’s Slide ● For those looking to navigate this decline, an inverse ETF like NVDS NVDS offers a compelling opportunity. ● Designed to move in the opposite direction of Nvidia’s stock, NVDS has shown a chart pattern that almost perfectly inverse Nvidia’s price action. ● This makes it a strategic tool to potentially profit from the stock’s anticipated slide.
NaranjCapital
Bitcoin's Rally Loses Steam: A Reversal Pattern Takes Shape
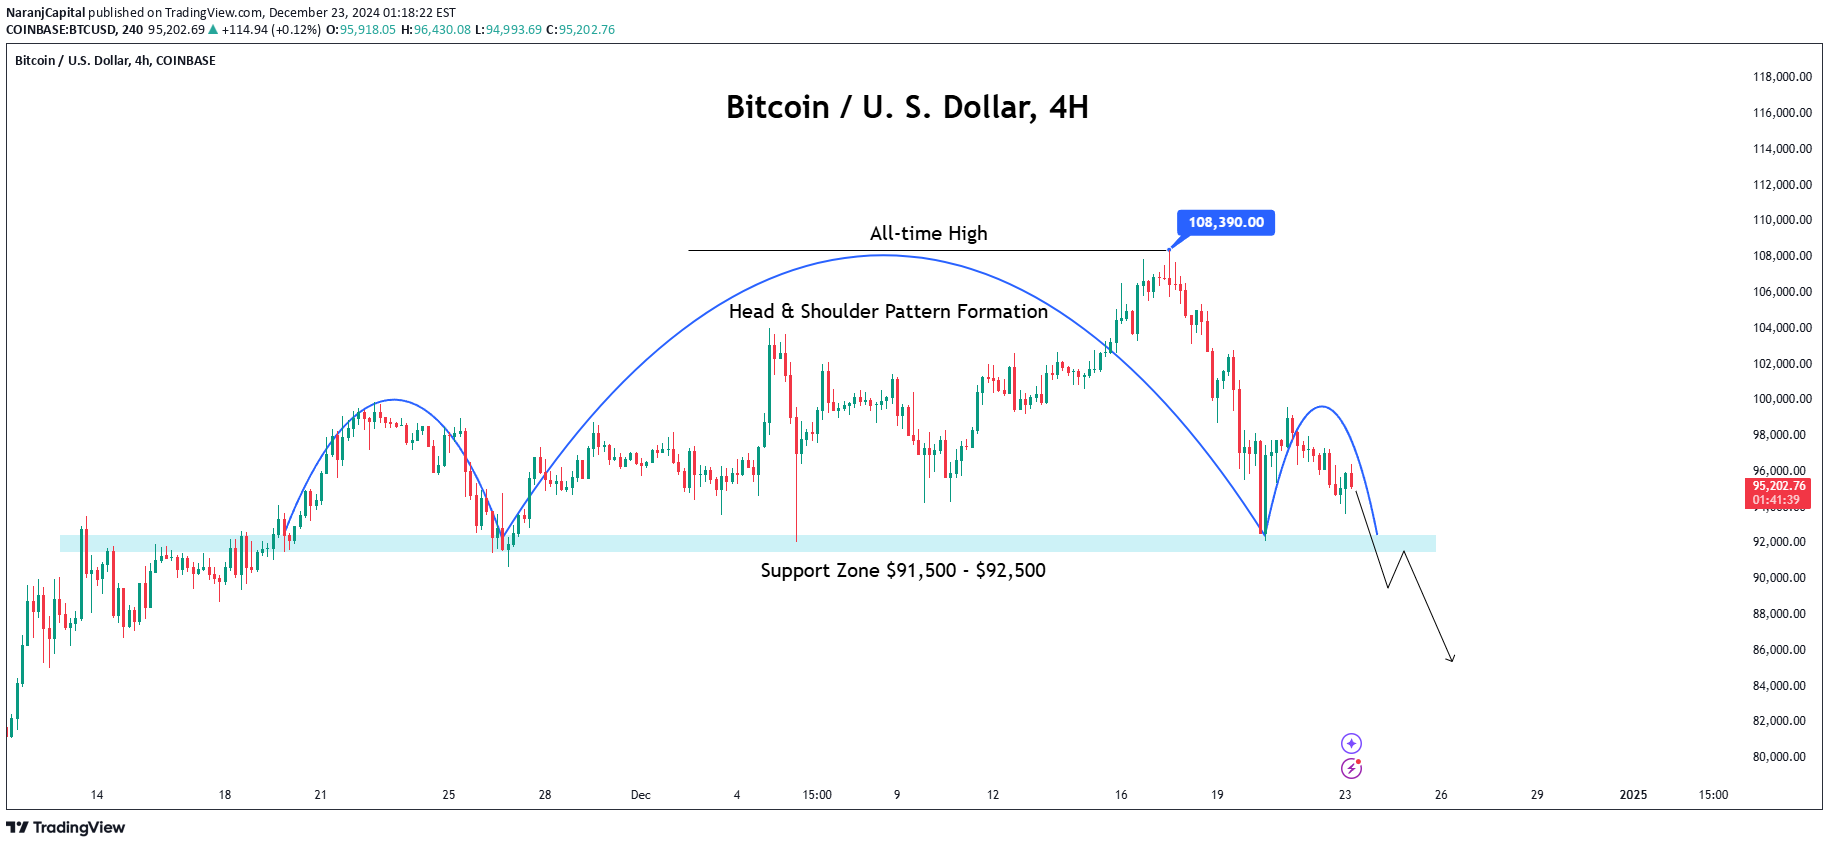
● Bitcoin reached a record high of approximately $108,390, driven by strong bullish momentum.● However, the rally was short-lived as intense selling pressure kicked in, triggering a rapid decline to $92,500 and erasing some of the recent gains.● The frequent price fluctuations are likely to form a Head & Shoulder pattern, a bearish pattern that indicates a potential trend reversal and further downside.● A sharp decline is expected if Bitcoin breaches below $91,500.
NaranjCapital
Amazon Ignites: 150% Blaze Ahead?
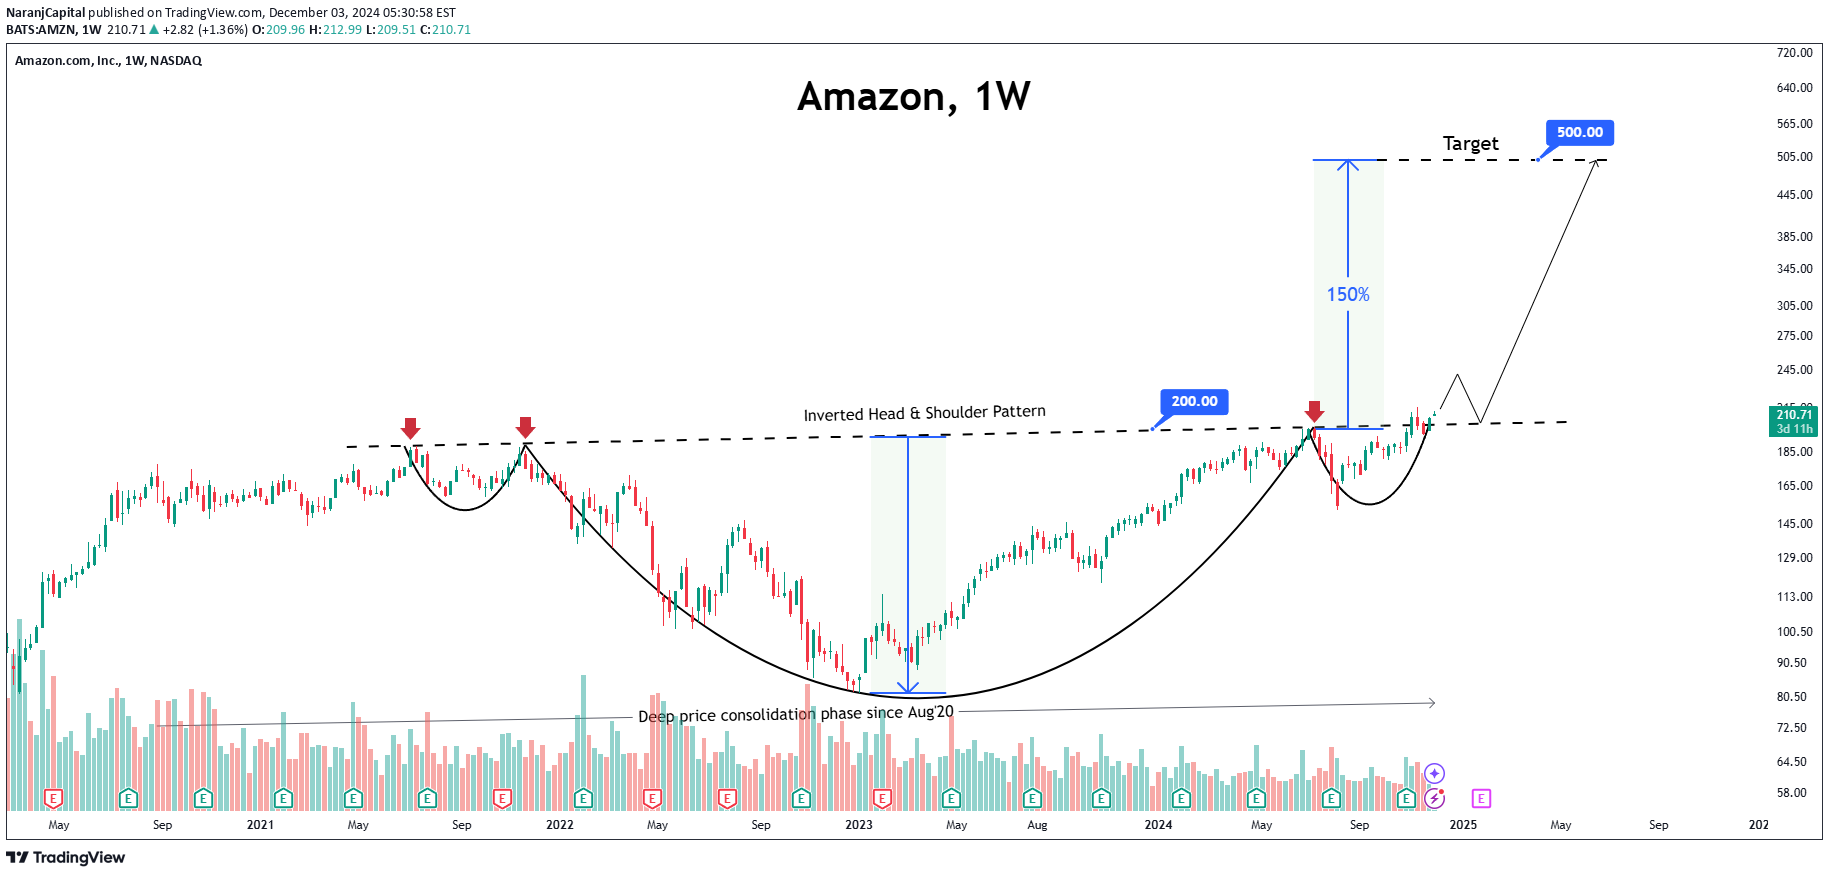
The stock has been in consolidation since August 2020, forming an Inverted Head & Shoulder pattern. Recently, it broke out above the neckline and is attempting to sustain above the 200 level. Currently trading at 210, the stock has the potential to surge to 500 levels in the next few years. However, the breakout lacks strong confirmation, as a significant bullish candle with volume expansion is absent. A crucial factor to watch is a monthly close above 200. This will help determine the stock's future trajectory and guide our trading and investment decisions.
NaranjCapital
Gold on the Go: Prices Set to Surge Amid Uncertainty

● Gold prices have recovered from a 6.5% fall and are now trading above $3000 per ounce.● Tariff developments and US President Trump's comments are influencing market sentiment and gold prices.● A record $21 billion inflow into Gold ETFs was recorded in Q1 2025, indicating strong interest in gold as a safe-haven asset.● Technical analysis suggests a key support level for gold prices between $2950 and $2960, which could impact market trends.
NaranjCapital
Rally Revved: Meta Shifts into High Gear After Rate Cuts
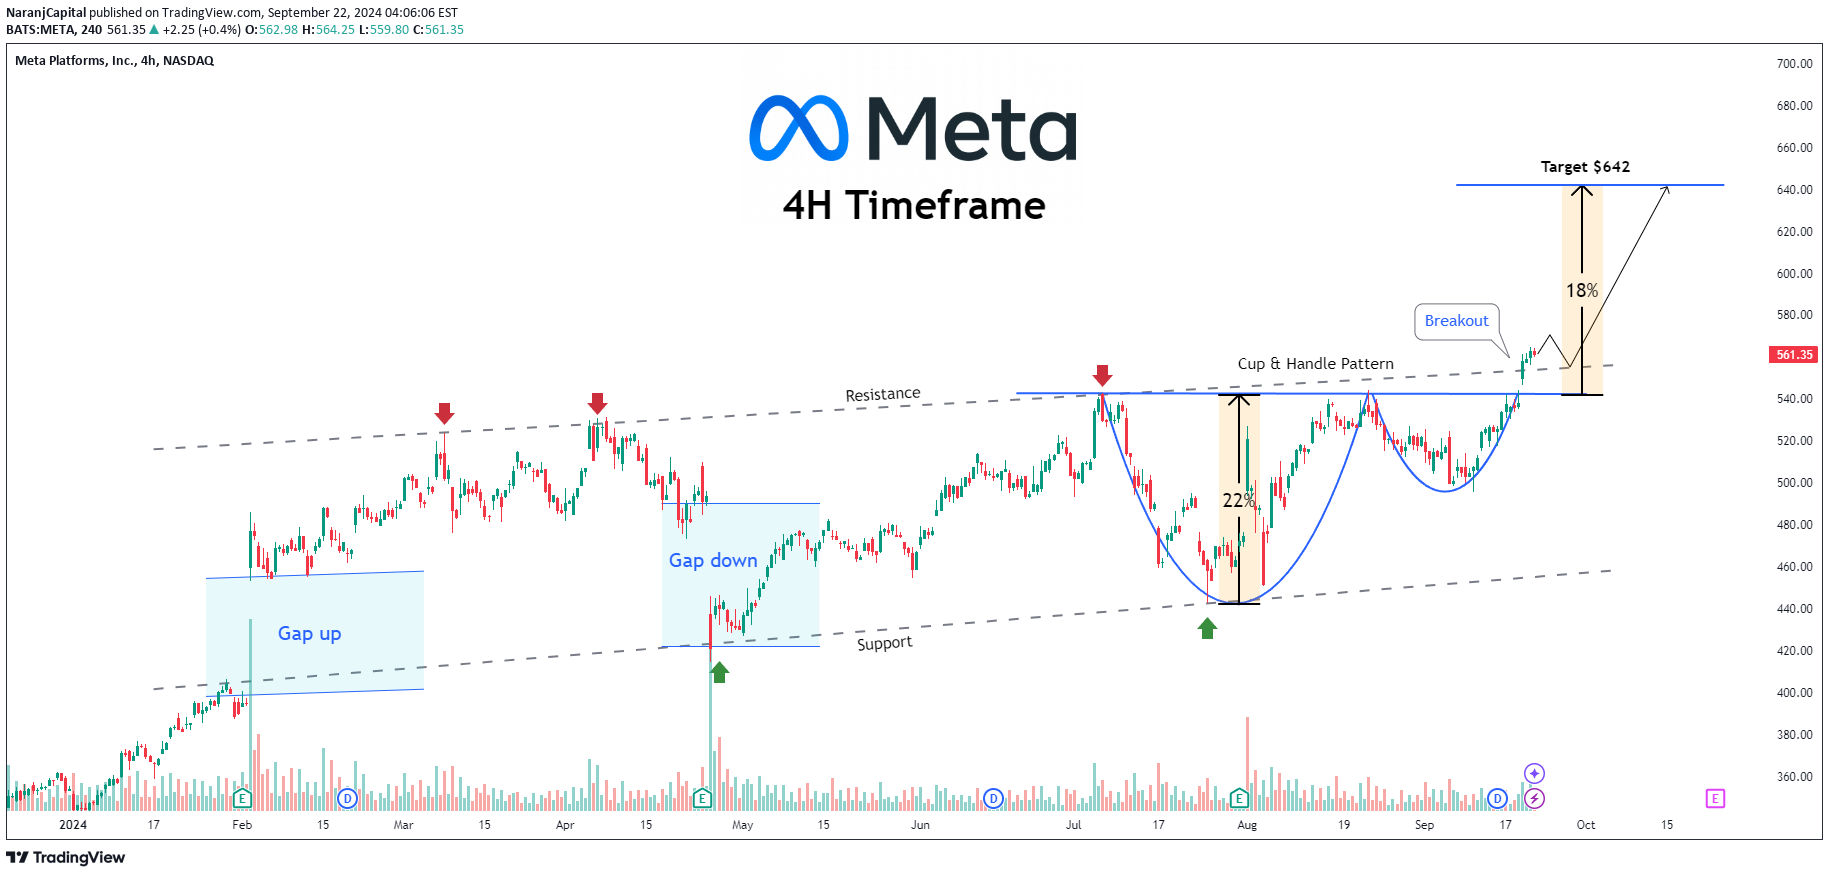
The stock price has been on a wild ride this year, marked by significant volatility. A clear Cup & Handle formation has emerged on the chart, suggested a potential continuation of the existing trend. Following a successful breakout, the stock has maintained its position above the breakout level, demonstrating strength. The price action suggests that the stock could potentially rally by 18-20% in the short term.
NaranjCapital
Bitcoin Plunges Below Support: $70k Looms Amid Selling Pressure

● Bitcoin has broken below its key support level of $91,000, sparking concerns of a deeper correction.● If selling pressure persists, a sharp drop to $70,000 could be imminent.● Market sentiment has shifted decisively bearish, reflecting growing investor anxiety.
NaranjCapital
Bitcoin is at support, set for a short-term ascent!

As Bitcoin travels through the descending parallel channel, it looks like it has finally secured support near 56k, a level it has relied on multiple times in the past.We foresee a bullish movement from this point in the short term.1st target - 65k2nd target - 70k.
NaranjCapital
Gold Falls from Peak, but Rate Cut Hopes Keep Outlook Positive

● Gold prices fell after hitting a high at $3057.59 due to a stronger US dollar, making it more expensive for overseas buyers.● Despite this, gold is set for its third consecutive weekly gain, up 0.7% this week.● Market participants expect at least two US Federal Reserve rate cuts this year, supporting gold's long-term bullish outlook.◉ Technical Observations● While moving through the rising parallel channel, the price has just faced resistance from the upper boundary and is expected to have a pullback towards $2,950.● If the price slips below this level, the next strong support is expected near $2,790.
Disclaimer
Any content and materials included in Sahmeto's website and official communication channels are a compilation of personal opinions and analyses and are not binding. They do not constitute any recommendation for buying, selling, entering or exiting the stock market and cryptocurrency market. Also, all news and analyses included in the website and channels are merely republished information from official and unofficial domestic and foreign sources, and it is obvious that users of the said content are responsible for following up and ensuring the authenticity and accuracy of the materials. Therefore, while disclaiming responsibility, it is declared that the responsibility for any decision-making, action, and potential profit and loss in the capital market and cryptocurrency market lies with the trader.