
Nadia_farhat
@t_Nadia_farhat

What symbols does the trader recommend buying?
Purchase History
پیام های تریدر
Filter
Nadia_farhat
تحلیل بیت کوین: آیا گوه صعودی شکسته میشود؟ مهمترین سطوح پیشرو!
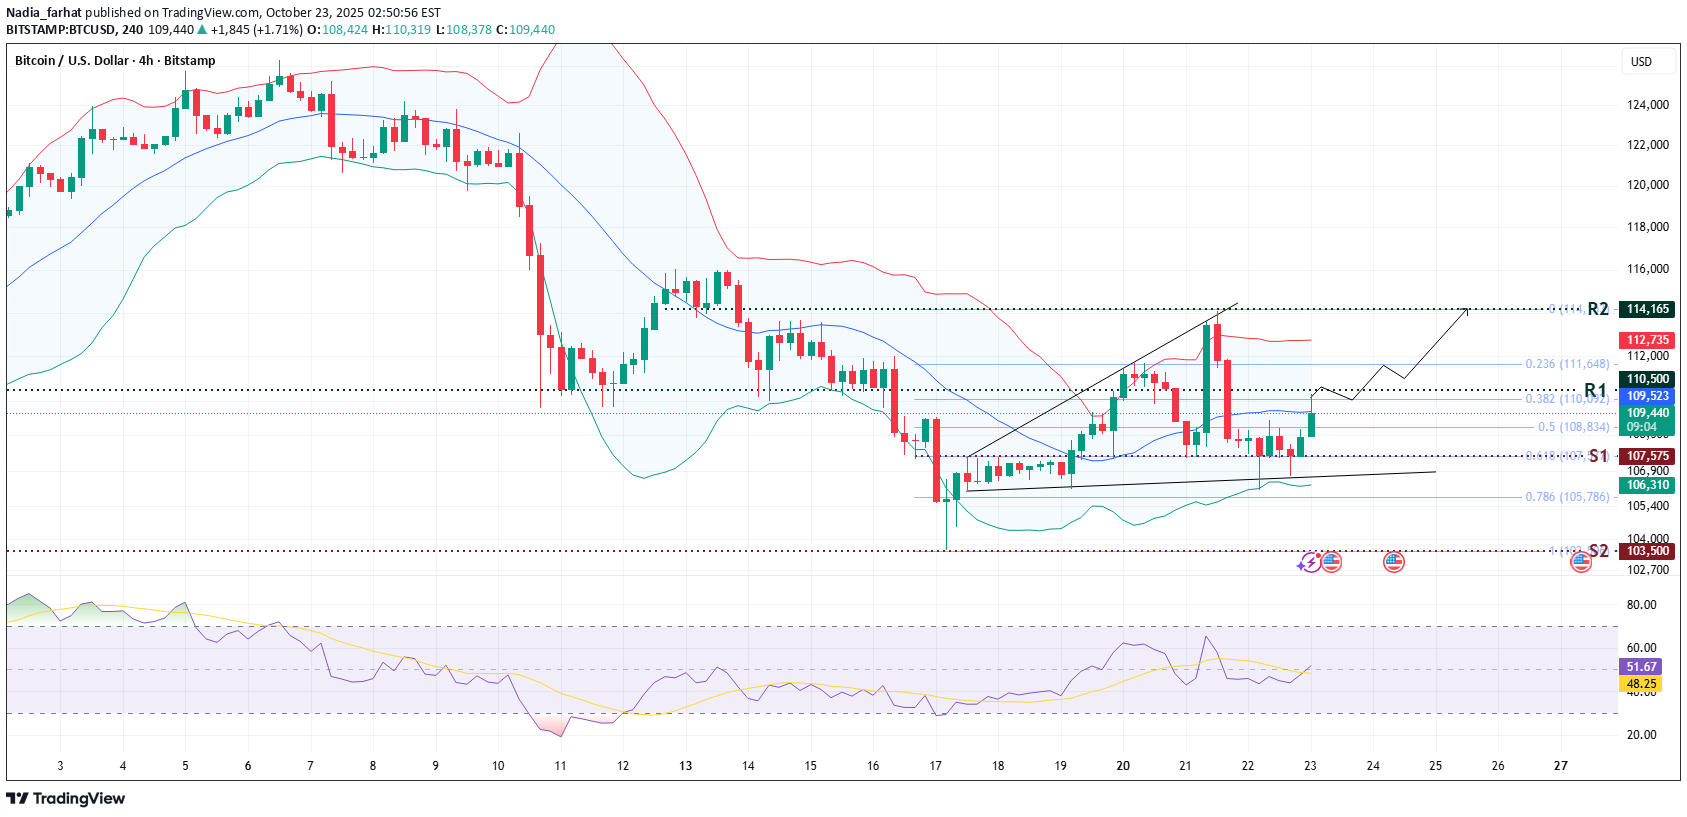
Overview: Bitcoin is trending within an ascending wedge pattern, with prices rising after testing the lower wedge’s zone confluence with the lower Bollinger band. The prices are approaching the immediate resistance near 110500 (between fib zone of 23.6% & 38.2%). If this resistance zone is breached & sustained then levels above 114000 could be witnessed. Biasness: Bitcoin moved little on Thursday, struggling to gain momentum and retaining a bulk of recent losses as risk appetite for cryptocurrencies was quashed by resurgent concerns over a U.S.-China trade war. Key Levels: R1: 110500 R2: 114165 S1: 107575 S2: 103500 Data Release: Gold traders are closely watching the upcoming U.S. Jobless Claims & Existing Home Sales data, which could influence the dollar’s movement and inject short-term volatility in the bitcoin. Technical Analysis: The prices are trending in the buying zone of technical indicators – above the middle Bollinger band & the neutral 50 level of RSI, signaling rising bullish pressure. Alternative Scenario: If prices fails to breach & sustain above R1 (110500), & falls below middle Bollinger band (109550), then bearishness may initiate. While writing the report, the pair is trending at 109985.
Nadia_farhat
سقوط آزاد طلا: آیا بازار به پایان رسید یا فقط یک استراحت کوتاه است؟

- Gold generated unimaginable returns of more than 68% since January 2025. - On Oct 20 (Monday this week), the precious metal made its ATH of 4381.5. - In the past 2 days, especially on Tuesday, the gold made substantial corrections of more than 8.55%. - It recovered around 2.5% and currently down around 5.60% from its record highs. But, we cannot ignore the facts also.......... - Spot gold prices slumped as much as 6.6%, the biggest decline in more than a dozen years, - While spot silver dropped as much as 8.7%. - But, Even after today’s strong corrections, prices remains above 4,100 - These are still levels most mining companies could only have dreamed of not long ago. - For investors, the message is simple — its time to buckle up, and maintain patience parallelly, while not losing the conviction In my view, we’re still in the early stages of a powerful bull market.
Nadia_farhat
ضربه سهمگین به گوگل: موجسواری سهام آلفابت پس از شوک مرورگر هوش مصنوعی OpenAI
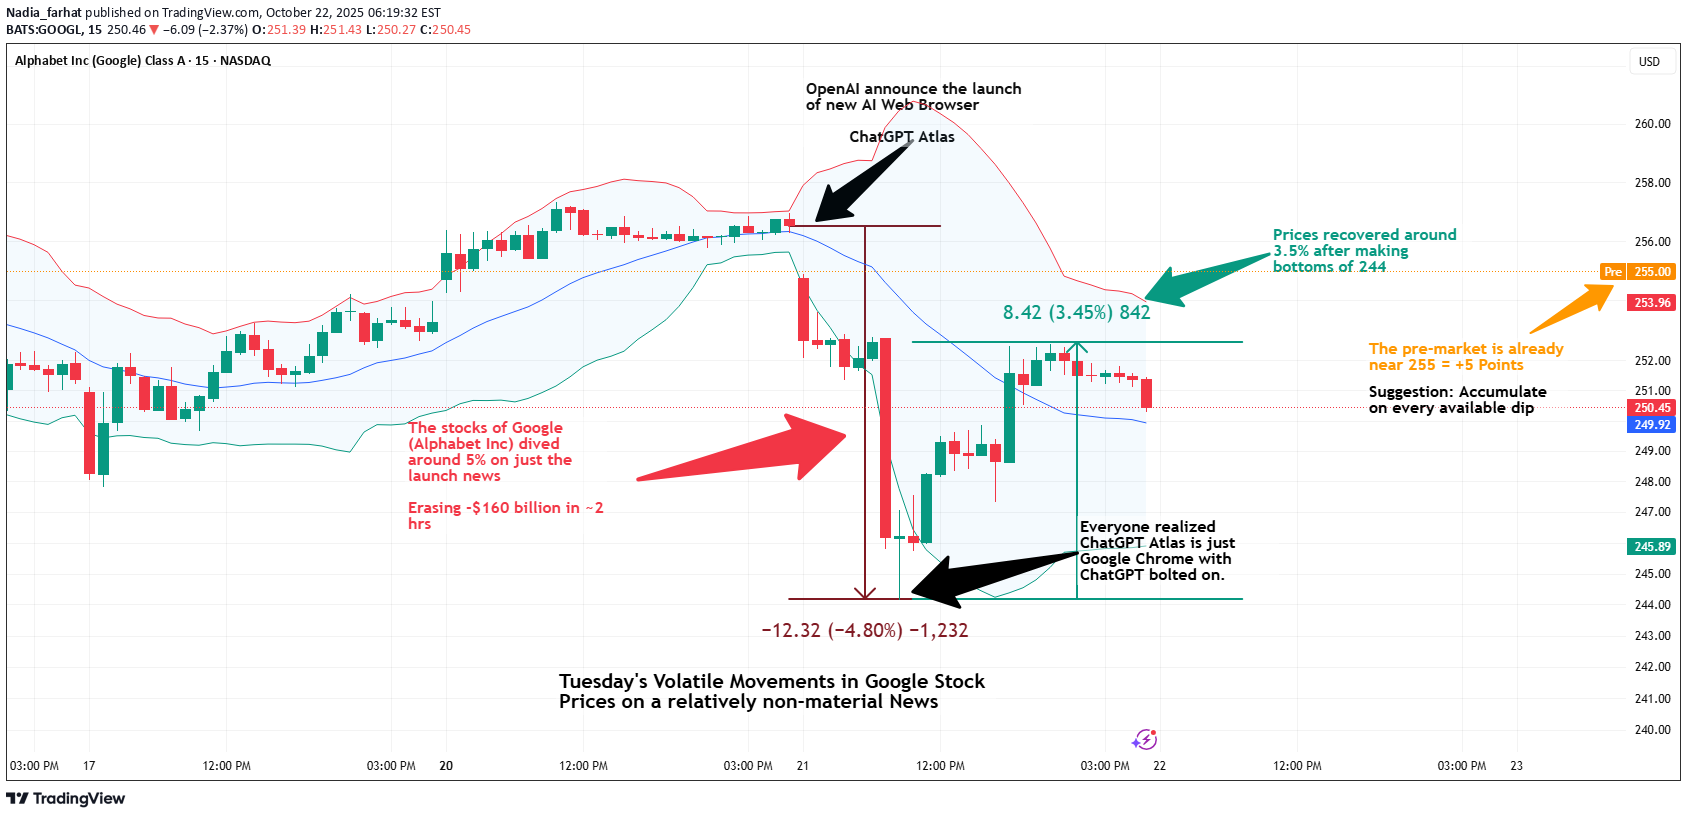
Google Shaken by OpenAI’s Browser Launch — But later Bounced Back - A sudden shock hit the markets (especially Google) as OpenAI announced its new AI web browser on Tuesday - As a result, Google (Alphabet Inc.) stock tumbled nearly 5%, wiping out ~$160 billion in market cap within hours! - But the panic was short-lived — investors soon realized that Atlas is no more of an AI-powered Chrome clone - Google quickly rebounded 3.5%, showing resilience and confidence in its ecosystem. With pre-market already near $255, the message is clear : - Accumulate the stock on every dip.
Nadia_farhat
آراسآی طلا به قله تاریخی رسید: چه هشداری در راه است؟

RSI on Gold's MONTHLY chart hits a whopping 91.3, testing a historic "overbought" level on record, never touched since the 1980s. Not even in 2001, 2008, or 2020
Nadia_farhat
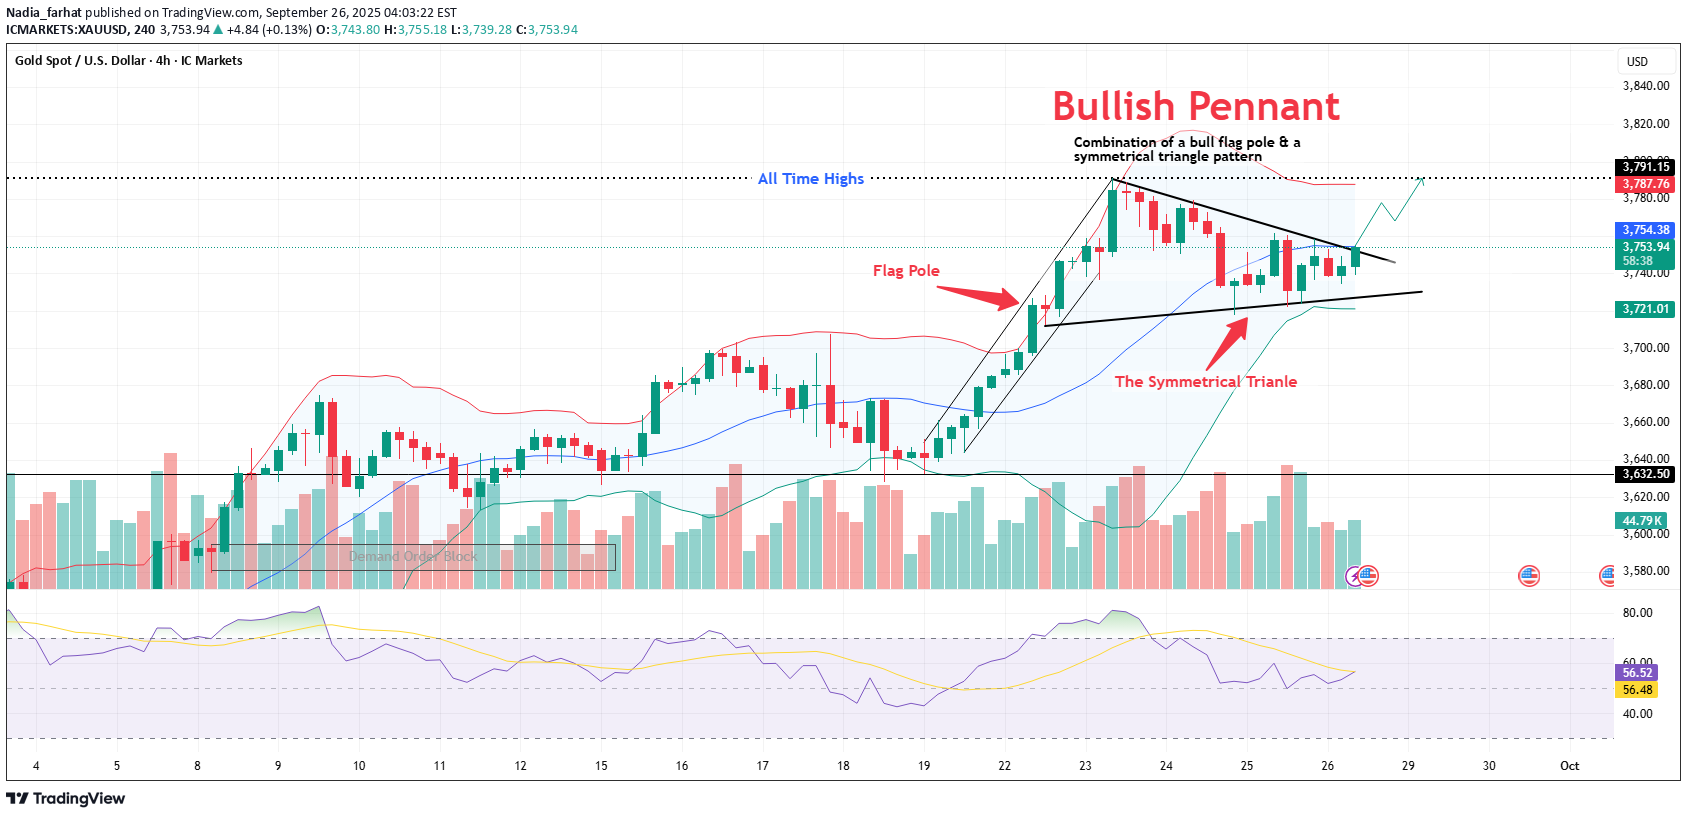
* Gold is showing off a Bullish Pennant on the 4H chart – a classic continuation pattern formed after a strong rally (the flagpole). * That means, after a short consolidation, Gold could be gearing up for another breakout toward new all-time highs - For me, it's the "calm before the next storm" – and if the pattern successfully carries out, then we may see bulls pushing prices above $3,791+. Keep an eye on the breakout zone, currently testing by gold – the next move could be BIG What is a Bullish Pennant? It’s a continuation pattern that forms after a sharp upward move (the “flagpole”). Price then consolidates in a small triangle-like structure (the “pennant”), before often breaking out higher. Gold recently rallied nearly $180 (from $3,610 to $3,790) before pausing into a pennant-shaped consolidation on the 4H chart. Why it matters here? The flagpole in Gold is approx. $180. If the pattern breaks above $3,791–$3,800, the typical projection is another $150–$180 upside. That sets a potential target around $3,950–$3,980. Note: While this is a textbook pattern, breakouts are not guaranteed. Traders watch for confirmation with volume and momentum indicators.
Nadia_farhat

Bitcoin is forming a Head & Shoulder pattern, a classic bearish reversal setup. The right shoulder is in the making, and for that price might fall towards the neckline support around near 104000 level, a crucial zone to watch. The immediate support exists near 110500, if breached successfully, the probabilities of reaching the 104000 zone will rise. A confirmed break below the neckline could accelerate downside momentum toward $100,000–$98,000. RSI is trending lower, showing weakening momentum and supporting the bearish outlook. If neckline holds, a short-term bounce is possible, but overall structure favors sellers. Also on the weekly chart, a clear Evening Star pattern has been creating (while writing this analysis) Hence, taking double confirmation from the daily & weekly chart, Bitcoin prices are expected to fall.
Nadia_farhat
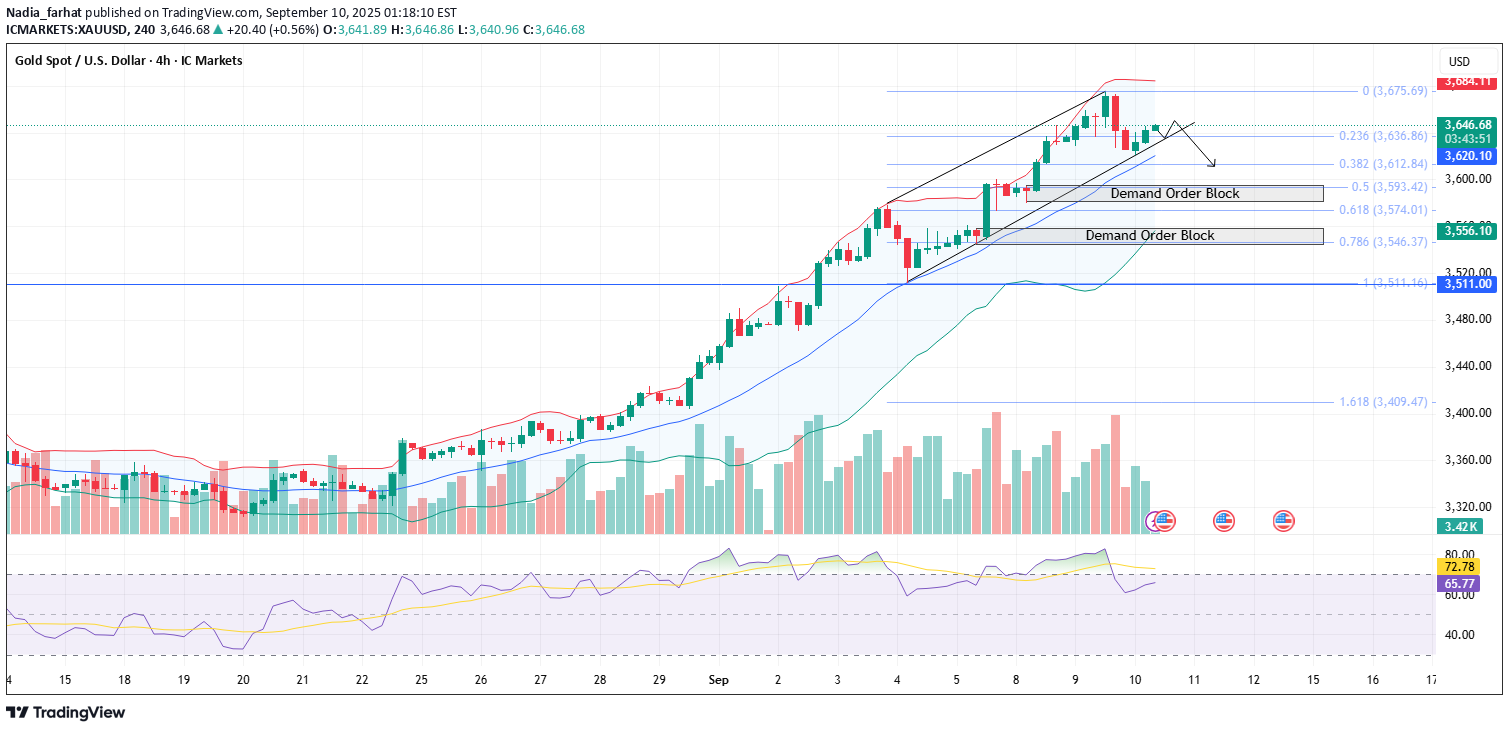
Gold recently tested record highs around $3675, but prices are showing corrections as traders must have started booking profits from the extreme high level. On the 4H chart, the price action remains within an ascending channel, suggesting that the broader trend still carries mild bullish momentum. After touching the lower trendline of the channel, gold is showing signs of stabilization, but upside momentum is weakening. The immediate support lies between $3636 (Fib 0.236 level) and $3620 (middle Bollinger Band) — a breakdown below this zone could trigger further correction toward $3612–$3593 (Fib 0.382–0.5 levels). On the upside, if gold holds above the channel support, recovery toward $3675 highs cannot be ruled out, though momentum indicators suggest caution. Overall: Gold is still in a short-term bullish structure but vulnerable to deeper pullbacks if the key $3636–3620 zone breaks.
Nadia_farhat

Analysis of the "Gold to Silver Ratio" will Reveal Curical Facts Analysis on Weekly Timeframe: 1. The ratio is trending within a symmetrical triangle pattern near 86.5.0, indicating gold is significantly more expensive relative to silver. 2. However, the ratio started declining after reaching peak of 105.5 during April, while testing the upper trend line of the triangle. 3. The ratio is expected to further fall & at least test the lower trendline of the triangle near 80.5, if breached, then support at 75.5 could be witnessed. 4. Currently, the ratio is trending near the levels previously seen during the Global Financial Crisis - 2008, after which it drastically declined. Silver Shines Brighter Than Gold --------------------------------------------------------------------------------------------------------------------- What is the Gold/Silver Ratio? - The Gold/Silver ratio measures the value of gold in relation to silver. - Basically, it tells us how many ounces of silver are needed to buy one ounce of gold. - For example, if gold was trading at $1000 and silver was priced at $20, the gold : silver ratio would be 50. - Current Situation - Gold Rate = ~$3500 & Silver = ~$40; the gold : silver ratio would be ~87.50 Interpretation - A high ratio means gold is more expensive relative to silver (and vice versa) - Historically, it has been seen that, when the ratio rises above 80 (currently it is 87.5), silver gets undervalued relative to gold - An undervalued silver makes it a potential buy against gold.
Nadia_farhat

GOLD Breaks Through The Historic Milestone of $3500 And Hit a RECORD HIGH of 3508.75 Why? * The Sep Fed Rate Cut Expectations are Getting Stronger - * The possibilities of a min of 25 bps cannot be rejected * Powell will blame weaker labor markets for the rate cuts as inflation are already high and sticky. Technical Analysis Gold breached the ascending wedge formation on a Daily TF While also breaking the previous all-time high of 3500 A close above the 3500 level today will raise the probabilities of a further upward rally till at least the 3520 -3530 zone. A failure to sustain above the 3500 level might witness some strong corrections in gold due to profit bookings from ATH level
Nadia_farhat

Overview: Gold is trading near 3340, consolidating near the apex of the symmetrical triangle pattern after recent bearish breakout. Prices successfully hold the key 3330 support. A breakout above the apex could open the path toward 3355 (Fib 0.382) and further toward the 3365 level. Biasness: Gold might gain bullish support as optimism over potential peace talks between Russia and Ukraine is getting fade gaining safe-haven flows. Uncertainty around geopolitical developments and the weakness in US dollar will also support strong upside momentum. Key Levels: R1- 3355 R2- 3365 S1- 3330 S2- 3300 Technical Analysis: The RSI is recovering from oversold territory around 46, suggesting early bullish momentum, while Bollinger Bands are tightening, indicating a potential volatility expansion ahead. Volume remains moderate but shows spikes near support levels, hinting at buyer interest. Overall, intraday traders should watch the triangle breakout direction, as it will dictate the next leg. Data Releases: No major data releases are scheduled today, keeping gold steady as traders look ahead. Market participants now await tomorrow’s U.S. housing starts data for fresh direction. Alternative Scenario: On the downside, a failure to hold above 3330 risks a drop toward 3298–3267. While writing the report, gold is trending at 3340
Disclaimer
Any content and materials included in Sahmeto's website and official communication channels are a compilation of personal opinions and analyses and are not binding. They do not constitute any recommendation for buying, selling, entering or exiting the stock market and cryptocurrency market. Also, all news and analyses included in the website and channels are merely republished information from official and unofficial domestic and foreign sources, and it is obvious that users of the said content are responsible for following up and ensuring the authenticity and accuracy of the materials. Therefore, while disclaiming responsibility, it is declared that the responsibility for any decision-making, action, and potential profit and loss in the capital market and cryptocurrency market lies with the trader.