
NYC1976
@t_NYC1976

What symbols does the trader recommend buying?
Purchase History
پیام های تریدر
Filter
NYC1976
2023-10-24: The BTC by Dajjal Pump
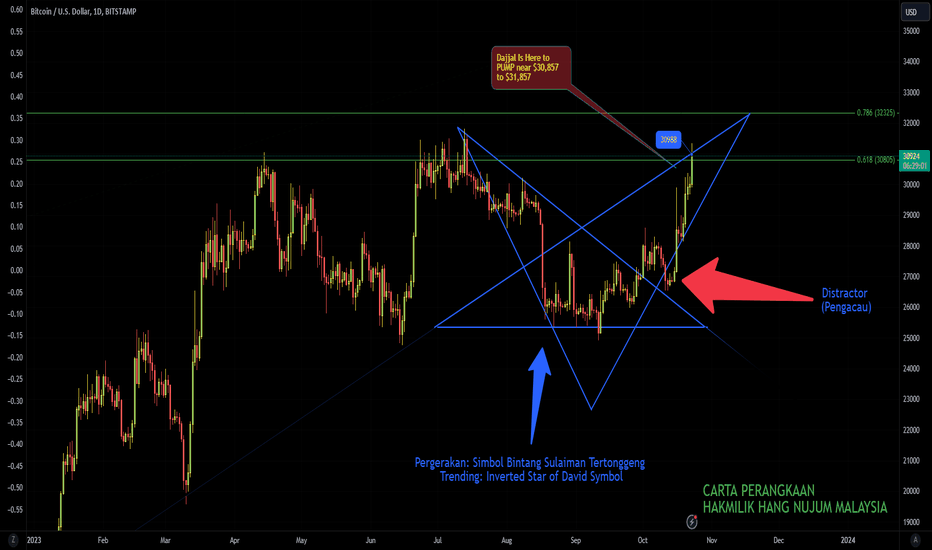
24-10-2023, Tuesday 0052 am: BTC: Today, I wishes to exposed the reason behind as of on the October 19, 2023 where by I've published about Bitcoin is gonna uptrend to $31,000. A week after monitoring, on hand I'd concluded a chart which will formed a Dajjal Symbol (Inverted Star of David) within the Bitcoin Trending Chart that aligned paraller with what's going on to geopolitics and civil warfare in the Middle East. It is something that triggered the sense from retails since Friday-The -13th uptrend movement. Together with other asset such as Gold, Silver and Oil. Before the uptrend really started on Friday night whereby the market is near the closure. It was a Distraction situation so Technical Analyst would think the Bear Sentiment is taking control. Of course, Bullish Sentiment on the weekend isn't a Good Omen as it always have been. This is because it would create a CME Gap on the CME chart. Over here I want to keep the whole story short and sweet. For those who wanted to know the Secret Recipe of the Fibonacci Expansion. I've enclosed the expectation for our reference. So now, I wishes 'Gracias' to everyone here for reading and learning along the way to improves your Wealth-Being and Abundance together. - Hang Nujum Refer article October 19, 2023: (Check on the Comment Section) Refer Chart on October 19, 2023: Formation of Dajjal Pump: Refer Chart of October 24, 2023: Target Hit of Dajjal Pump:The Chart with Full Fibonacci Expansion when included.
NYC1976

NYC1976
BTC 26th Aug 2023: FEAR AND GREED 1D CHART SINCE SUNDAY
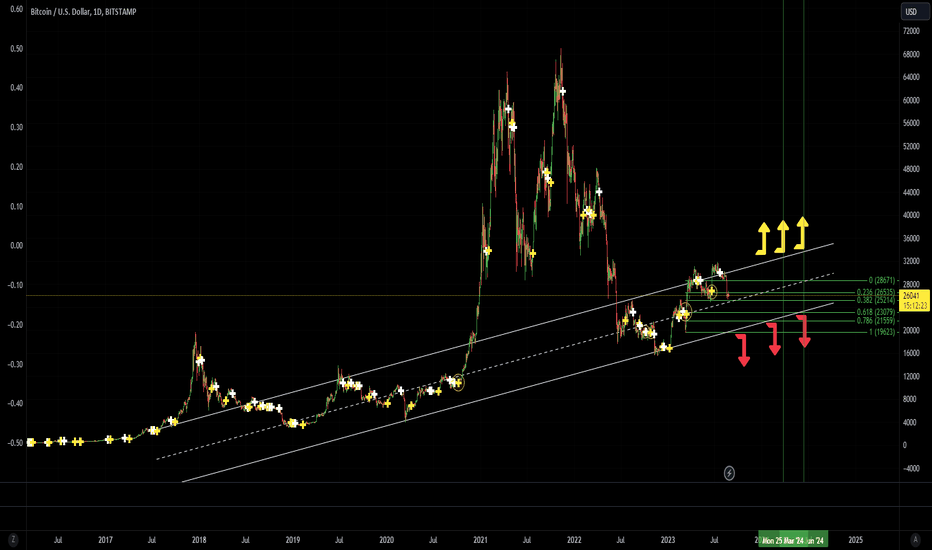
We are here at the current moment. Retails are divided while Institution are in control playing the mind game learning and gaining more and more on the way to profiteering each time. How? Buying Over The Counter without being registered on real exchange volumes. For that said, the Yellow Arrow shows the upward movement while the Red Arrow shows the opposite.2023-08-29, Tuesday2023-8-31,
NYC1976
2023-08-22, Tue: SOLANA 4H (must stay above >$18 or ...)

A sudden change of narrative in many major market including crypto market have rocked globally. Double top reached on RSI can be observed on 4H. Focus on the support line which is critical now. More bearish sentiment than bullish this 3rd quarter of 2023.Solana must maintain to stay above >$18 or face further downtrend.
NYC1976
2023-08-18, BTC 1D CHART: Bottom Rocket Refueling

This month we are witnessing the 2nd refueling to go to the moon estimation of $65K. This is actual chart (not the logarithmic chart). You would be able to see my same ideas from previous published post.
NYC1976
2023-08-15, Tuesday: BTC 1D Log. Chart

The big organisation(s) are waiting for something to hope for. And the authority have been using it as a tool to break their spirit. Don't give up or gave in, push for more holding and buying at sensible cause. And the bull run will prevail with or without ETF approval. It has done it before and it will do it again.2023-08-18 = Tanked You has happened.
NYC1976
2023-08-07, Monday (Before Asian Market Open) 3:21AM: BTC 4H
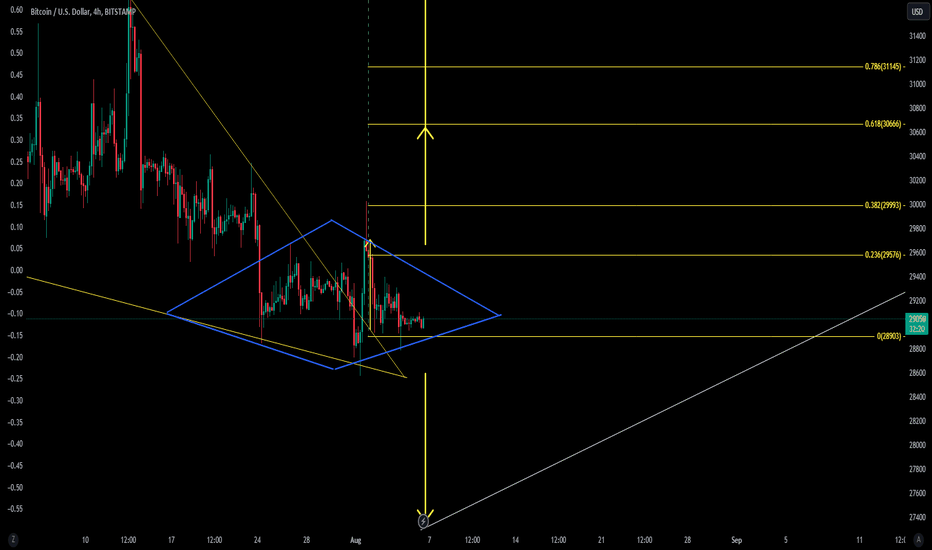
To the East it's Monday now. To the West it's still Sunday afternoon. Bitcoin is out of the descending wedge which the first try out of 0.236 ($29,576) have been rejected. And now basis on experimental Blue Diamond drafted. We shall see how it goes from here and how accurate can this Diamond Pattern be utilized on macro 4H Chart. Usually I would use Diamond Pattern on Daily Chart instead of 4H which is quite fragile to test out.4H CHART2023-08-08, Tuesday 4H2023-, Wednesday 4H &EMA2002023-08-09, BTC zoom out2023-08-13, Sunday. This is Logarithmic Ideas.
NYC1976
2023-08-06, Sunday: This is what currently happen to Solana
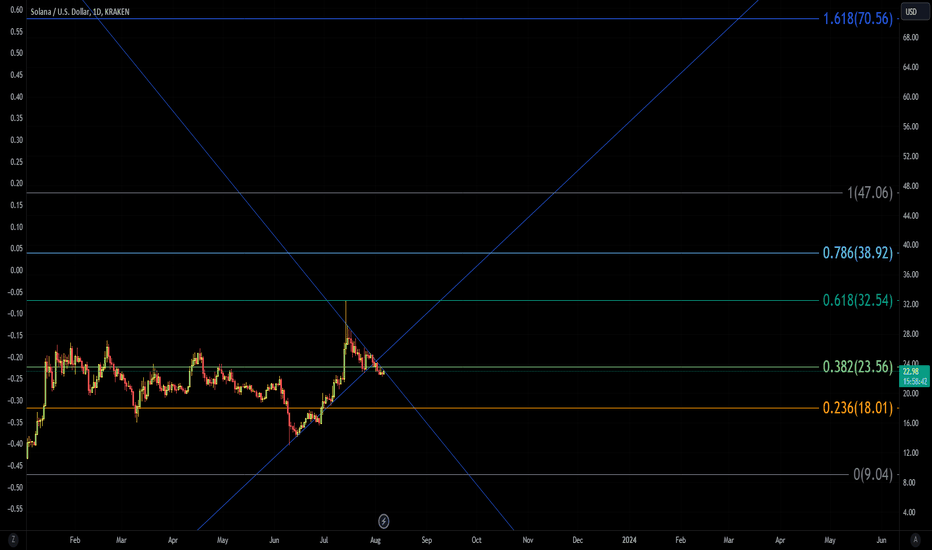
This is the DAY CHART of Solana. You gonna have to wait for a few more months as it would do its thingy ups and down in between 0.236 and 0.382 level. Just being naughty and nice at the same time. A Black Swan Day would be a good triggering point for later stage of strong bound.2023-08-09
NYC1976
2023-08-05, Saturday: KIN 4H. WEEKEND FLIP
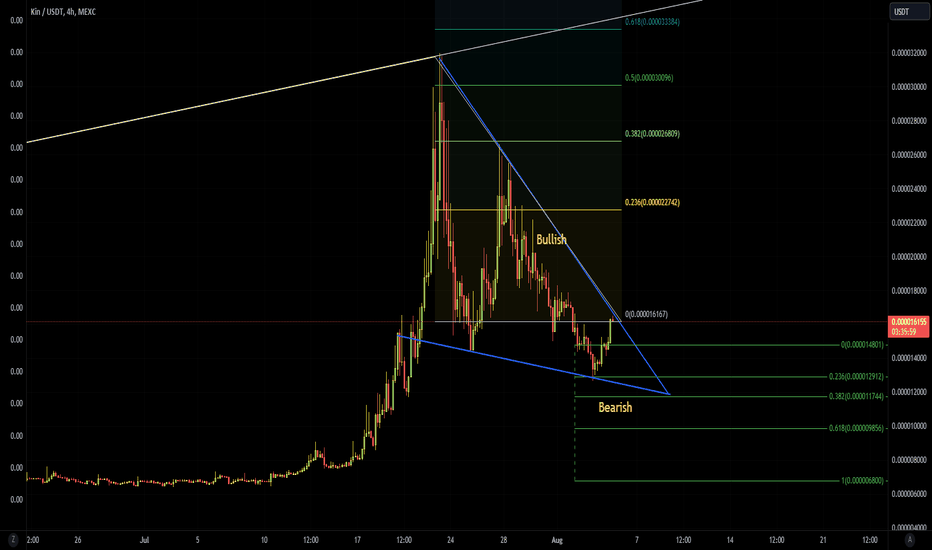
Yesterday's Friday happened that DXY USD INDEX fell by close to -$1 before it managed to get up back to $102. Crypto market seem weaken for most of the asset. Today, Bitcoin didn't really make much of upward moves instead stays around $29,000 range. For KIN this weekend uptrend may be just temporary and nothing significant. DCA buy would be appropriate until bullish sentiment are observed firmed.2023-08-04, Friday2023-08-05, Saturday
NYC1976
2023-08-03: BTC 1D - Your Answer to Bull & Bear & Liquidation
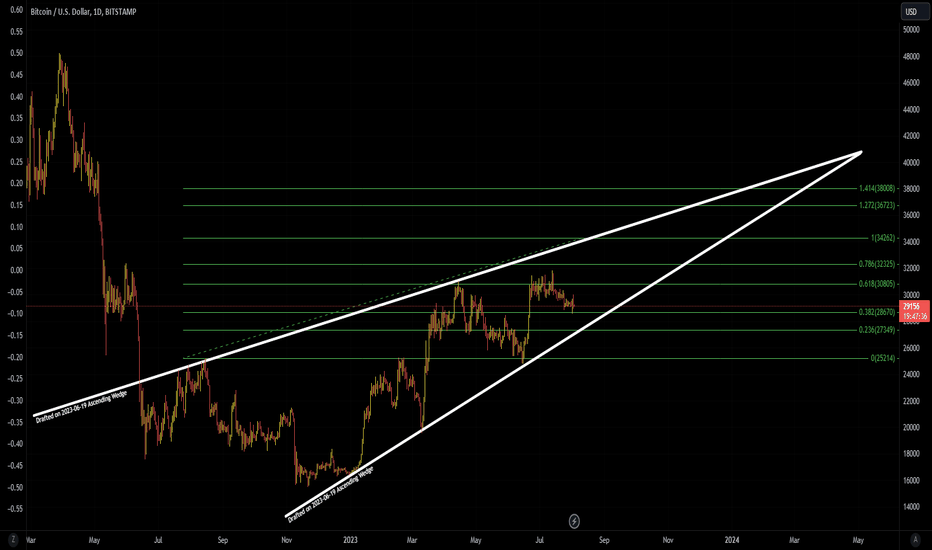
This chart which was not released as I remember. I would be putting the earlier version of this chart in the update comment section. This chart shows the current situation on BTC with the current market accumulation phase. Many are still waiting to buy around 0.236 and 0.382 area (refer to the Fibonacci level for the valuation). Pretty much, I've mentioned about soft-landing yesterday on my other published post. And now this word 'Soft-Landing' which I've mentioned is now being used by the editor of Bitcoinist about GrayScale report on the crypto market with the title "Crypto Market Rebound Hinges On U.S. Economy’s ‘Soft Landing’, Grayscale" about 4 hour ago.June 21, 2023 BTC initial chart (Unpublished version)June 22, 2023 BTC Chart (Unpublished Version 2)August 3, 2023 (Today's version 1)
Disclaimer
Any content and materials included in Sahmeto's website and official communication channels are a compilation of personal opinions and analyses and are not binding. They do not constitute any recommendation for buying, selling, entering or exiting the stock market and cryptocurrency market. Also, all news and analyses included in the website and channels are merely republished information from official and unofficial domestic and foreign sources, and it is obvious that users of the said content are responsible for following up and ensuring the authenticity and accuracy of the materials. Therefore, while disclaiming responsibility, it is declared that the responsibility for any decision-making, action, and potential profit and loss in the capital market and cryptocurrency market lies with the trader.