
Musarrat_karamat
@t_Musarrat_karamat

What symbols does the trader recommend buying?
Purchase History
پیام های تریدر
Filter
Musarrat_karamat
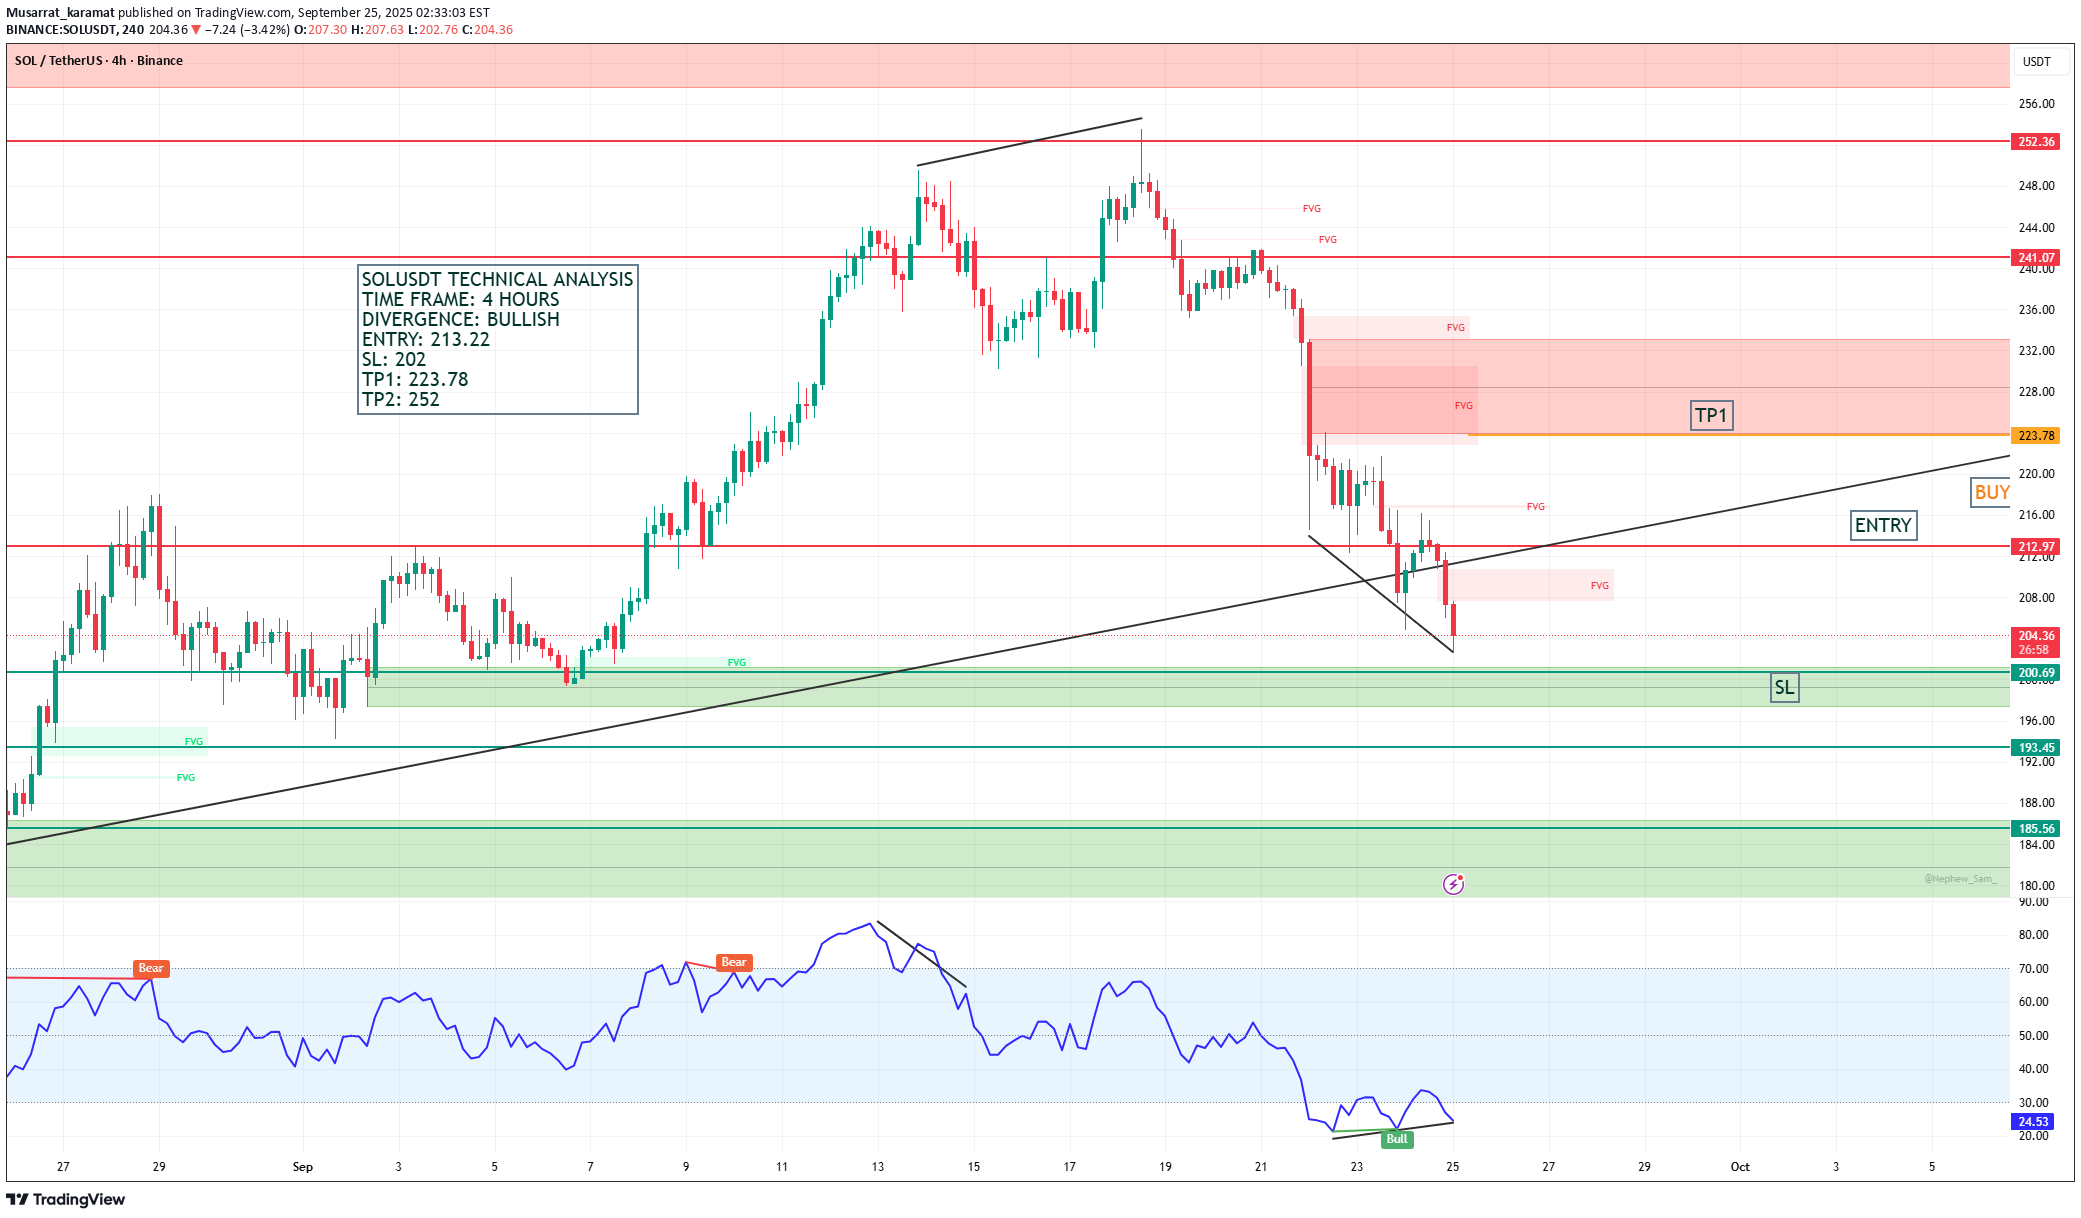
Current Structure: SOL is currently trading around $204.65, testing the lower range after breaking below a short-term trendline. The chart highlights a bullish divergence on RSI, suggesting potential upside momentum. Key Levels: Entry Zone: $213.22 Stop Loss (SL): $202 Take Profit 1 (TP1): $223.78 Take Profit 2 (TP2): $252 Market Context: The chart shows a falling wedge breakout setup, often a bullish reversal pattern. RSI has marked a bullish divergence, signaling potential strength building despite recent price drops. Price is near a major demand zone (green area) around $200–$193, which adds confluence to the bullish case. Bullish Targets: TP1 ($223.78): Aligns with previous liquidity area and fair value gap (FVG). TP2 ($252): Major resistance zone where sellers may step in again. Bearish Risk: If SOL breaks below $202 support, it could revisit deeper demand zones near $193 and even $185.
Musarrat_karamat
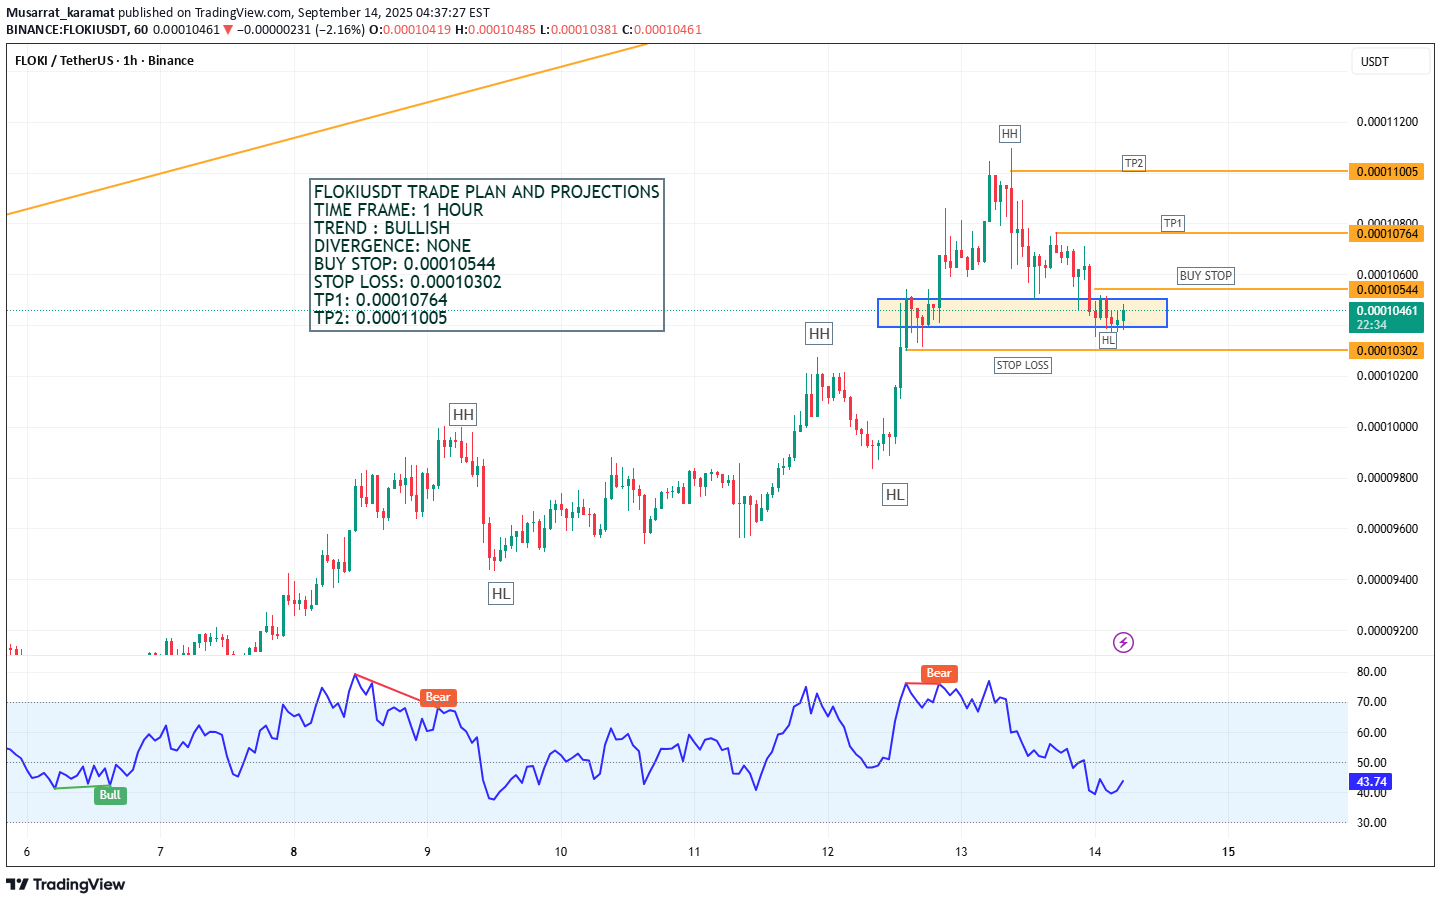
FLOKI/USDT Trade Plan & Price Projection 🕐 Time Frame: 1 Hour 📊 Trend: Bullish 🔎 Divergence: None 📅 Chart Date: September 14, 2025 🔹 Market Structure: FLOKI is currently forming a bullish market structure on the 1H chart. Price has been consistently making Higher Highs (HH) and Higher Lows (HL), confirming an uptrend. A fresh HL has recently formed at support, indicating potential for another leg up. 🔹 Trade Setup: Buy Stop: 0.00010544 Stop Loss: 0.00010302 Take Profit 1 (TP1): 0.00010764 Take Profit 2 (TP2): 0.00011005 Price is currently consolidating within a support zone marked in blue, offering a low-risk entry near structure. The stop loss is placed just below the support area to protect capital if the bullish structure fails. 🔹 Indicators & RSI: RSI is currently hovering around 44.95, below the 50 mark, showing mild bearish momentum but still within a neutral range. Previous Bearish Divergences were observed but have played out. No divergence is currently present, which aligns with the bullish continuation possibility. 🔹 Key Notes: Break above 0.00010544 would confirm bullish continuation. Targets align with previous swing highs and Fibonacci extensions. A break below 0.00010302 would invalidate this setup and suggest reevaluation.
Musarrat_karamat

BTCUSDT Technical Analysis – 4H BITCOIN is forming a Harmonic Cypher pattern, which usually signals a potential bullish reversal from the D-point completion zone. After an extended corrective move down from the recent highs, BTC has now reached the D level (~108,000), aligning with harmonic completion and RSI showing a bottoming signal near 37.8. 🔎 Key Trade Plan Entry: Instant (near current levels ~108,800) Stop Loss: 105,033 Take Profit 1: 113,472 Take Profit 2: 118,938 Extended Targets: 125,000 and 141,000 (if momentum sustains) 📈 Outlook The Cypher pattern suggests that BTC may have completed its retracement leg and is preparing for a bullish continuation. RSI has already printed multiple bullish signals at lows, supporting the case for a rebound. Initial resistance lies around 113k–114k, and a break above this level could accelerate the move toward 118k and beyond. ✅ Conclusion: BTC/USDT on the 4H timeframe is showing a bullish harmonic setup, with strong reversal potential from the Cypher completion zone. Traders can position long with stops below 105k, eyeing targets from 113k to 141k in stages.
Musarrat_karamat

SOL is showing strength with an Inverse Head & Shoulders formation, signaling a bullish continuation. Price is consolidating just below the neckline at 212.54, where a breakout could trigger the next leg higher. Trade Plan: Buy Stop: 212.54 SL: 175.80 Targets: 240.22 → 264.02 → 294.54 With RSI holding near 58.8 and trendline support intact, SOL is well-positioned for an upside breakout toward $294 in the coming sessions.
Musarrat_karamat

Overall Trend On the 4-hour timeframe, Gold is consolidating after its recent drop from 3,409 USD. Price is holding within Fibonacci retracement levels, indicating possible short-term bullish bounce. 📈 Chart Highlights Fibonacci Structure Price retraced into the 0.5 – 0.618 Fib zone (3,338 – 3,318 USD), also known as the “golden pocket.” This area acts as a potential buy zone, providing technical support. Trade Setup Entry (Buy Plan): 3,338 USD. Stop Loss (SL): 3,328 USD (below 0.618 support). Target (TP): 3,354 USD (near 0.382 Fib resistance at 3,355.35). Support & Resistance Support: 3,298 USD (Fib 0.786) and 3,267 USD (Fib 1.0). Resistance: 3,355 – 3,376 USD zone before 3,409 USD retest. 📊 Indicators RSI Divergence (14-period): Current reading: 46.92, slightly below neutral. Not yet overbought, leaving room for upside. Previous bearish divergences caused corrections, but no strong bullish divergence is printed yet. 🔑 Trading View Gold is currently at a critical retracement support zone. A bounce from 3,338 – 3,328 USD range could push price toward 3,354 – 3,376 USD. If 3,328 support fails, deeper retracement toward 3,298 – 3,267 USD may follow.
Musarrat_karamat

Gold is showing a bullish divergence on the 1-hour timeframe, signaling a potential reversal from recent lows. The trade plan suggests a buy entry at 3341, with Stop Loss at 3320 to manage downside risk. 📈 Targets: TP1: 3360 TP2: 3380 The price is holding near the 1hr fair value gap zone and aligned with Fib retracement levels, supporting a bounce. Watch for momentum confirmation on lower timeframes before entry.
Musarrat_karamat

SOL has completed a strong bullish leg and is now reacting from the 0.236 Fibonacci retracement level at 188.63. A sell setup is developing based on this resistance zone and weakening momentum. 🔻 Trade Plan: Sell Stop: 188.63 SL: 209.49 TP1: 176.93 (38.2% Fib) TP2: 166.53 (50% Fib) 📉 RSI at 61.02 shows early signs of a bearish divergence. If price loses momentum at current levels, this setup could offer a solid retracement trade toward the mid-Fibonacci levels. Watch for breakdown confirmation and manage risk accordingly.
Musarrat_karamat

Solana (SOL) is showing signs of a potential bullish reversal on the 15-minute timeframe after a sharp downtrend. Price has reclaimed key support levels and is preparing for a possible breakout. 📈 Projections & Trade Plan: Entry: 161.24 (above immediate resistance) Stop Loss (SL): 157.23 (below recent swing low) Take Profit (TP): TP1: 165.23 (near previous resistance cluster) TP2: 168.64 (targeting the upper resistance zone) Technical Insights: The price has broken the descending structure and is showing bullish momentum with a clean impulse leg upwards. A minor pullback to the entry zone would provide an optimal long opportunity before continuation towards TP levels. Momentum Indicators: RSI is trending upwards at 55.56, indicating strengthening buying pressure. Multiple bullish divergences can be observed, which align with the reversal thesis. ⚡ Bias: Bullish If price holds above 161.24 and confirms breakout strength, we can expect a move toward 165.23 and potentially extend to 168.64. However, failure to hold above 161.00 may invalidate the setup.
Musarrat_karamat

SUI is exhibiting a potential bullish setup on the 1-hour timeframe as price begins to build momentum after a period of consolidation.📈 Current Setup:Price has formed a minor ascending trendline and is trading above the short-term moving averages, indicating growing bullish strength.A buy stop is placed slightly above the immediate resistance at 2.9222, which would confirm a breakout from the consolidation zone.✅ Trade Plan:Entry (Buy Stop): 2.9222Stop Loss (SL): 2.8778 (below recent swing low support)Take Profit (TP): 2.9507 (near previous resistance cluster)📊 Momentum Indicators:RSI is currently at 60.19, which supports the bullish bias but is not yet in overbought territory, leaving room for an upward move.Earlier bearish divergence has been resolved as price found support, and a bullish signal has emerged, suggesting renewed upward momentum.⚡ Bias: Moderately BullishPrice needs to break and hold above 2.9222 to confirm continuation toward the target zone. Caution is warranted if price fails to sustain above the breakout level.
Musarrat_karamat

#FLOKI is showing a clear bullish structure on the 4-hour timeframe, aligning with its upward momentum on the daily and monthly charts. The price has formed a series of higher lows (HL) and higher highs (HH), indicating strength in the current trend.📈 Breakout Zone: The pair has successfully broken above the key resistance zone around 0.00008300, confirming bullish continuation. This breakout opens the path for further upside potential.✅ Trade Plan:Entry: A buy position above 0.00008300Stop Loss (SL): 0.00007190 (below the recent HL support zone)Take Profit (TP):TP1: 0.00009236TP2: 0.00009880📊 Momentum Indicators:The RSI is currently near the overbought territory (69.18) but remains supportive of bullish price action as there is no immediate divergence forming post-breakout. Previous bearish divergence played out during consolidation but has since been invalidated.⚡ Bias: BullishA strong breakout and retest of the previous resistance-turned-support would further strengthen the upside thesis. Caution is advised near the TP1 zone as partial profit-taking may occur.
Disclaimer
Any content and materials included in Sahmeto's website and official communication channels are a compilation of personal opinions and analyses and are not binding. They do not constitute any recommendation for buying, selling, entering or exiting the stock market and cryptocurrency market. Also, all news and analyses included in the website and channels are merely republished information from official and unofficial domestic and foreign sources, and it is obvious that users of the said content are responsible for following up and ensuring the authenticity and accuracy of the materials. Therefore, while disclaiming responsibility, it is declared that the responsibility for any decision-making, action, and potential profit and loss in the capital market and cryptocurrency market lies with the trader.