
Mr_Thomas1
@t_Mr_Thomas1

What symbols does the trader recommend buying?
Purchase History
پیام های تریدر
Filter
تحلیل بیت کوین با اسمارت مانی (SMC): آیا ریزش بزرگ آغاز شده است؟
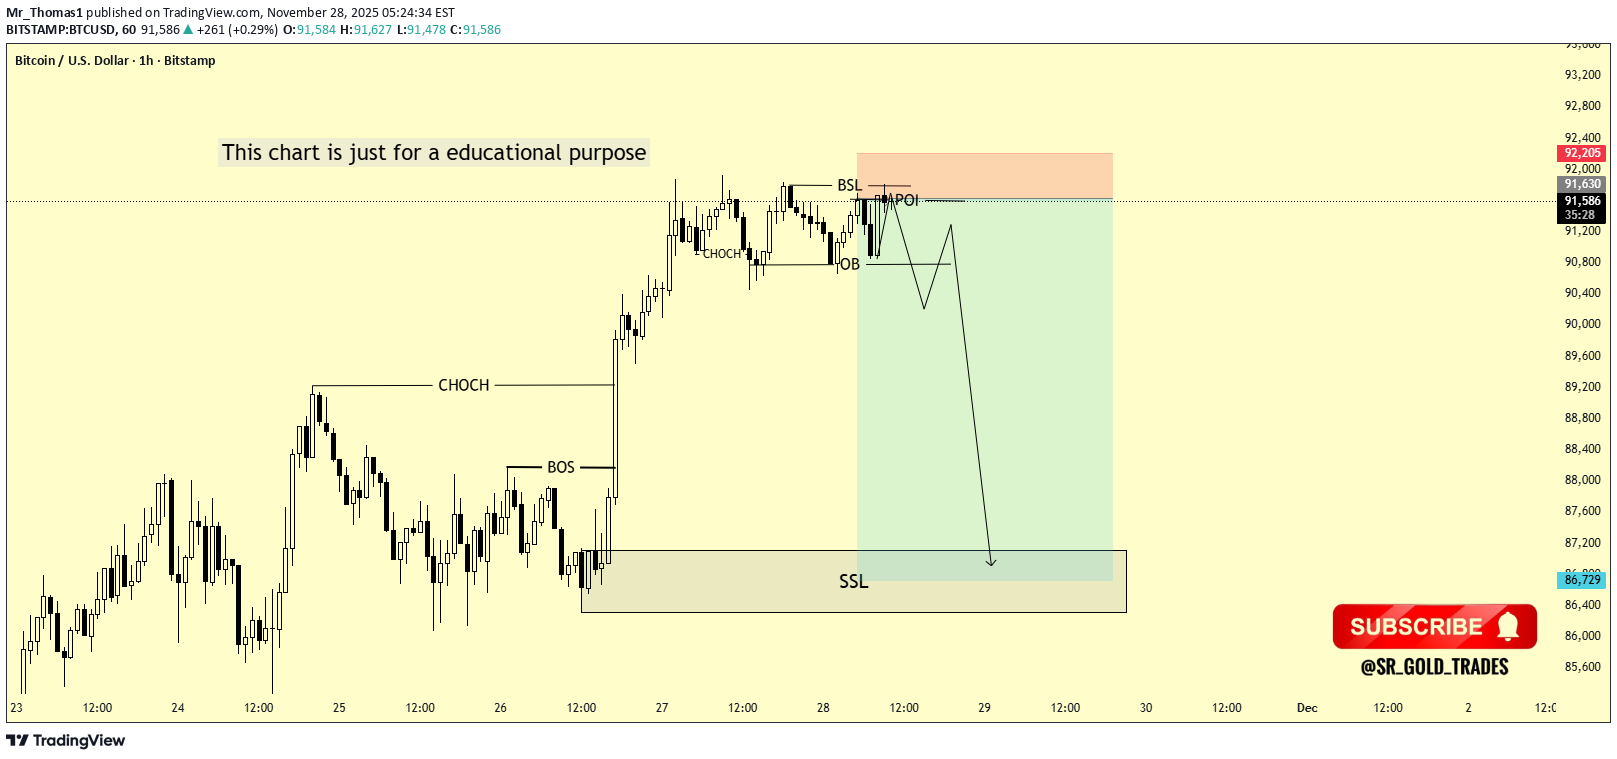
This chart illustrates a Smart Money Concepts (SMC)–style analysis of Bitcoin on the 1-hour timeframe. SMC focuses on market structure, liquidity, order blocks, and institutional price behaviour. Below are the key elements visible on your chart: --- ## 1. Market Structure Shifts ### CHoCH – Change of Character * Signals the first hint that market direction may be shifting. * You have CHoCH markings showing a shift from bearish → bullish earlier, and now a potential shift from bullish → bearish. ### BOS – Break of Structure * Confirms continuation in the new direction. * BOS is shown after price breaks previous highs during the bullish move. --- ## 2. Liquidity Concepts ### BSL – Buy-Side Liquidity * Pool of stop-losses above previous highs. * Price wicks into this BSL area to collect liquidity before reversing. ### SSL – Sell-Side Liquidity * Liquidity resting under equal lows or major swing lows. * Your chart shows SSL as the downside target, suggesting price may sweep this area. --- ## 3. Order Blocks (OB) * Zones where institutional orders are likely positioned. * The OB marked near the local high acts as a potential supply zone where price may reject (start falling). --- ## 4. POI – Point of Interest * A refined zone where the analyst expects a reaction. * Your POI aligns with the supply region after liquidity is taken from the BSL. --- ## 5. FVG / Imbalance (Not labeled but visible) * The long impulse up created imbalances that price may return to fill. * Supports the idea of a deeper retracement. --- # 📉 Summary of the Chart’s Predictive Outlook This chart presents a bearish SMC setup: 1. Price runs Buy-Side Liquidity (BSL) above recent highs. 2. After collecting liquidity, price begins showing weakness near the POI. 3. A Change of Character (CHoCH) confirms loss of bullish strength. 4. Expectation: * Short-term pullback * Followed by a continuation downward 5. Final target: Sell-Side Liquidity (SSL) zone around 86k–87k * This includes an Order Block and major liquidity cluster. In simple terms: ➡ Price grabbed liquidity above the highs → showed a bearish shift → likely to drop toward the large liquidity pool below. What you think about it, write in the comment section.
Disclaimer
Any content and materials included in Sahmeto's website and official communication channels are a compilation of personal opinions and analyses and are not binding. They do not constitute any recommendation for buying, selling, entering or exiting the stock market and cryptocurrency market. Also, all news and analyses included in the website and channels are merely republished information from official and unofficial domestic and foreign sources, and it is obvious that users of the said content are responsible for following up and ensuring the authenticity and accuracy of the materials. Therefore, while disclaiming responsibility, it is declared that the responsibility for any decision-making, action, and potential profit and loss in the capital market and cryptocurrency market lies with the trader.