
Mr_King_professional
@t_Mr_King_professional

What symbols does the trader recommend buying?
Purchase History
پیام های تریدر
Filter
Mr_King_professional
تحلیل بیت کوین: شکست الگوی سر و شانه معکوس و هدفهای صعودی جدید!
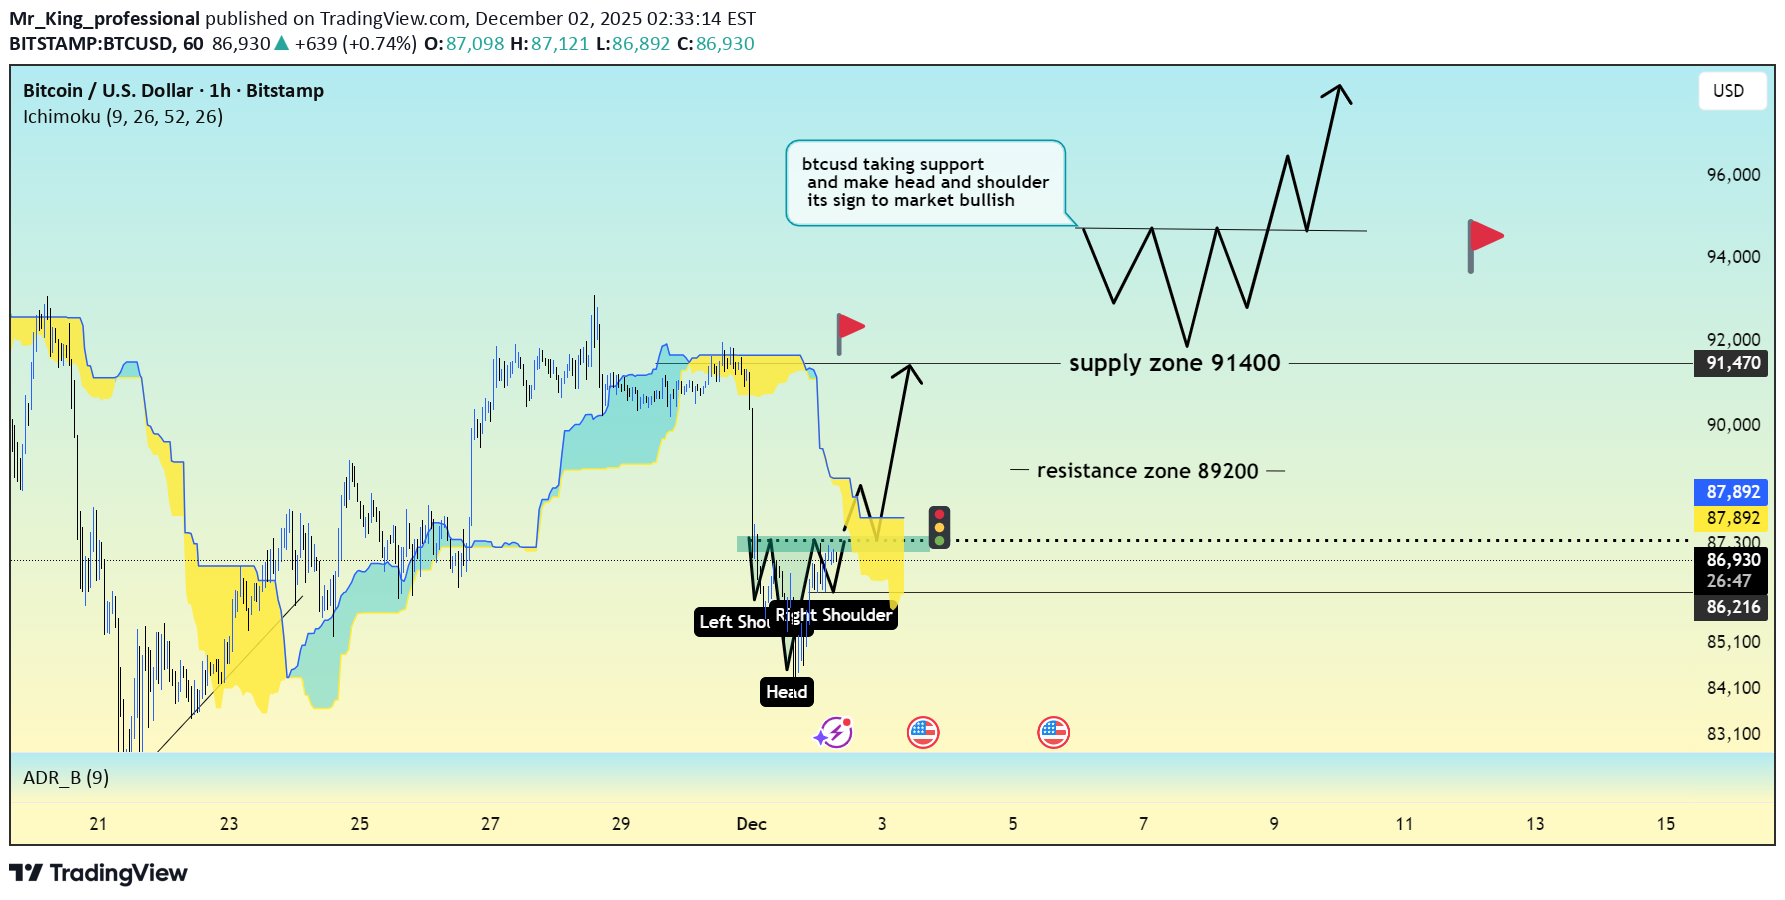
Chart Analysis An inverse head and shoulders has formed in this zone, signaling a possible shift from bearish pressure to bullish momentum. Left shoulder, head, and right shoulder all developed near the same demand region, showing consistent buying interest. --- Key Levels 🔹 Resistance Zone: 89200 Price has rejected this level multiple times. A sustained break above it would open the door for further upside. 🔹 Supply Zone: 91400 A major supply area where selling pressure has appeared before. If price reaches this zone, a reaction can be expected. --- 🔶 Structure Confirmation A clean neckline breakout would confirm strength in the pattern. If price pulls back for a retest, that level can act as fresh support and trigger continuation to the upside. Overall structure still favors upward movement. --- 📈 Expected Move Right shoulder formation supports a potential bullish push. A retest of the neckline can serve as support. First target sits around 89200, and if that breaks, the next objective is the 91400 zone. --- Market Bias As long as the structure holds and support levels remain intact, the overall bias stays bullish.
Mr_King_professional
بیت کوین در آستانه انفجار قیمتی؛ سطح حیاتی ۹۲۰۰۰ دلار کجاست؟
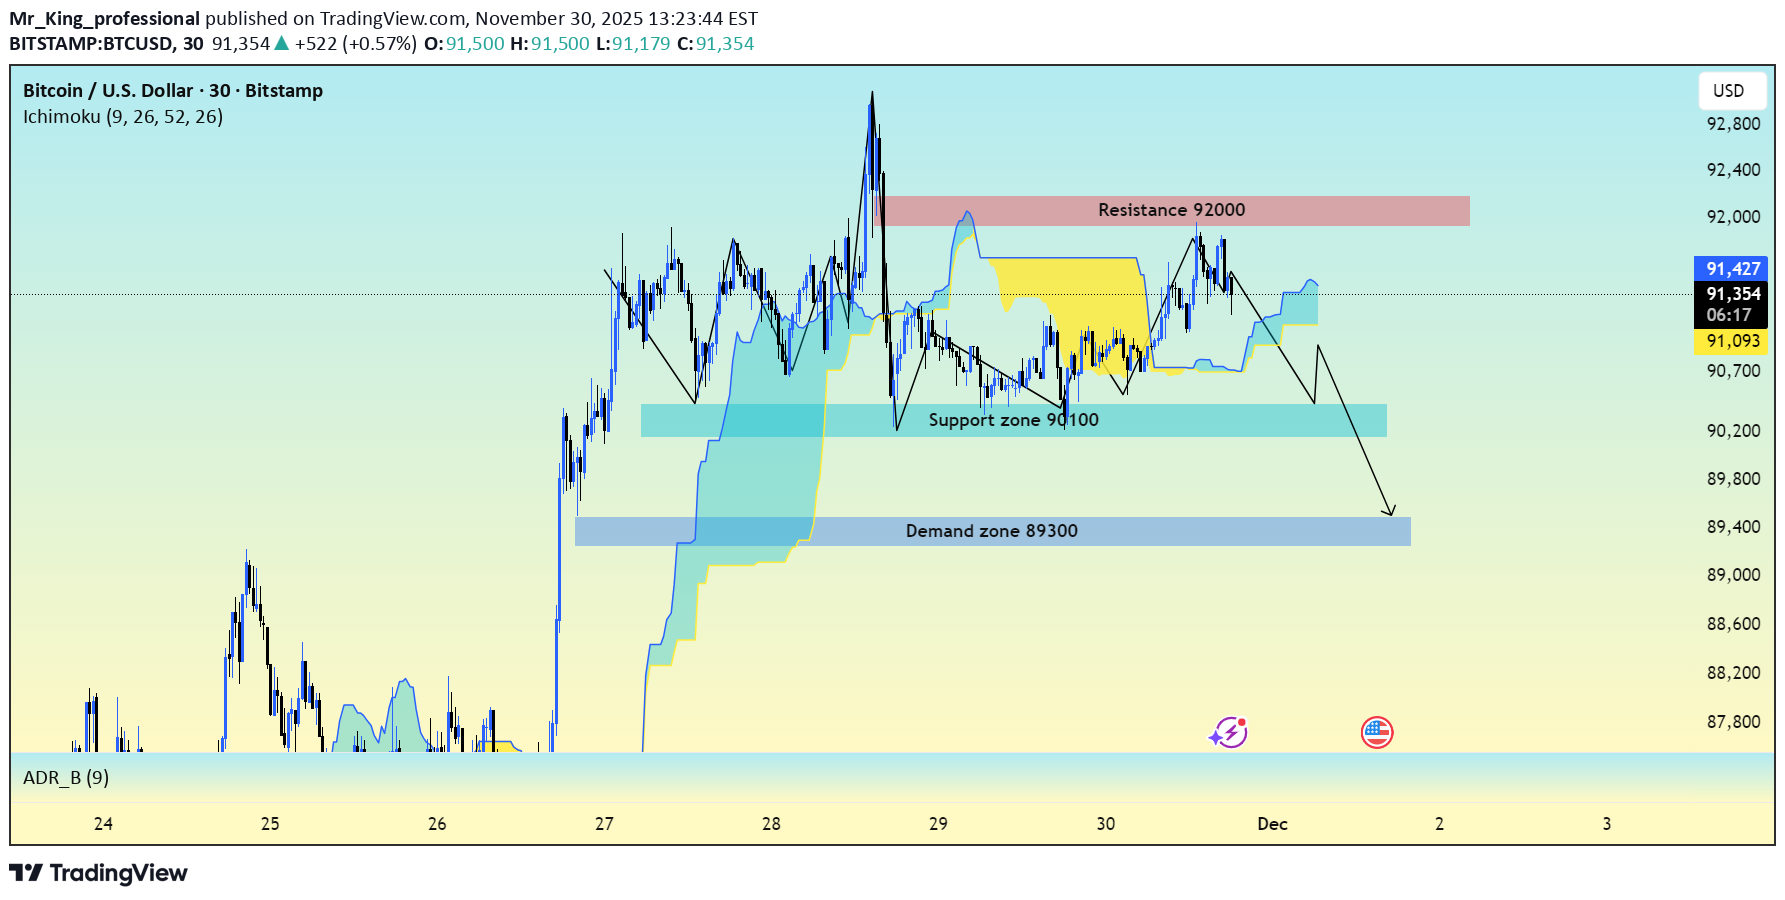
BTC is currently trading inside a high-compression range, building energy between 90,100 support and 92,000 resistance. This structure is typical before large expansion moves, and the orderflow clearly shows smart-money positioning on both sides. --- 🔍 Market Structure Overview Price has been forming: Higher liquidity lows above 89,800 (accumulation) Repeated rejections below 92,000 (suppressed breakout) A tightening profile on volume, indicating preparation for a major move This is exactly how BTC behaves before range expansion. --- 📊 Volume & Orderflow Insight The Point of Control sits in the mid-range, confirming value acceptance. Buy-side absorption is increasing near support, while liquidity is building above 92,000 — creating the perfect setup for a liquidity sweep → breakout. --- 📌 Key Levels Support Zones 90,100 – intraday support 89,800 – institutional demand Resistance Zones 92,000 – key breakout level 92,600 – post-break distribution 93,150 – major liquidity pocket --- 📈 24–48 Hour Expectation (High Probability) BTC is likely to break the compression soon. As long as price holds above 89,800, the market structure remains bullish-biased. Bullish Targets: 92,600 93,150 94,000 (extended target) A clean break above 92,000 should trigger a strong continuation surge. --- 📉 Bearish Scenario (If Demand Fails) Break and close below 89,800 opens the path toward: 89,300 88,600 87,900 This scenario has low probability unless macro events intervene. --- ⭐ Professional Summary Market is in accumulation Liquidity is building above 92,000 Breakout is imminent Bias remains bullish until 89,800 breaks Expecting expansion in the next 24–48 hours --- 🔥 Analyst Note BTC is setting up for a clean breakout. Traders should focus on 92,000 as the decision level. This type of structure rarely stays compressed for long — the next move should be strong.First and target second successfully completedall targets achieved successfully
Mr_King_professional
تحلیل بیت کوین (BTCUSD): منطقه طلایی بازگشت صعودی و اهداف قیمتی دقیق!
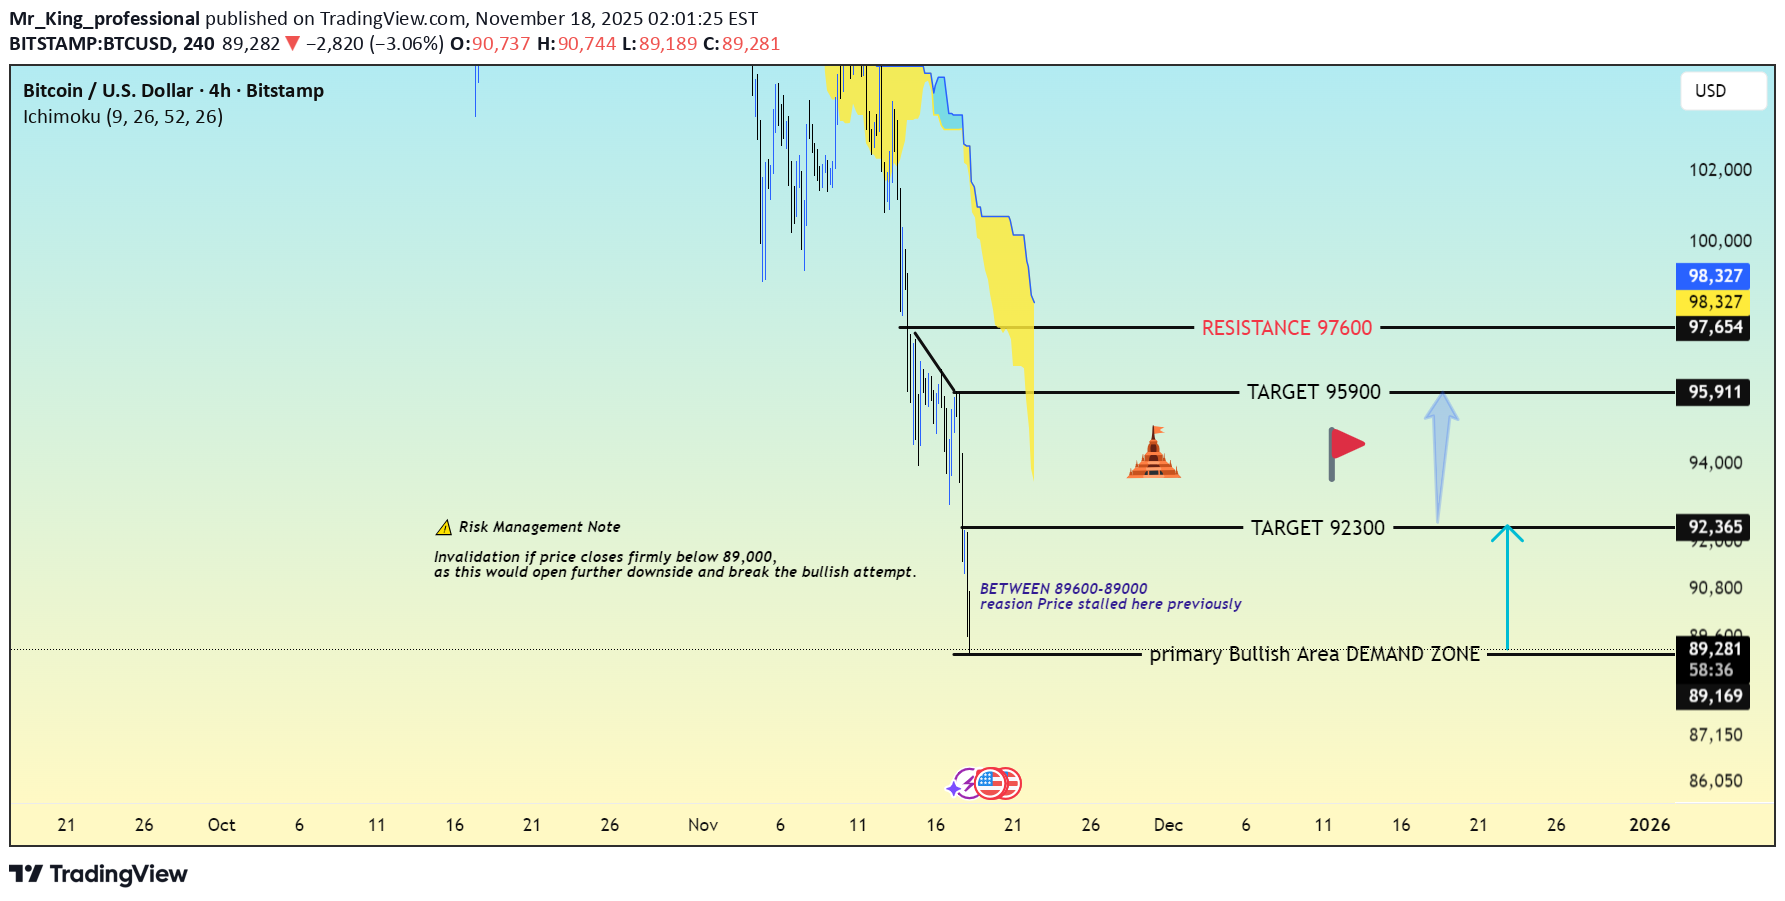
Smart Money Levels • Volume Profile • High-Accuracy Structure BTCUSD is trading inside a major bullish demand zone, where price has reacted multiple times in the past. The chart shows a clear confluence of volume imbalance, demand, and liquidity, making this a high-value area to watch. --- 🟩 Primary Bullish Demand Zone 89,000 – 88,500 Why this zone matters: Previous strong bullish reactions High volume node (buyers active before) Market sweeping liquidity under prior lows Demand + imbalance overlap Price slowing down as it enters the zone This area creates a strong opportunity for a bullish reaction or short-term reversal. --- 🎯 Upside Targets (Clean & Realistic) TARGET 1: 89,900 – Quick Reaction Target First liquidity pocket and the zone where short-term profit taking may begin. TARGET 2: 92,300 – Medium-term Target Aligns with previous consolidation and a clear volume shelf. TARGET 3: 95,900 – High-Probability Extended Target This is the major upside magnet if momentum continues. Also aligns with your chart’s FIB retracement + volume profile gap. --- 🟥 Key Resistance Zone 97,600 This is the major supply zone where BTC has struggled previously. A clean break above 97,600 would shift the entire mid-term structure bullish. --- ⚠️ Risk Management Note A break and 4H close below 88,500 will invalidate the bullish setup. This could open room toward deeper downside levels. --- 💡 Professional Insight “Reversal zones don’t guarantee direction — reactions do. Let price show a bullish footprint before entering: BOS, engulfing, or strong wick rejection.” --- 📢 If this analysis helps, LIKE & FOLLOW — your support pushes this chart to more traders! 🙏🚀Target reached successfully completed👌💯 for more latest Updates on BTCUSD follow me like my like my idea for your support
Mr_King_professional
کاهش قیمت طلا قطعی شد؟ بهترین زمان فروش زیر این سطح!
Gold is forming lower highs and lower lows on H1, showing clear bearish momentum. Price is consolidating below resistance near 4080–4090, which signals weakness. • Bearish confirmation below: 4048 • Aggressive sell zone: 4075–4088 (retest of supply) Targets: 4040 / 4020 Invalidation: Above 4095 Always wait for a clean candle close before entering a breakout trade.First target reached successfully 4075 to 4040Target reached Successfully 4075to 4020
Mr_King_professional
مناطق خرید طلای داغ: کانون حمایت ایچیموکو و ساختار بازار کجاست؟
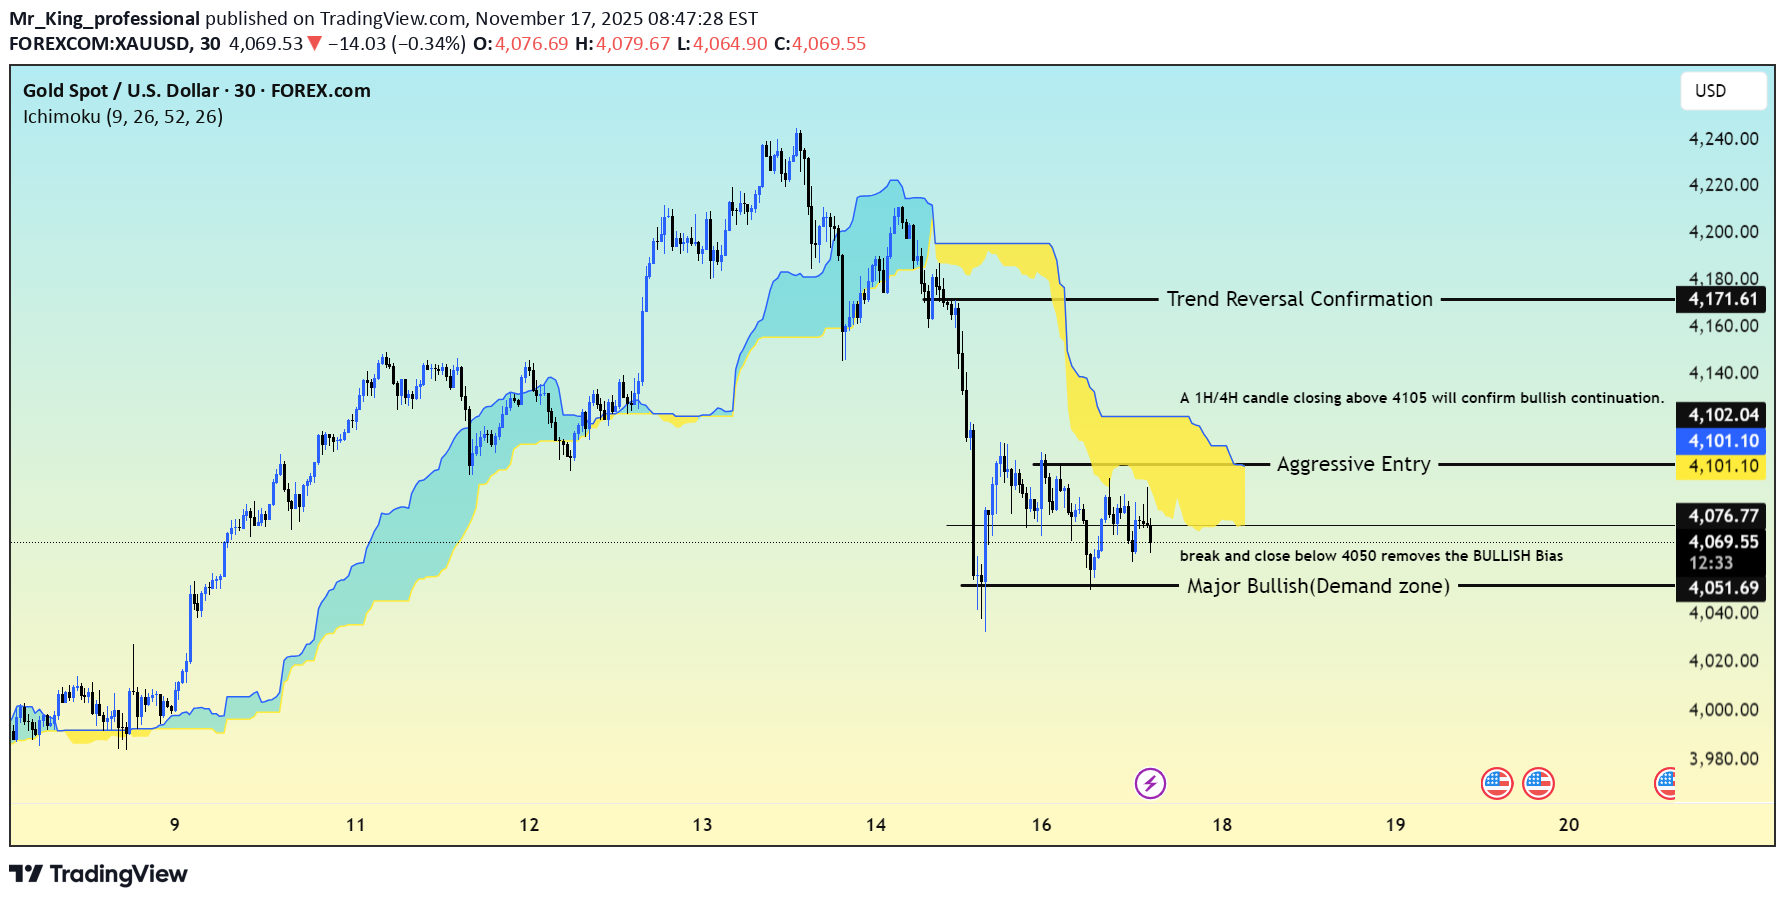
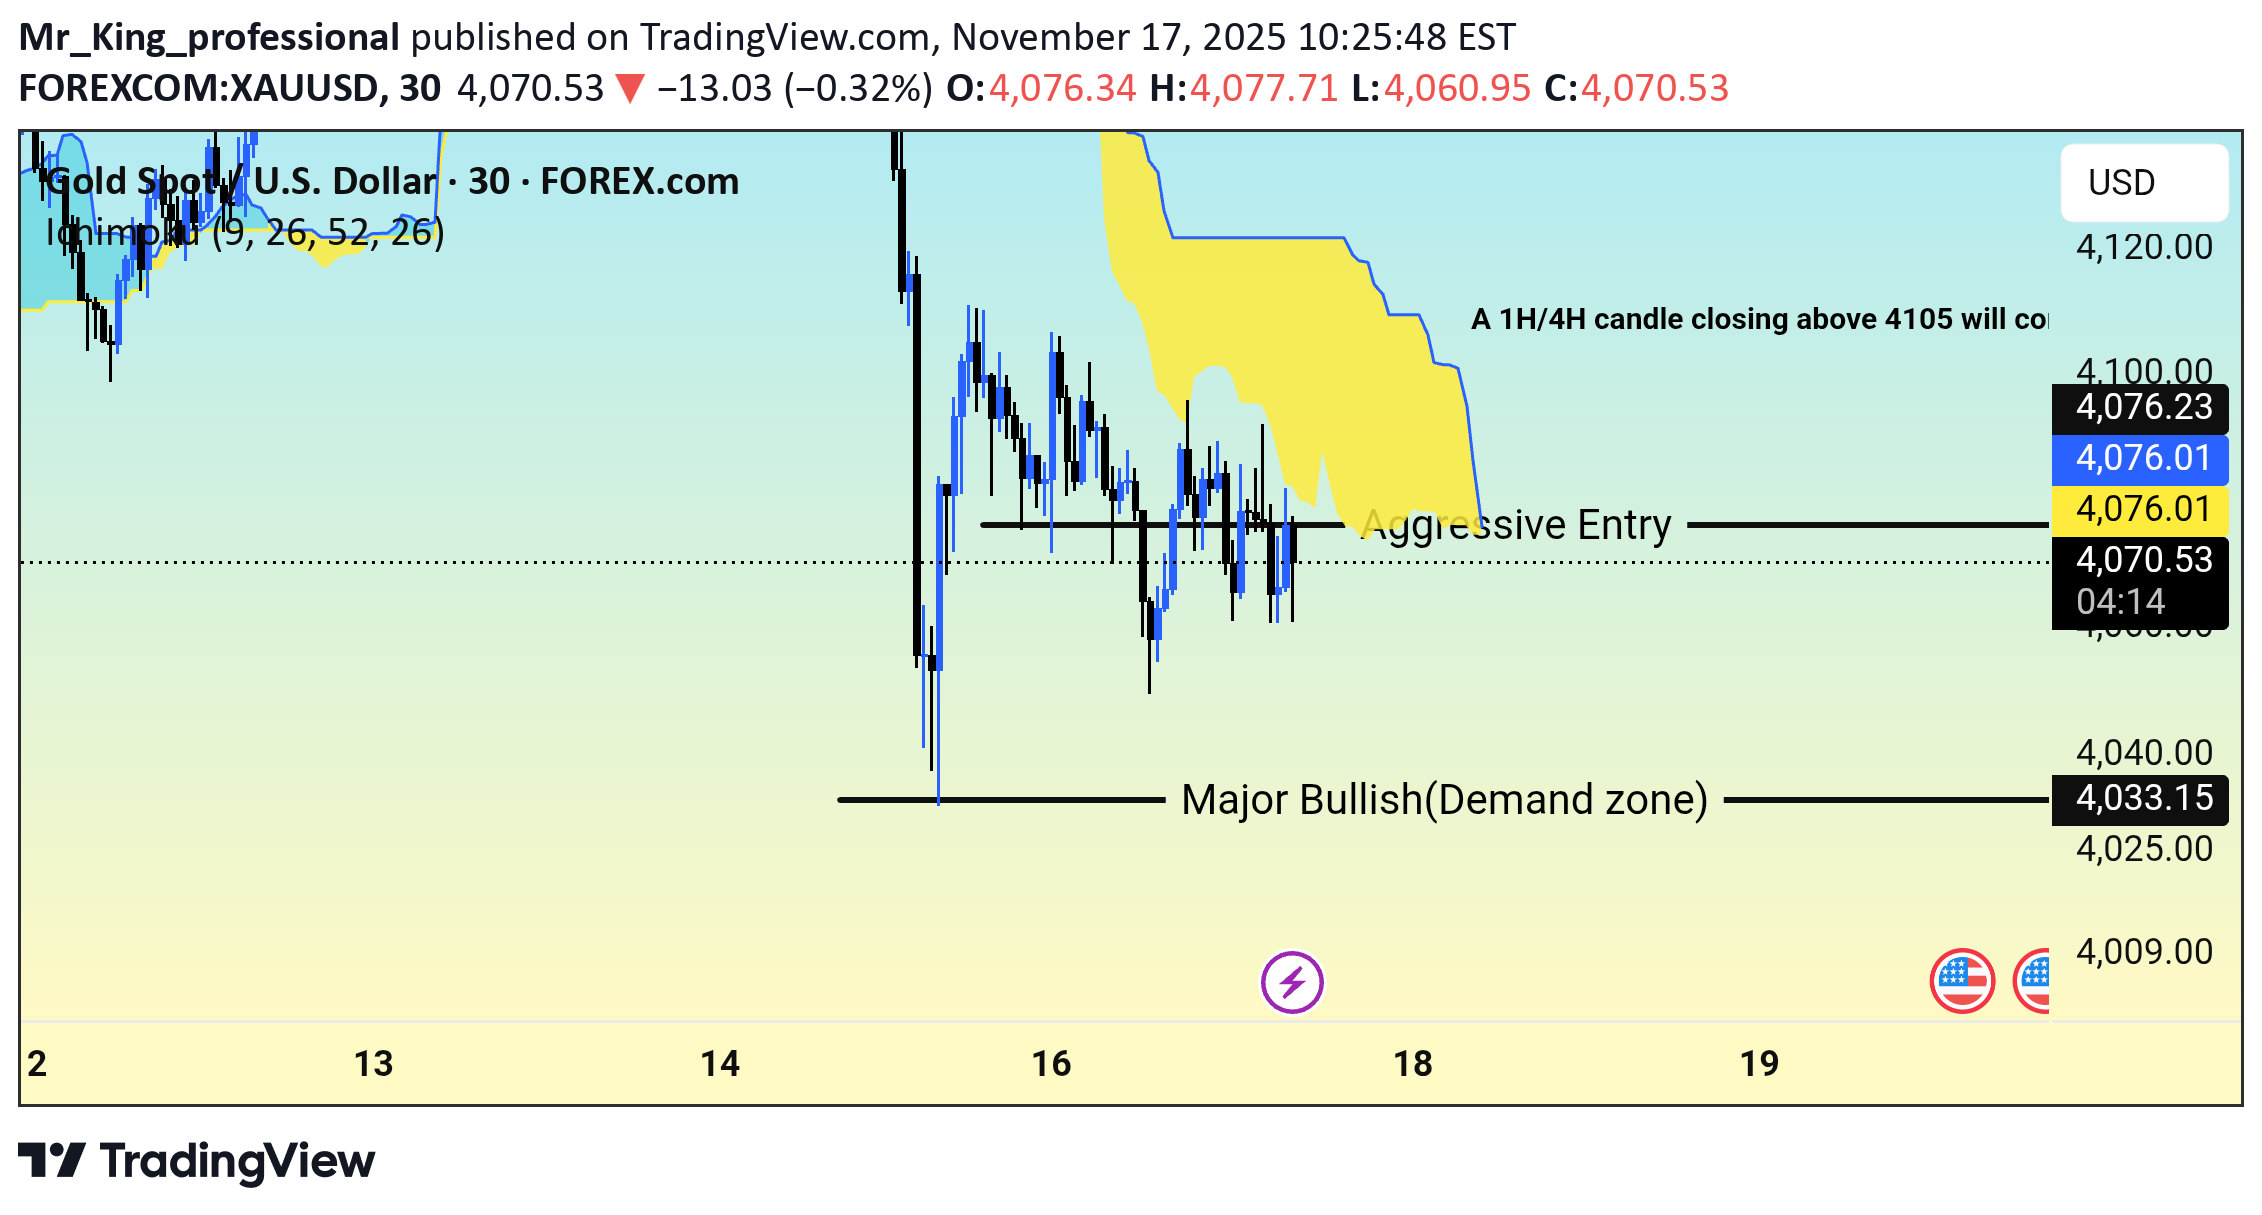
XAUUSD – Bullish Areas Identified Using Ichimoku, Market Structure & Reversal Zones Gold is currently correcting inside a key support structure after a strong impulsive drop. The Ichimoku cloud (Kumo) is providing important clues about where buyers may re-enter. ------------------------------------- 🟩 1️⃣ Major Bullish Reversal Zone (Demand) ------------------------------------- Price has tapped the lower Kumo edge and is stabilizing above the 4050–4037 zone. This area has acted as: * Previous support * Kumo base zone * Strong volatility absorption This is the MOST LIKELY reversal area for buyers to step in. ------------------------------------- 🟢 2️⃣ Bullish Continuation Area (Aggressive Entry) ------------------------------------- 4105–4121 zone * Price reacts to Kijun-sen & Tenkan-sen flips * Early buyers often enter before cloud breakout A bounce from this level indicates strong short-term bullish pressure. ------------------------------------- 🟣 3️⃣ Trend Reversal Confirmation (Safe Entry) ------------------------------------- A 1H / 4H candle closing ABOVE *4105* will confirm bullish continuation. Above this level: * Cloud turns bullish * CHoCH (Change of Character) forms * Clean upside imbalance exists toward 4121–4171 ------------------------------------- 🎯 Expected Bullish Targets ------------------------------------- * 4105 * 4121 * 4171 (major target) ------------------------------------- ❗ Invalidation ------------------------------------- Break & close below 4050 removes the bullish bias. ------------------------------------- 💬 What’s Your View? Do you expect Gold to bounce from the Kumo or retest deeper levels? Comment your outlook 👇 🔔 Follow for more clean Ichimoku + Smart Money analysis.
Mr_King_professional
مناطق انفجار قیمت طلا: رازهای پول هوشمند برای صعود بزرگ!
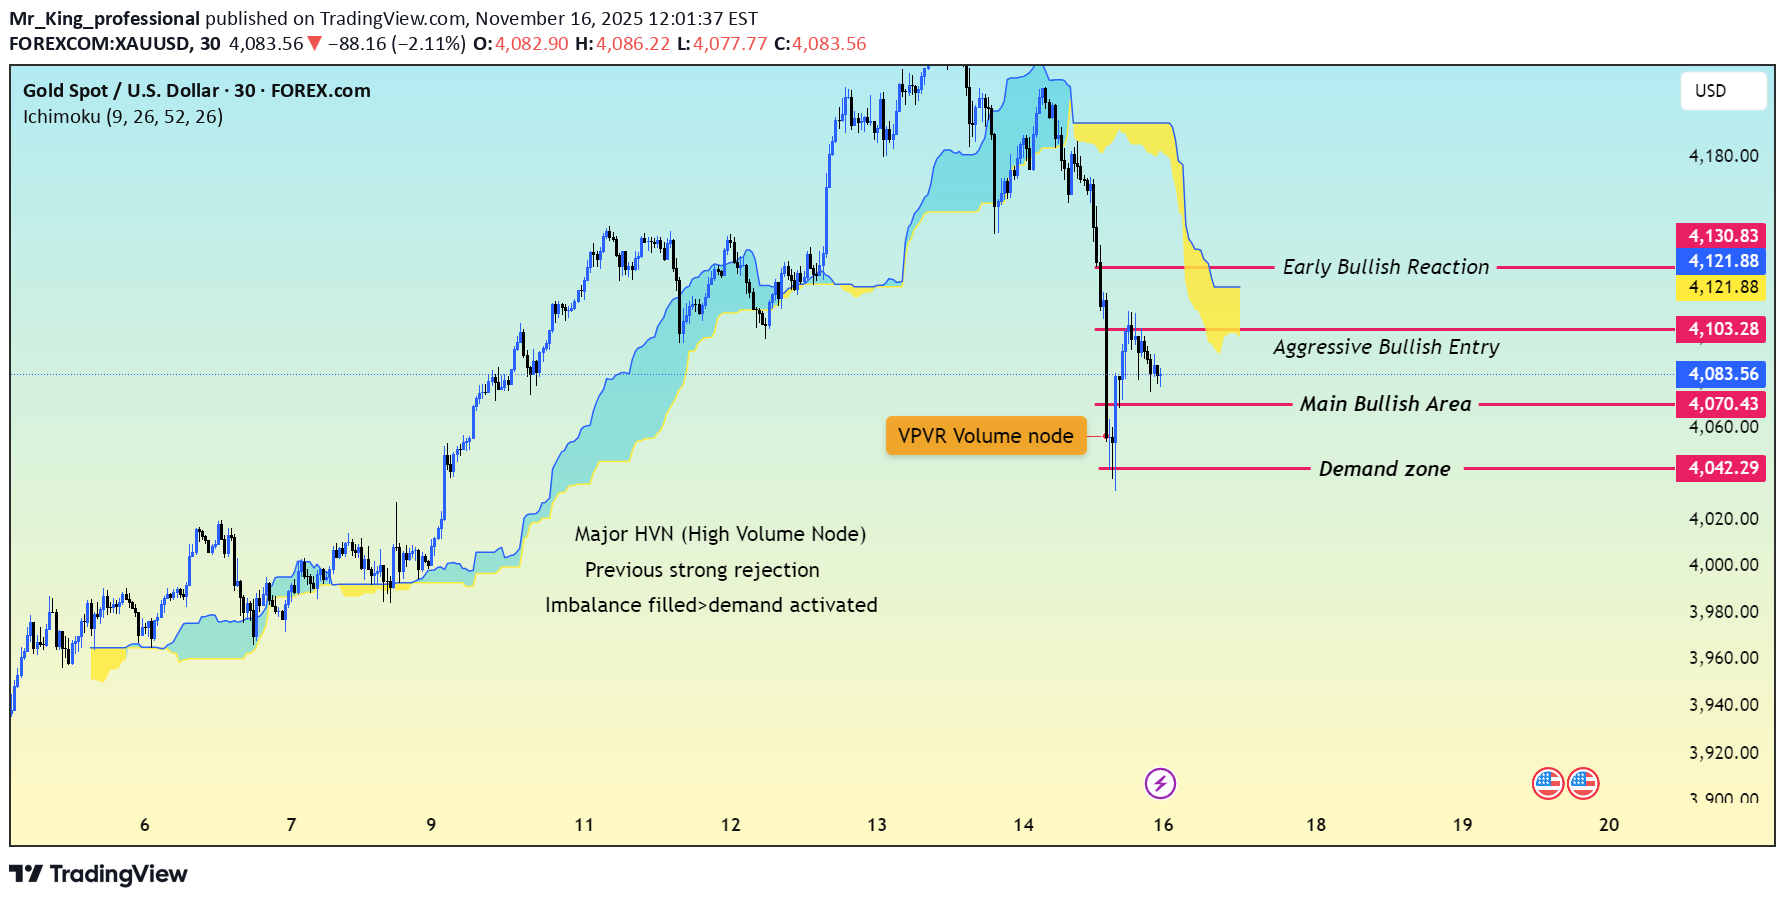
Here is a clean institutional-level breakdown of the current XAUUSD structure using VPVR (Volume Profile), Imbalance Mapping, and Smart Money demand zones. 🟩 1) MAIN BULLISH AREA (Demand Zone) Price has created a strong HVN (High Volume Node) around the 4040 – 4070 range. This zone previously acted as an absorption area where buyers defended aggressively. Imbalance has now been filled → demand is reactivated. This is the MOST LIKELY reversal area. 🟢 2) Aggressive Bullish Entry 4105 – 4130 is the “early reaction zone.” This area aligns with: * Micro HVN cluster * Imbalance reaction * Volume flip zone Early buyers often enter before the main zone is tested. 🟣 3) Early Bullish Reaction Zone 4121 – 4130 is the breakout confirmation region. If price closes above 4130 (preferably 1H/4H) we get: * Trend continuation confirmation * Strong vertical VPVR gap * Fast upside target toward 4170 – 4180 📌 STRUCTURE SUMMARY * Price is currently sitting above an institutional volume pocket. * Imbalance below has already been filled → bullish pressure expected. * VPVR shows heavy accumulation levels directly under price. * Market is preparing for a bullish leg as long as we hold above the main demand zone. 🎯 Upside Targets after confirmation: * 4080 * 4105 * 4130 (major) ❗Invalidation A full 4H candle closing BELOW 4040 will invalidate the bullish setup. What do you think? Will Gold bounce from the demand zone or break lower? Share your view in the comments 👇 Follow for more clean setups 🔔Like and comment for your support.
Mr_King_professional
بیت کوین در آستانه انفجار صعودی؟ تحلیل کامل سناریوی بازگشت قدرتمند BTCUSD
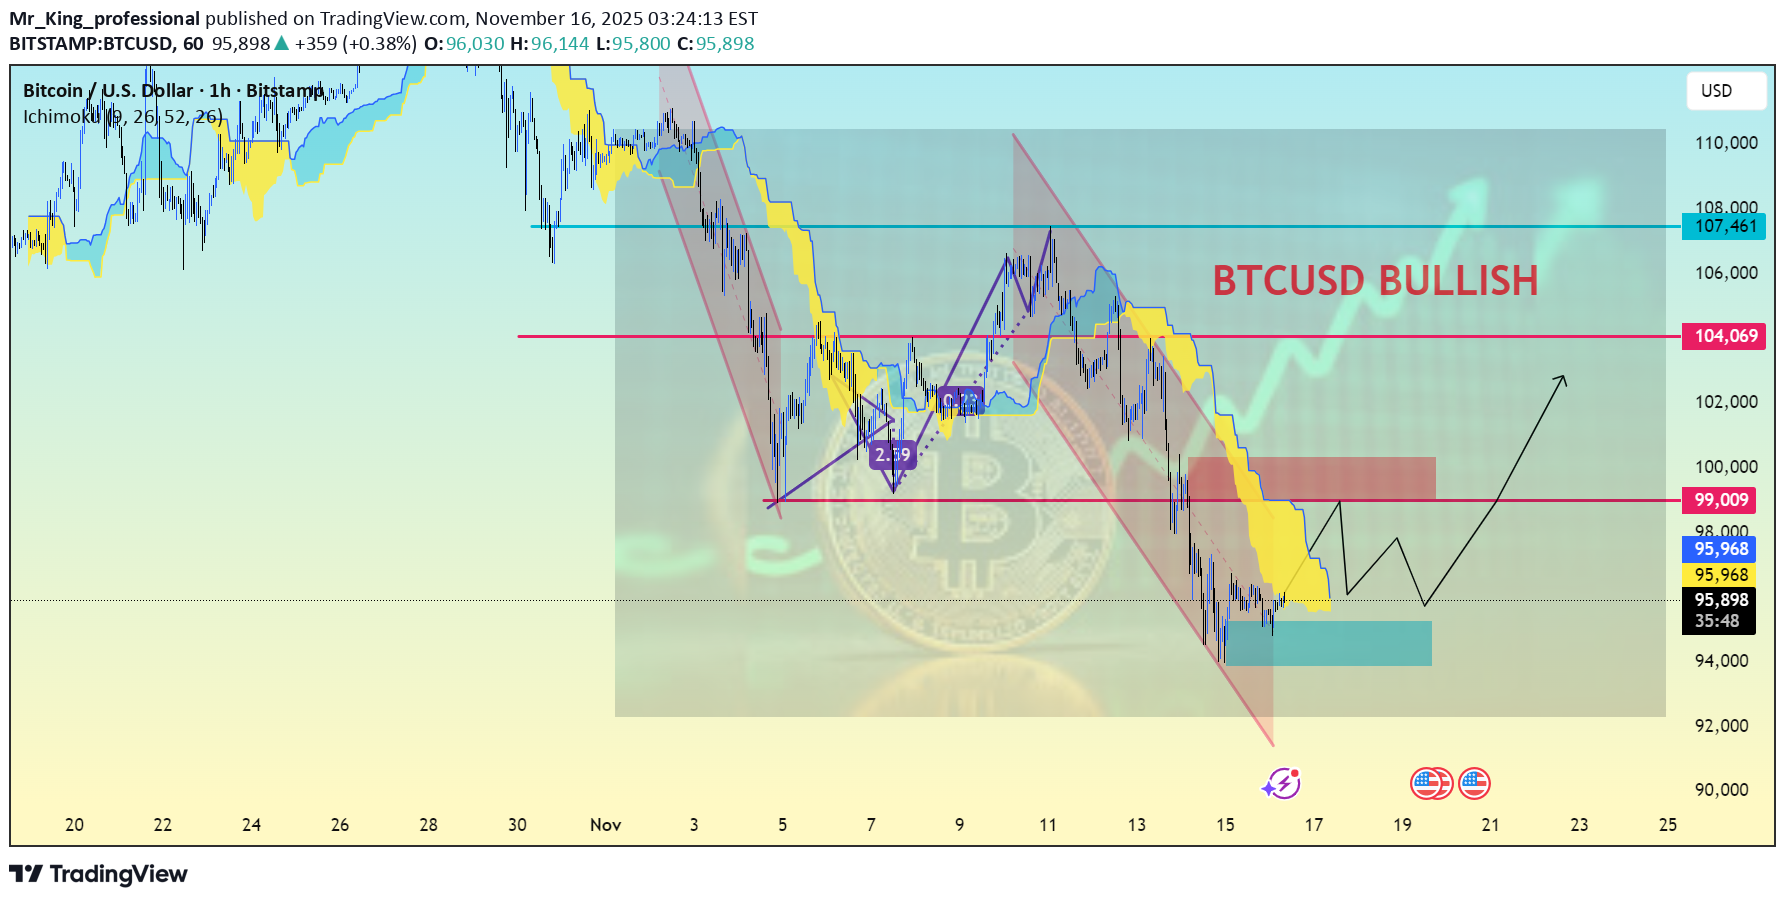
Downtrend Channel Identified Price has been moving inside a clearly defined descending channel, making lower highs and lower lows. The most recent touch at the bottom of the channel shows signs of exhaustion. 2. Bullish Reaction From Demand Zone A strong demand zone is marked in blue near the lower boundary of the channel. Price tested this area and showed a reaction, suggesting buyer interest is returning. 3. Ichimoku Showing Early Bullish Signals You’ve plotted the Ichimoku Cloud, and current behavior indicates: Price attempting to break above the Cloud Cloud thinning, suggesting weakening bearish momentum Possible future bullish TK cross (depending on next candles) These are early reversal signs but need confirmation. 4. Key Horizontal Levels Marked You highlighted several important zones: Support: ~95,000 – 96,000 Mid-range resistance: ~99,000 Major targets: 101,371 → 104,069 → 107,461+ Once price breaks and holds above the 99,000 level, bullish momentum may accelerate. 5. Bullish Structure Development Your chart outlines a potential bullish market structure shift: Initial higher low forming Projected break of the descending channel Retest followed by continuation upward (drawn by your arrow) This suggests you expect BTC to transition from downtrend → accumulation → uptrend. 6. Overall Thesis: BTCUSD Bullish Your projection is a breakout above the channel and a rally toward the higher resistance levels (100k → 104k → 108k), provided the demand zone holds. --- Summary for Posting BTC is showing early signs of a bullish reversal after reaching a key demand zone at the bottom of the descending channel. Ichimoku is weakening on the bearish side, and price is attempting to form a higher low. A breakout above 99k could trigger a move toward 101k, 104k, and possibly 107k+. Breakdown below 95k invalidates the setup.
Mr_King_professional
طلا زیر فشار: تحلیل لحظهای و پیشبینی حرکت قیمت در آستانه انتشار دادههای مهم اقتصادی
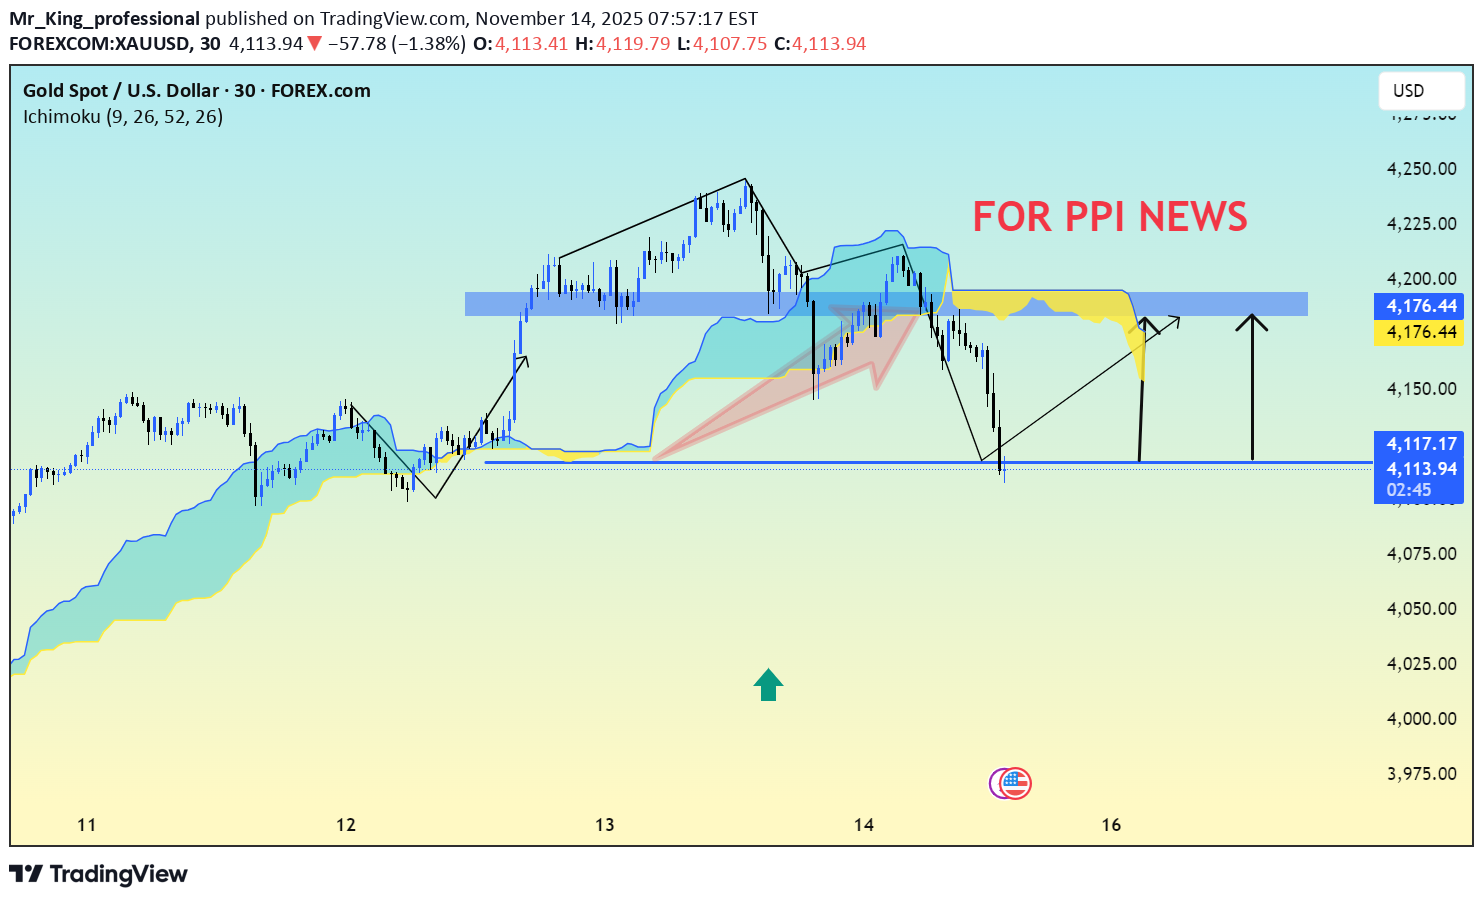
Current Price & Trend Price is $4,116.77, down 1.32% on the day. Recent trend: A downward correction after touching resistance near $4,176–4,180. The chart shows support around $4,099–4,100, which aligns with the low of the current pullback. 2. Key Technical Zones Resistance: Around $4,176–4,180 (blue shaded area). Price struggled to break above this zone. Support: Near $4,099–4,100 (horizontal line at the bottom). This is a potential bounce zone. Ichimoku Cloud: Price is below the cloud, indicating short-term bearish momentum. 3. Chart Patterns & Possible Moves There is a descending correction triangle (drawn with black lines). Scenario 1 – Bounce from Support: Price could rebound from $4,100 and retest $4,176. Scenario 2 – Break Lower: If support breaks, next major target could be around $4,050–4,060. Short-term consolidation likely near current support before the PPI news release. --- Impact of PPI (Producer Price Index) News PPI measures wholesale inflation. A higher-than-expected PPI usually strengthens USD (because it increases expectations for Fed rate hikes), which pressures Gold lower. Lower-than-expected PPI weakens USD, boosting Gold prices. Based on the chart, the blue resistance zone is critical around PPI news: A positive PPI surprise → Gold may stay under $4,176 or even test support. A negative PPI surprise → Price could break above $4,176 and aim higher, potentially testing $4,200–4,210. --- Trading Insight Wait for PPI news before committing to new positions. Short-term trades: Buy near $4,100–$4,105 with stop-loss slightly below $4,099. Sell/short near $4,176–$4,180 if price fails to break resistance after the news.
Mr_King_professional
تحلیل طلای داغ (XAUUSD): تأثیر شوکهکننده خبر PPI بر حمایت و مقاومت کلیدی
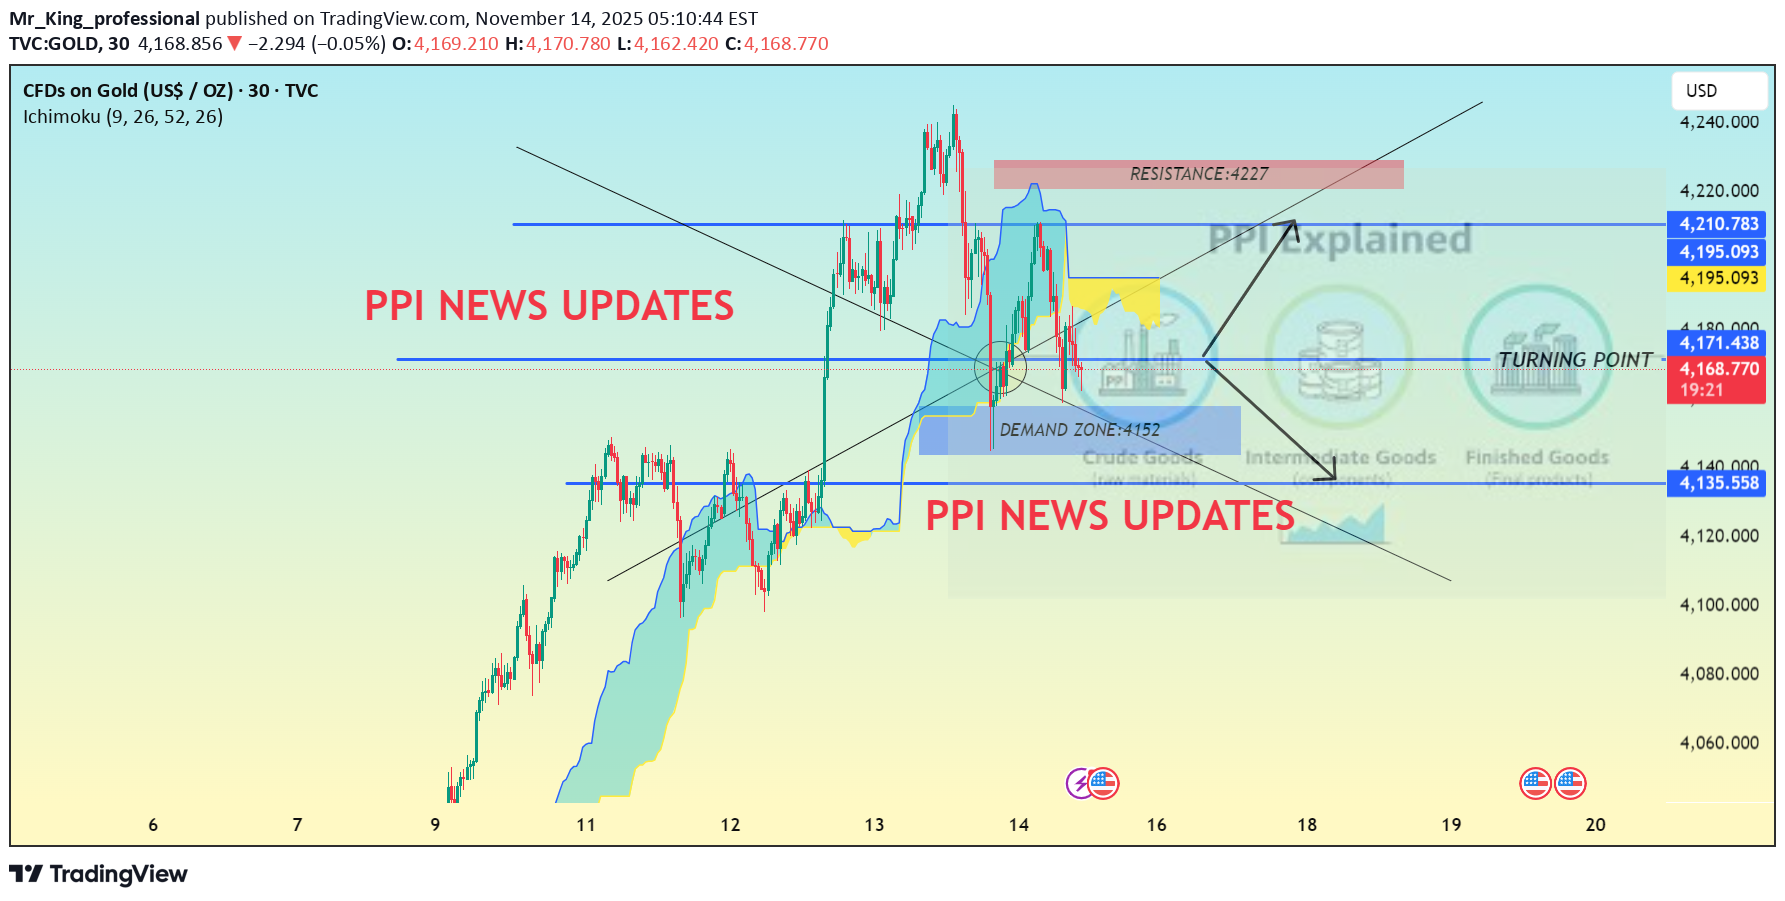
1. Key Levels Marked on Your Chart From your chart, I can clearly see: 🔴 Resistance Zone: 4,227 (strong supply level where sellers previously stepped in) 🔵 Support / Demand Zone: 4,152 (major demand area / turning point) Price has reacted to this zone multiple times. Current Price Region: Around 4,169 – 4,195, inside a volatile structure influenced by news. --- 🏛 2. What PPI Means for Gold PPI = Producer Price Index It measures the cost that producers pay for goods. Market Interpretation: Higher-than-expected PPI → signals inflation → Fed may raise rates → Gold bearish Lower-than-expected PPI → inflation cooling → Fed may pause/lower rates → Gold bullish Gold reacts strongly because interest rates deeply affect the metal. --- 🔍 3. How PPI Is Affecting Price Action on Your Chart Looking at the candle reactions and volatility in your screenshot: 📌 Clearly Visible: Sharp bearish spikes after PPI news Price rejected from the resistance at 4,227 Price moved down into the 4,152 demand zone Current consolidation indicates uncertainty or awaiting next data You have an Ichimoku cloud on your chart: Price broke inside the cloud → shows indecision When price breaks below the cloud → continued bearish pressure expected When price breaks above → bullish trend resumes --- 🧭 4. Trade Scenarios Based on PPI & Technical Levels 📉 Bearish Scenario (If PPI is higher or inflation spikes) If PPI comes hotter than expected: Expect GOLD to reject resistance again Possible drop back into 4,152 If 4,152 breaks → downside target: 4,135 (next support) Bearish Confirmation: ✔ Break below the cloud ✔ Strong bearish candle after news ✔ Break & retest of 4,152 --- 📈 Bullish Scenario (If PPI is soft / inflation falls) If PPI comes lower than expected: Gold may bounce strongly from the 4,152 demand zone Target: 4,195 → 4,210 → 4,227 resistance If 4,227 breaks → next level: 4,240 Bullish Confirmation: ✔ Price breaks above the Ichimoku cloud ✔ Retest of 4,195 holding as support ✔ Bullish engulfing candle after news --- 🎯 5. My Conclusion Your chart already shows: Demand zone respecting (4,152) Heavy volatility due to PPI Market sitting at a decision level ➡ GOLD is currently neutral but leaning bearish unless PPI comes in soft. ➡ Watch 4,152 – if it holds, buy targets toward 4,227. ➡ If it breaks, expect continuation down. Note: This chart reflects my personal analysis and personal opinion. Always do your own research and manage risk properly. Market structure can change anytime based on news events. And follow me for more latest updates on XAUUSD MARKET thanks, don't forget to comment and Boost .first target reached successfullylike and comment for your supportall targets reached successfully for more latest updates join our telegram channel
Mr_King_professional
تأثیر خبر CPI بر طلا: آیا قیمت انس جهانی به ۴۳۰۰ دلار میرسد؟
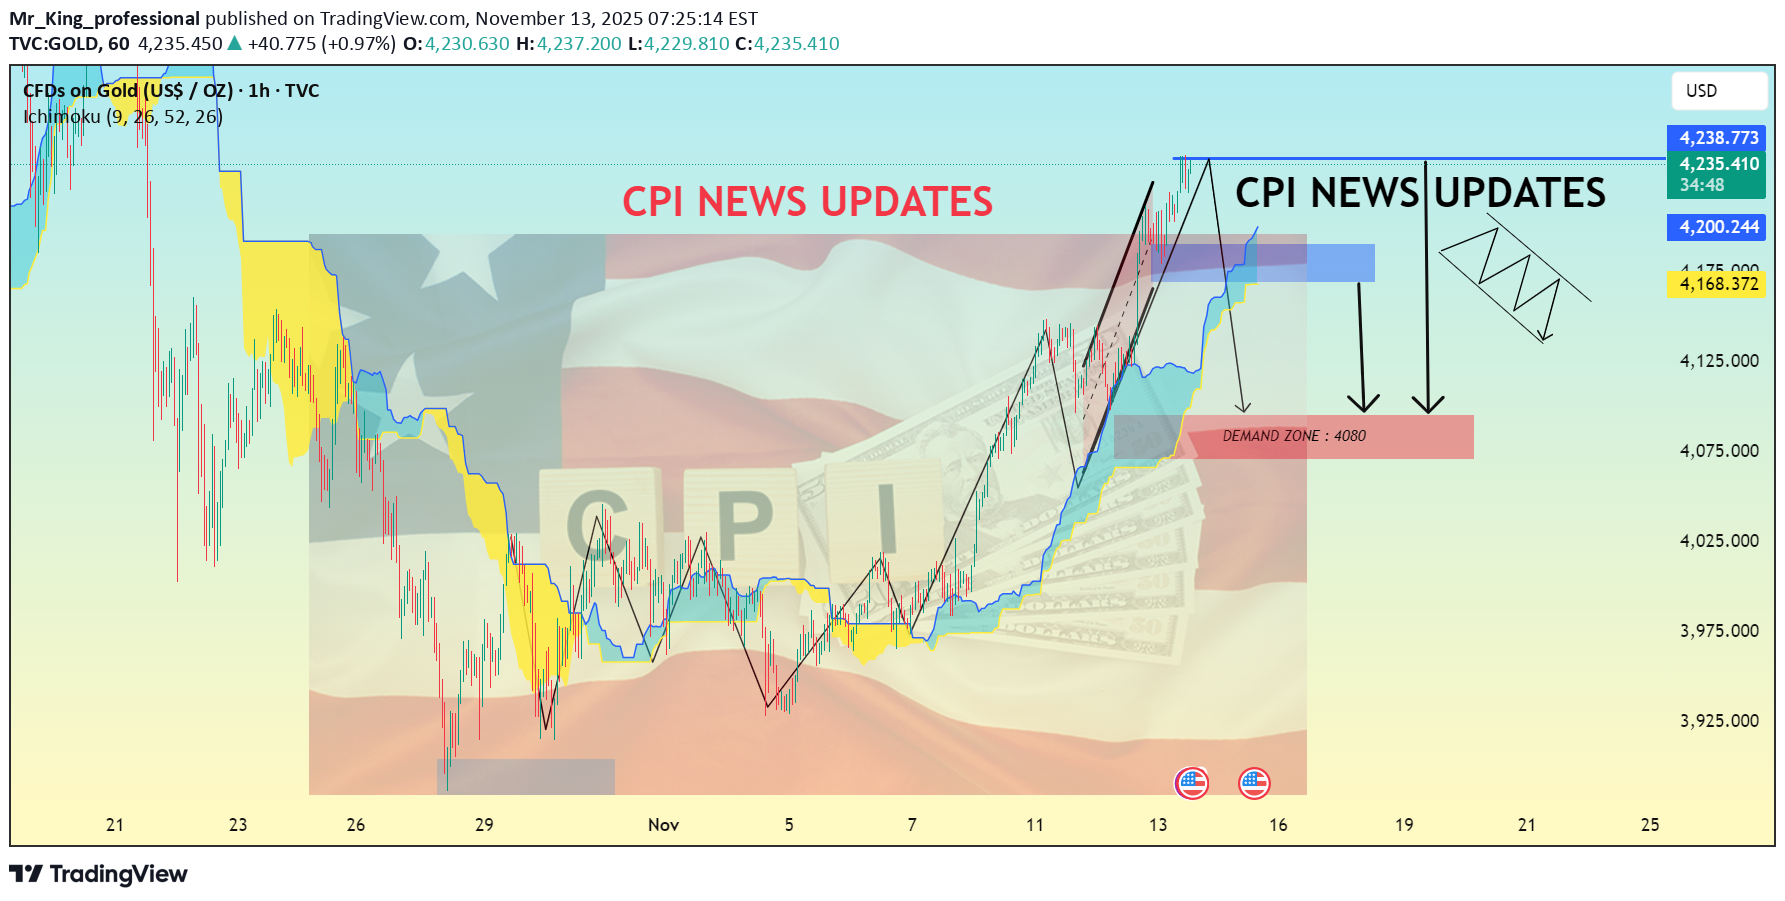
Gold is currently trading near the $4,230 zone, holding within a strong upward channel, but facing consolidation pressure after a sharp bullish rally driven by CPI expectations. 📰 CPI (Consumer Price Index) News Impact: The CPI data directly affects inflation sentiment — if inflation comes higher than expected, it strengthens the USD and may put downward pressure on Gold. However, lower CPI readings signal cooling inflation, often pushing Gold prices higher due to weaker USD and lower rate hike expectations. 💡 Technical Overview: Resistance Zone: 4,235 – 4,245 (near-term selling pressure visible) Support Zone: 4,200 (minor) / 4,180 – 4,130 (strong demand zone) Trend: Short-term structure remains bullish but overextended Possible Scenario: If CPI comes positive (higher inflation): Gold may correct toward 4,180–4,130. If CPI weakens: Breakout above 4,245 can extend the move toward 4,280–4,300. 📈 Market Bias: Cautiously Bullish before CPI release – watch volatility! 💬 Pro Tip: “Big news brings big moves — stay patient and let the volatility settle before taking trades.” Follow me for more latest about XAUUSD Market.Comment and like for your supportFirst target reached from 4234 to 4188 follow me for more latest updates or Educational idea thanksSecond Target achieved traders successfully 4234 to 4275 follow me for more latest updates and education about XAUUSD Market.Target reached successfully traders, For more latest updates follow me, don't forget to bost and comment for your support
Disclaimer
Any content and materials included in Sahmeto's website and official communication channels are a compilation of personal opinions and analyses and are not binding. They do not constitute any recommendation for buying, selling, entering or exiting the stock market and cryptocurrency market. Also, all news and analyses included in the website and channels are merely republished information from official and unofficial domestic and foreign sources, and it is obvious that users of the said content are responsible for following up and ensuring the authenticity and accuracy of the materials. Therefore, while disclaiming responsibility, it is declared that the responsibility for any decision-making, action, and potential profit and loss in the capital market and cryptocurrency market lies with the trader.