
Mohamed-Ayman11
@t_Mohamed-Ayman11

What symbols does the trader recommend buying?
Purchase History
پیام های تریدر
Filter
Overall analysis of the gold market situation!
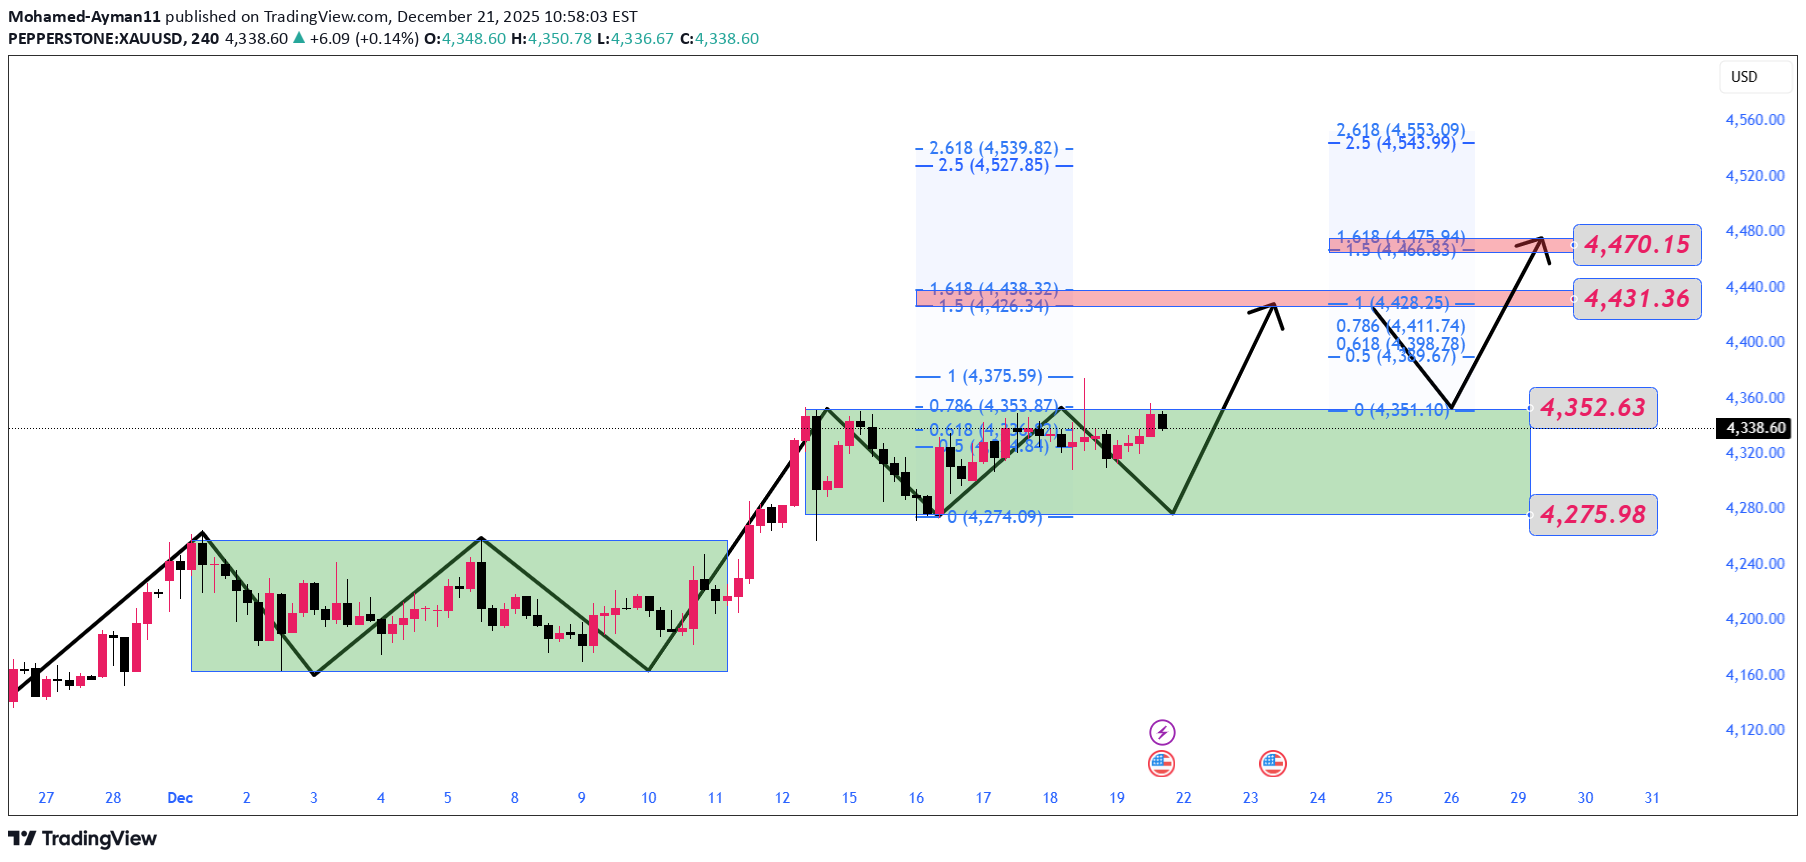
Gold is coming into the final trading week of the year with a strong bullish structure, but price is now compressing inside a wide reaction box. This is the type of environment where the market either ranges hard (holiday liquidity) or prints a clean breakout leg once liquidity is taken. 🟧 1) Market View Trend: Uptrend remains intact, but momentum is pausing. Current state: Consolidation inside a large range after an impulsive push. Key trigger: The next big move will likely come after a liquidity sweep toward the lower band or a clean acceptance above the range highs. 🟨 2) Key Levels Reaction Box (Main Range) Upper reaction: 4352.6 area Lower reaction: 4275.9 area Upside Targets / Supply 4431.3 → first expansion target 4470.1 → next extension target 🟩 3) Trading Scenarios 📉 Bearish Scenario (Range pullback / liquidity sweep) Price fails to hold the upper band near 4352 → rotates back into the range If sellers press and we get acceptance below mid-range → move toward 4275–4280 for a deeper reaction Key idea: this is still a pullback unless the lower band breaks with strong closes. 📈 Bullish Scenario (Continuation leg) Price holds above the range and prints a clean reclaim/acceptance near 4352 → opens the path toward 4431 If momentum stays strong and candles hold above supply → extension toward 4470 🟥 4) Risk & Notes Final week liquidity can create fake breaks and fast wicks. Avoid chasing mid-range candles; trade only at reaction zones or after break + retest. Confirmation > prediction: wait for candle close acceptance at the boundaries.
The gold price is in a sideways trend and is viewed pessimistica
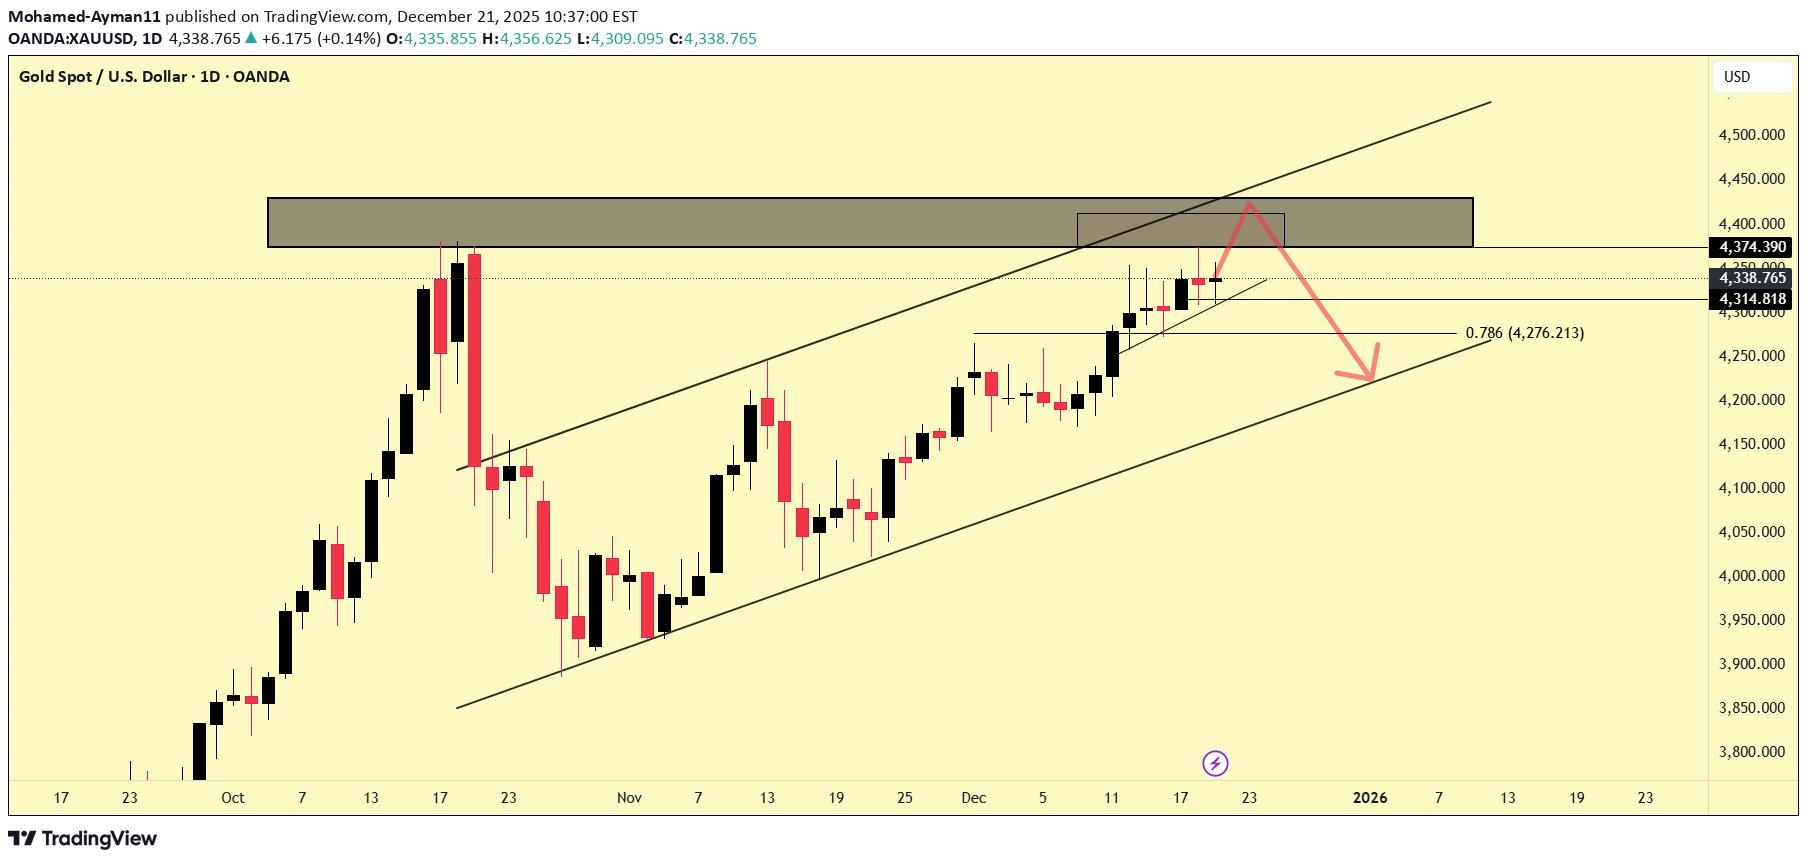
Gold is currently trading near its all-time high (ATH) and the upper boundary of a short-term ascending channel. This zone has acted as a strong resistance area, where price has been rejected multiple times in the past. As long as price remains below this resistance, a bearish reaction is expected. The base case is a pullback toward the lower boundary of the ascending channel, which serves as the minimum downside target. If price breaks above the channel top, prints a new high, and a strong candle closes above the resistance zone, the bearish scenario targeting the channel low will be invalidated. With the year-end approaching, low liquidity conditions increase the probability of fake breakouts and false moves. Extra caution and confirmation are required before taking any breakout trades.
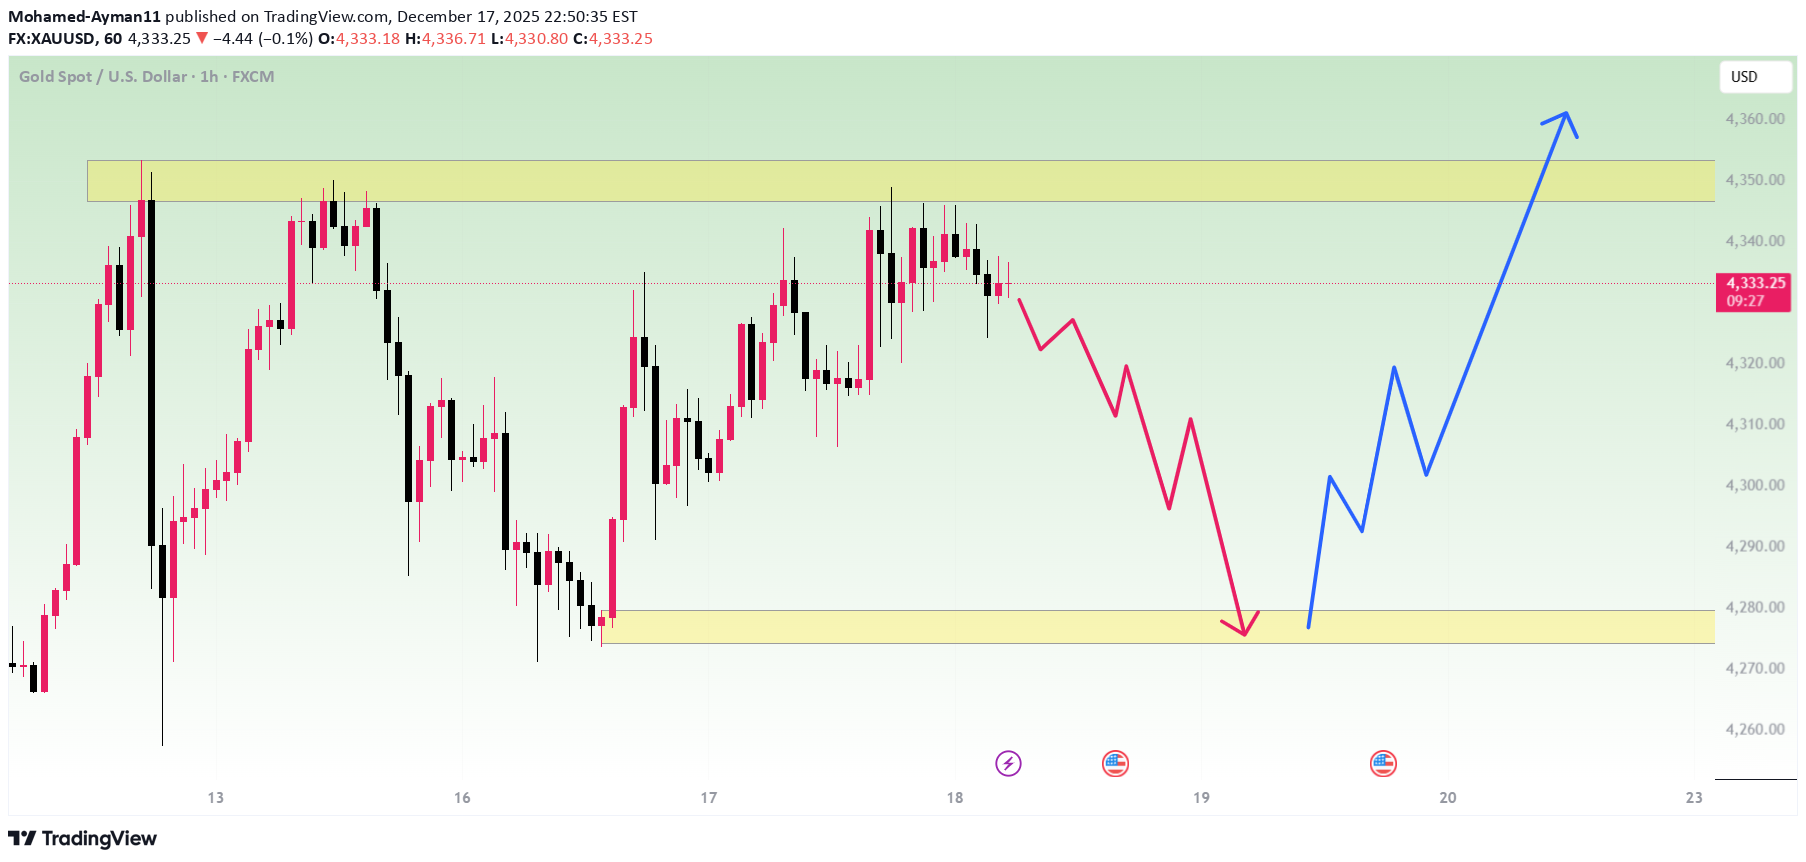
Gold trading plan!
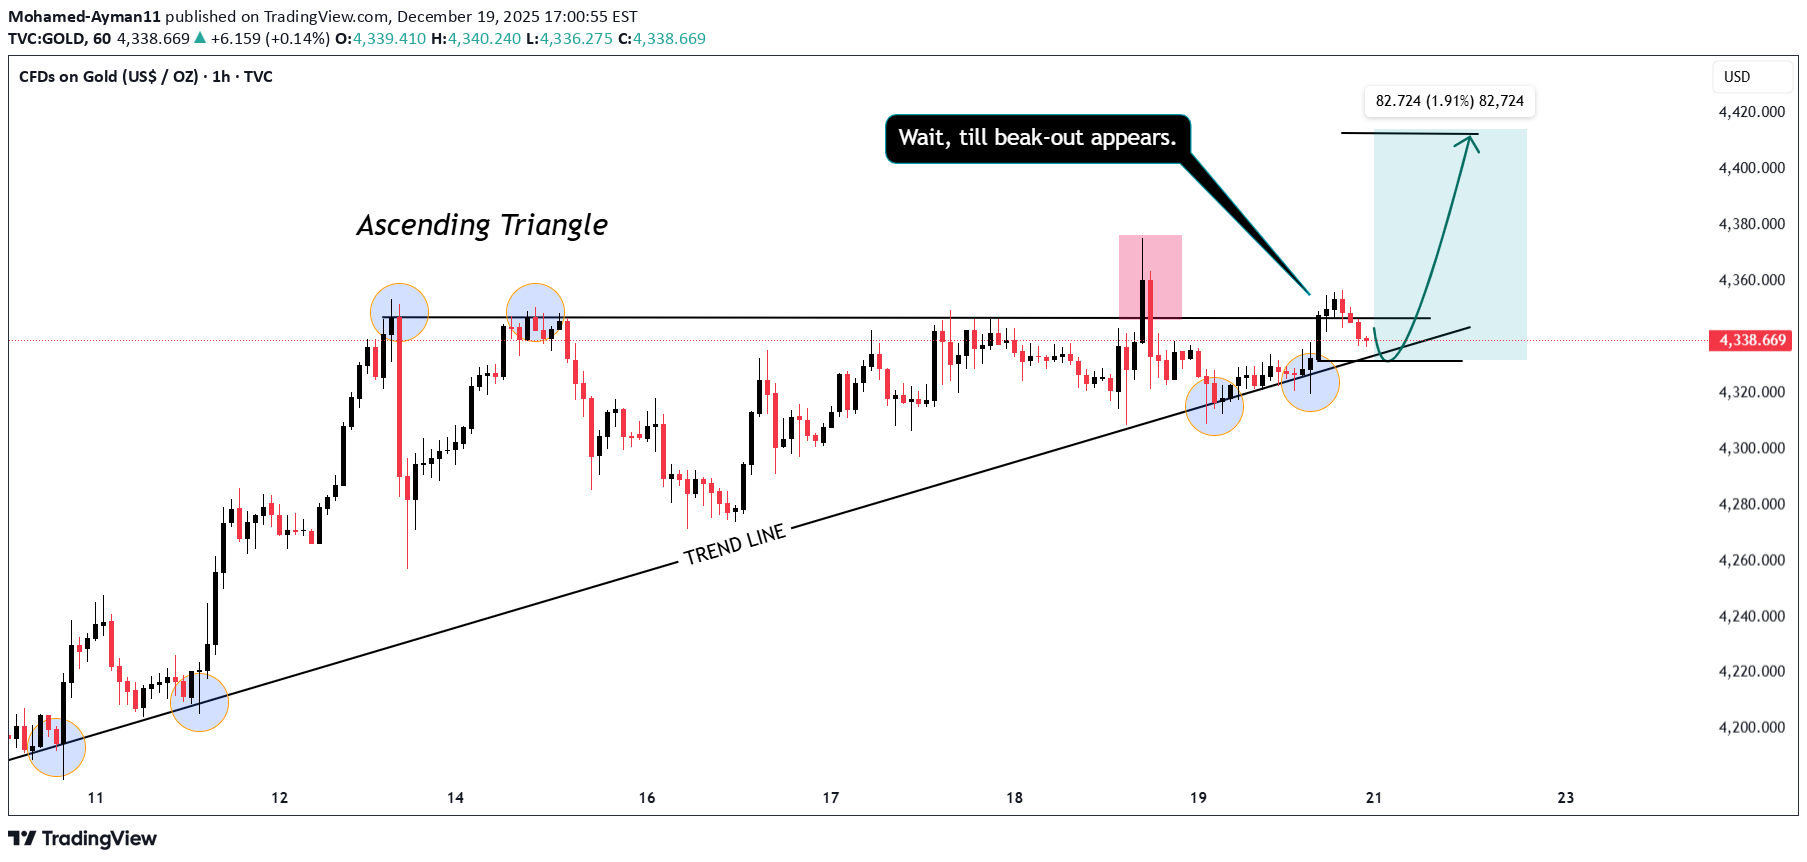
Gold is forming a clear ascending triangle on the 1H timeframe. Price is making higher lows, supported by a rising trendline, while facing a strong horizontal resistance near the upper boundary of the pattern. Multiple rejections from this resistance confirm selling pressure, but buyers continue to step in higher each time, showing bullish accumulation. Currently, price is compressing near the apex of the triangle, indicating that a breakout is likely soon. Key Points: Structure: Ascending Triangle (bullish continuation pattern) Support: Rising trendline (buyers defending higher lows) Resistance: Strong horizontal resistance zone (multiple rejections) Bias: Bullish, but confirmation needed Trading Plan: Best approach is to wait for a confirmed breakout above resistance with strong bullish candles. A clean breakout could open the way for a sharp bullish move, with upside targets based on the triangle height. If price fails to break and loses the trendline support, a pullback or deeper correction is possible. Conclusion: Patience is key. Wait for a clear breakout confirmation before entering trades. The overall structure favours bulls as long as the ascending trendline holds.The new week is about to begin and we have already formulated the trading plan for next week! If you hope to achieve at least a 300% or higher return next week, please contact me as soon as possible. If you have 2000 US dollars, your return will be at least 6000 US dollars. If my plan causes any losses for you, I will compensate for your losses! I hope we can have the opportunity to cooperate! Click to join: t.me/+Z2GF-Ws1J203MDlk
Gold Failure to Break Previous Low Keeps Bullish Case Alive
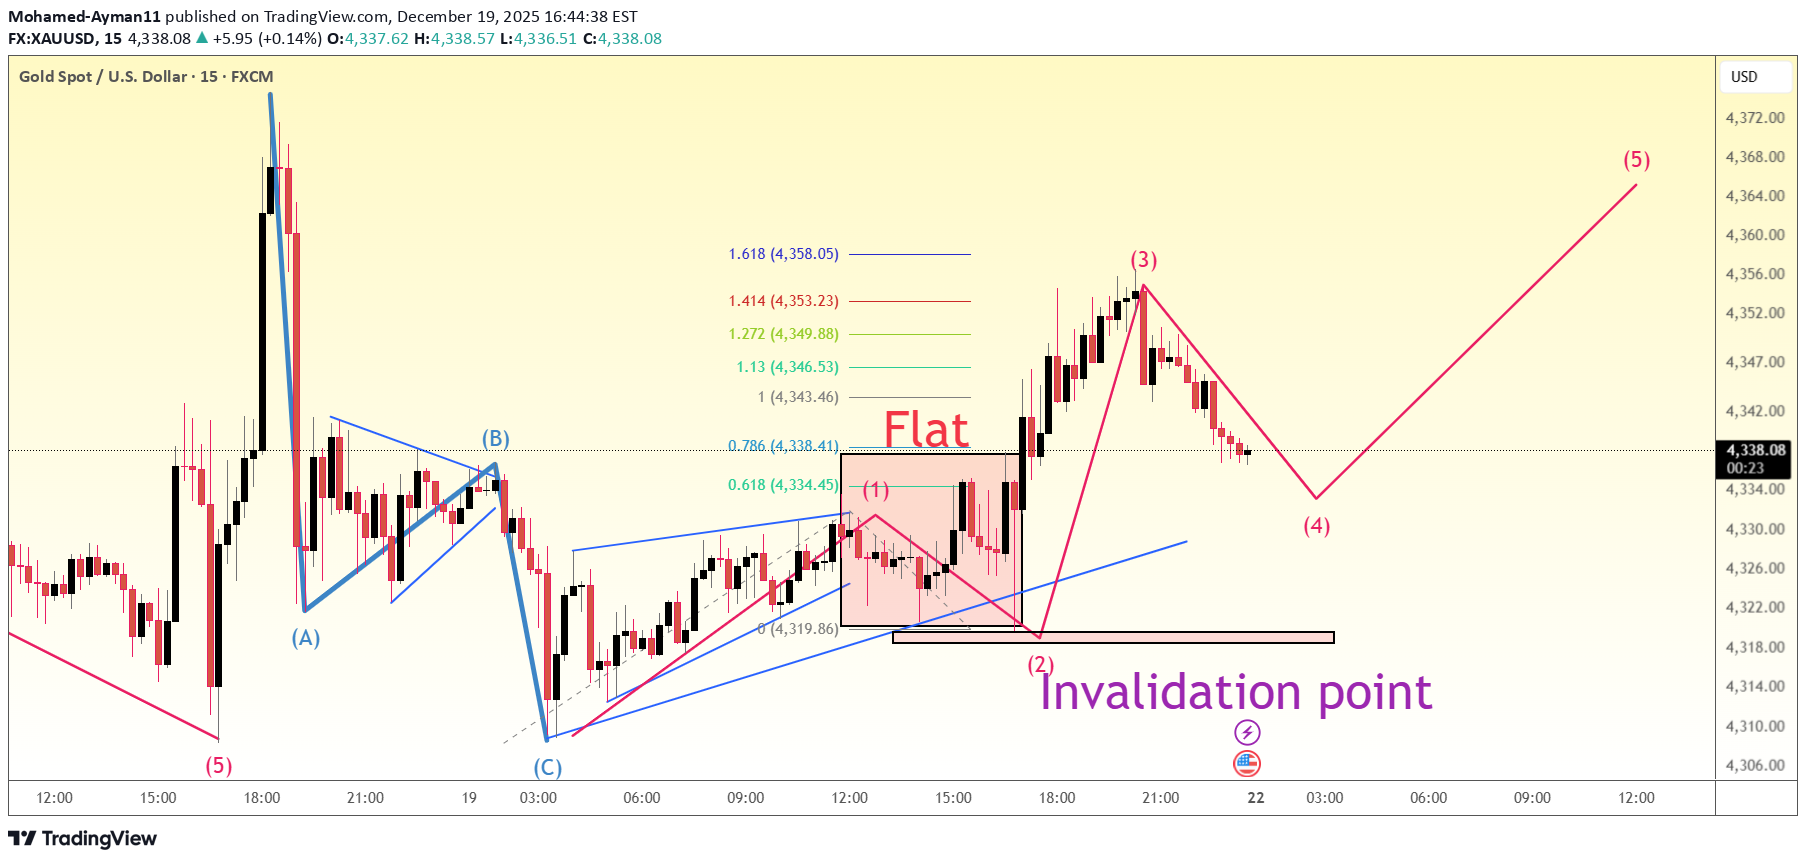
Price failed to take out the previous low, suggesting that downside momentum is weakening and that the broader bullish phase may still be intact. Instead of continuation, the market transitioned into a corrective flat, indicating absorption rather than distribution. At this stage, the focus is not on prediction but on confirmation. How price behaves after the completion of this flat will be critical: A clean impulsive move higher would support trend continuation. Further overlapping or sideways action would suggest an extended correction. Patience is key here. Structure always reveals intent — we let the market show its hand before acting.The new week is about to begin and we have already formulated the trading plan for next week! If you hope to achieve at least a 300% or higher return next week, please contact me as soon as possible. If you have 2000 US dollars, your return will be at least 6000 US dollars. If my plan causes any losses for you, I will compensate for your losses! I hope we can have the opportunity to cooperate! Click to join: t.me/+Z2GF-Ws1J203MDlk
The price of gold will continue to rise!! 4400$
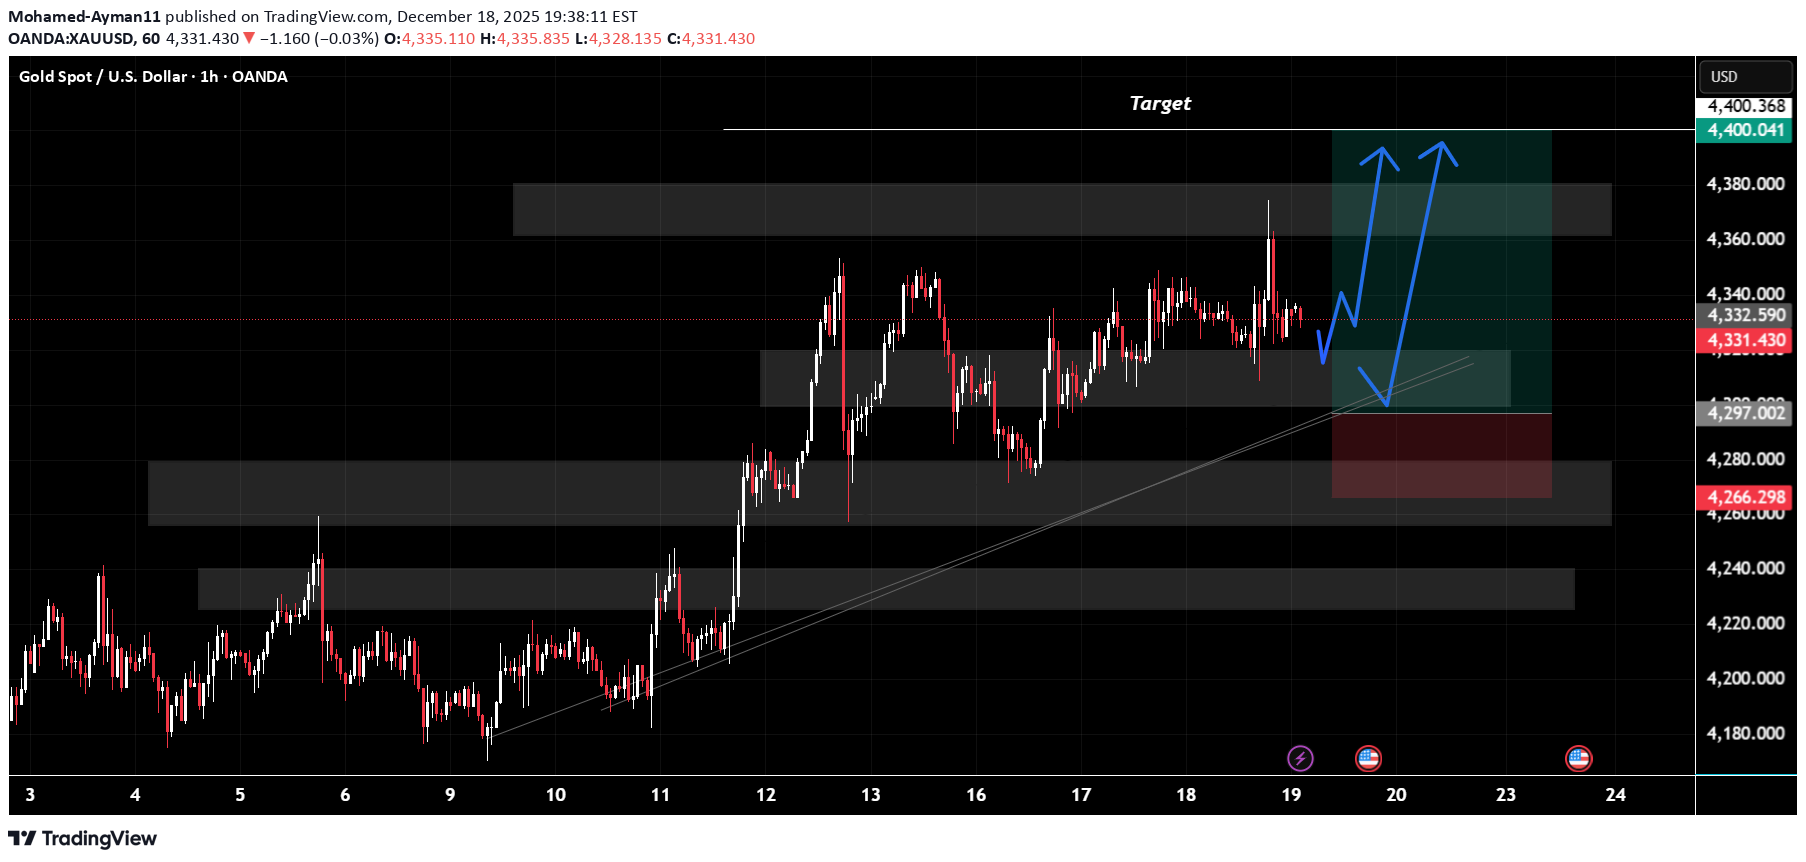
Gold is currently trading in a strong bullish structure, supported by a well-defined ascending trendline that has been respected multiple times. The overall market bias remains positive, as price continues to form higher highs and higher lows, indicating strong buying interest. Price has recently broken above a short-term consolidation zone and is now holding above the previous resistance, which has turned into support around the 4,320 – 4,300 area. This zone is acting as a key demand region, and as long as price remains above it, bullish momentum is likely to continue. The chart shows a healthy pullback and continuation pattern, suggesting that buyers are stepping in on dips rather than allowing a deeper correction. The projected price path indicates a potential bullish continuation after minor retracements, which is a sign of a strong trend. If the price holds above the rising trendline and support zone, Gold is likely to continue its move toward the 4,380 – 4,400 target area, as highlighted on the chart. A clean break and sustained hold above this resistance could open the door for further upside expansion. However, a break below 4,270 would weaken the bullish structure and may lead to a deeper correction toward lower demand zones. Conclusion Overall, Gold remains bullish in the short term, with buyers in control. The market favours buy-on-dip opportunities as long as key supports remain intact, and the upside targets remain valid until the trend structure breaks.There are very good trading opportunities in the market. If you have sufficient funds in your account, please contact me. I can offer you a high-yield trading plan with a return rate of 200% - 400%. If my plan causes any losses to you, I will compensate for your losses! Click the link below to join us: t.me/+Z2GF-Ws1J203MDlk
Gold Short-Term Trading Plan!
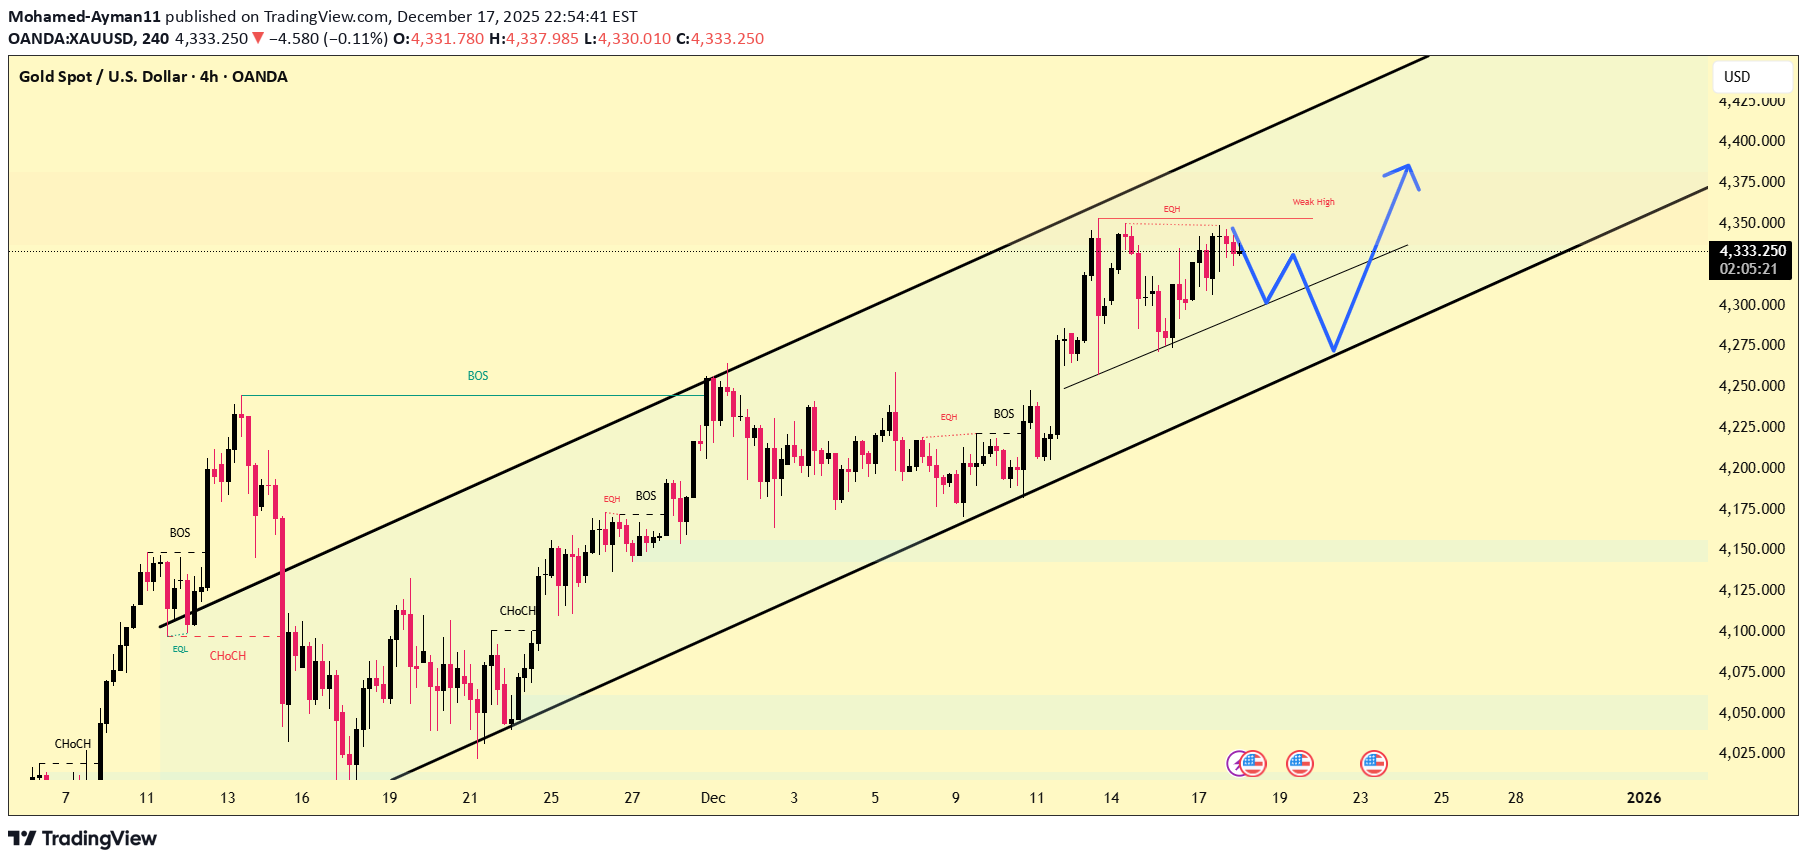
As previously anticipated, XAUUSD continues to hold a steady recovery and remains firmly above the 4,300 USD level. At the time of writing, the precious metal is trading around 4,330–4,335 USD, maintaining a bullish structure within the main ascending price channel. The U.S. dollar has softened slightly as the market continues to price in the possibility of monetary easing in the coming period. Cooling U.S. Treasury yields have further supported gold, allowing prices to stay elevated. The 4,350–4,360 zone stands as the nearest resistance (weak high), which price needs to break in order to extend the upside momentum. On the downside, 4,300–4,310 is a key short-term support area, aligning with the lower trendline of the channel. If buying pressure is strong enough to clear 4,360, the next upside targets lie around 4,390–4,400. The preferred approach remains trading in line with the prevailing trend.There are very good trading opportunities in the market. If you have sufficient funds in your account, please contact me. I can offer you a high-yield trading plan with a return rate of 200% - 400%. If my plan causes any losses to you, I will compensate for your losses! Click the link below to join us: t.me/+Z2GF-Ws1J203MDlk
What might happen in the gold market
Hi depending on S and R - this is just the market overviewThere are very good trading opportunities in the market. If you have sufficient funds in your account, please contact me. I can offer you a high-yield trading plan with a return rate of 200% - 400%. If my plan causes any losses to you, I will compensate for your losses! Click the link below to join us: t.me/+Z2GF-Ws1J203MDlk
The price of gold will rise above $5,000!
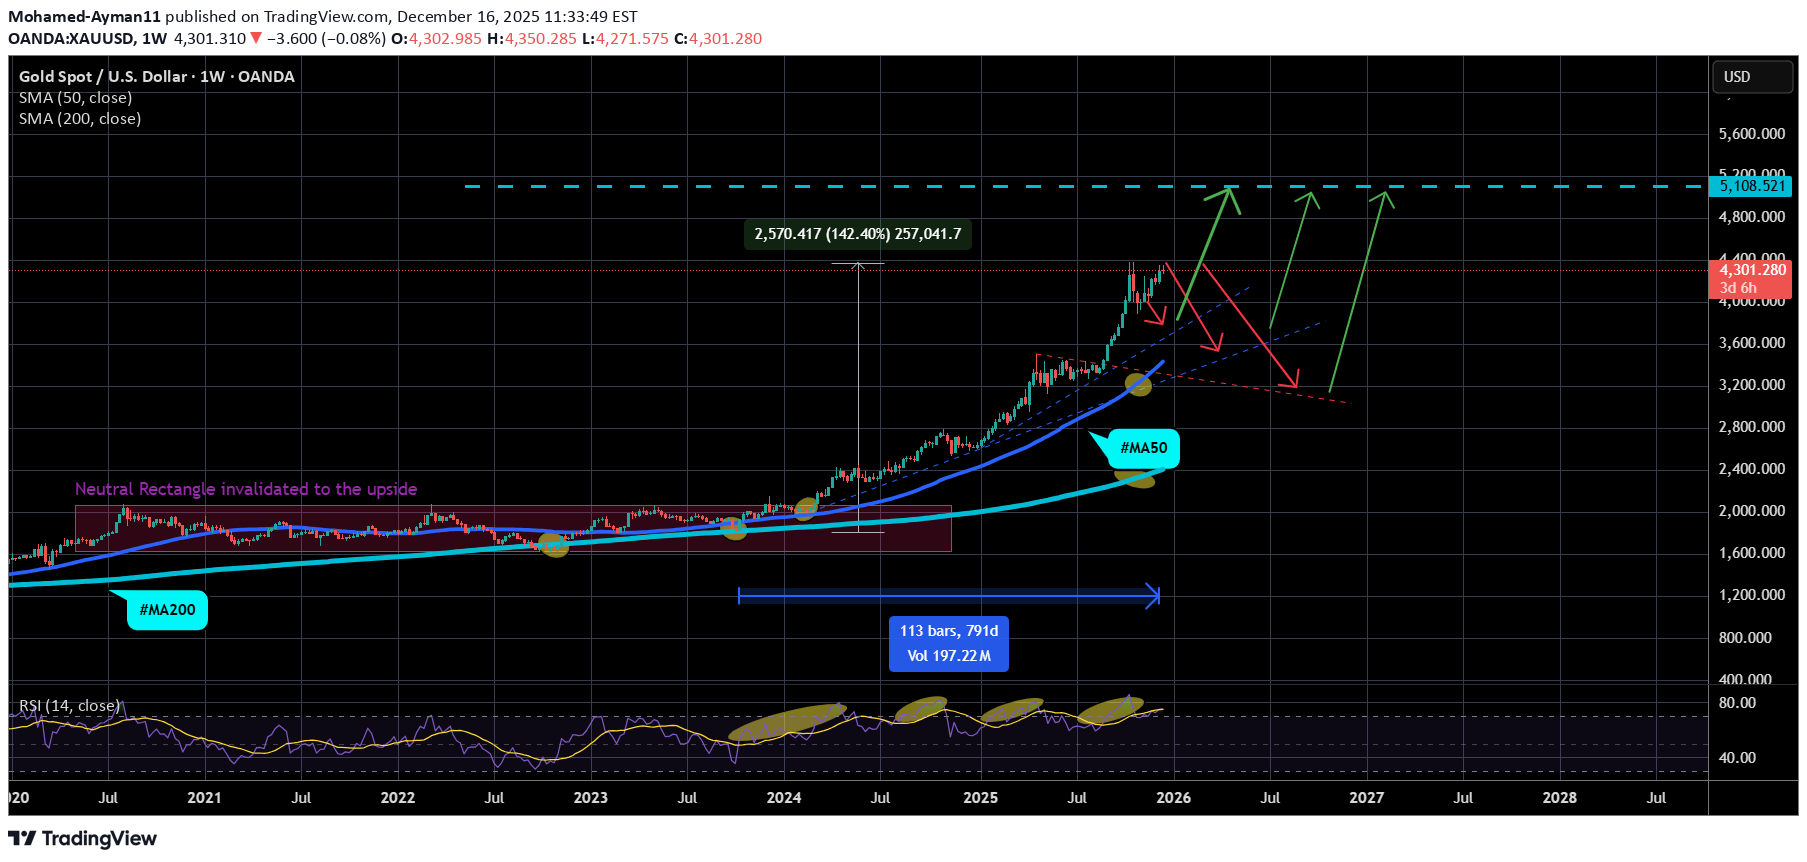
Technical analysis: The Price-action has reversed following the #4,262.80 local Low's making Hourly 4 chart an aggressive Ascending Channel which is not against my Short to Medium-term expectations. However I am still expecting on the Medium-term the Daily chart's Ascending Channel no limits towards #5,100.80 benchmark, posing as well as an retracement level which on (1W) Weekly chart will form possible Annual Ultimate High's, however Short-term Targets are intact / #4,352.80 / #4,402.80.There are very good trading opportunities in the market. If you have sufficient funds in your account, please contact me. I can offer you a high-yield trading plan with a return rate of 200% - 400%. If my plan causes any losses to you, I will compensate for your losses! Click the link below to join us: t.me/+Z2GF-Ws1J203MDlk
Gold Purchase Plan!
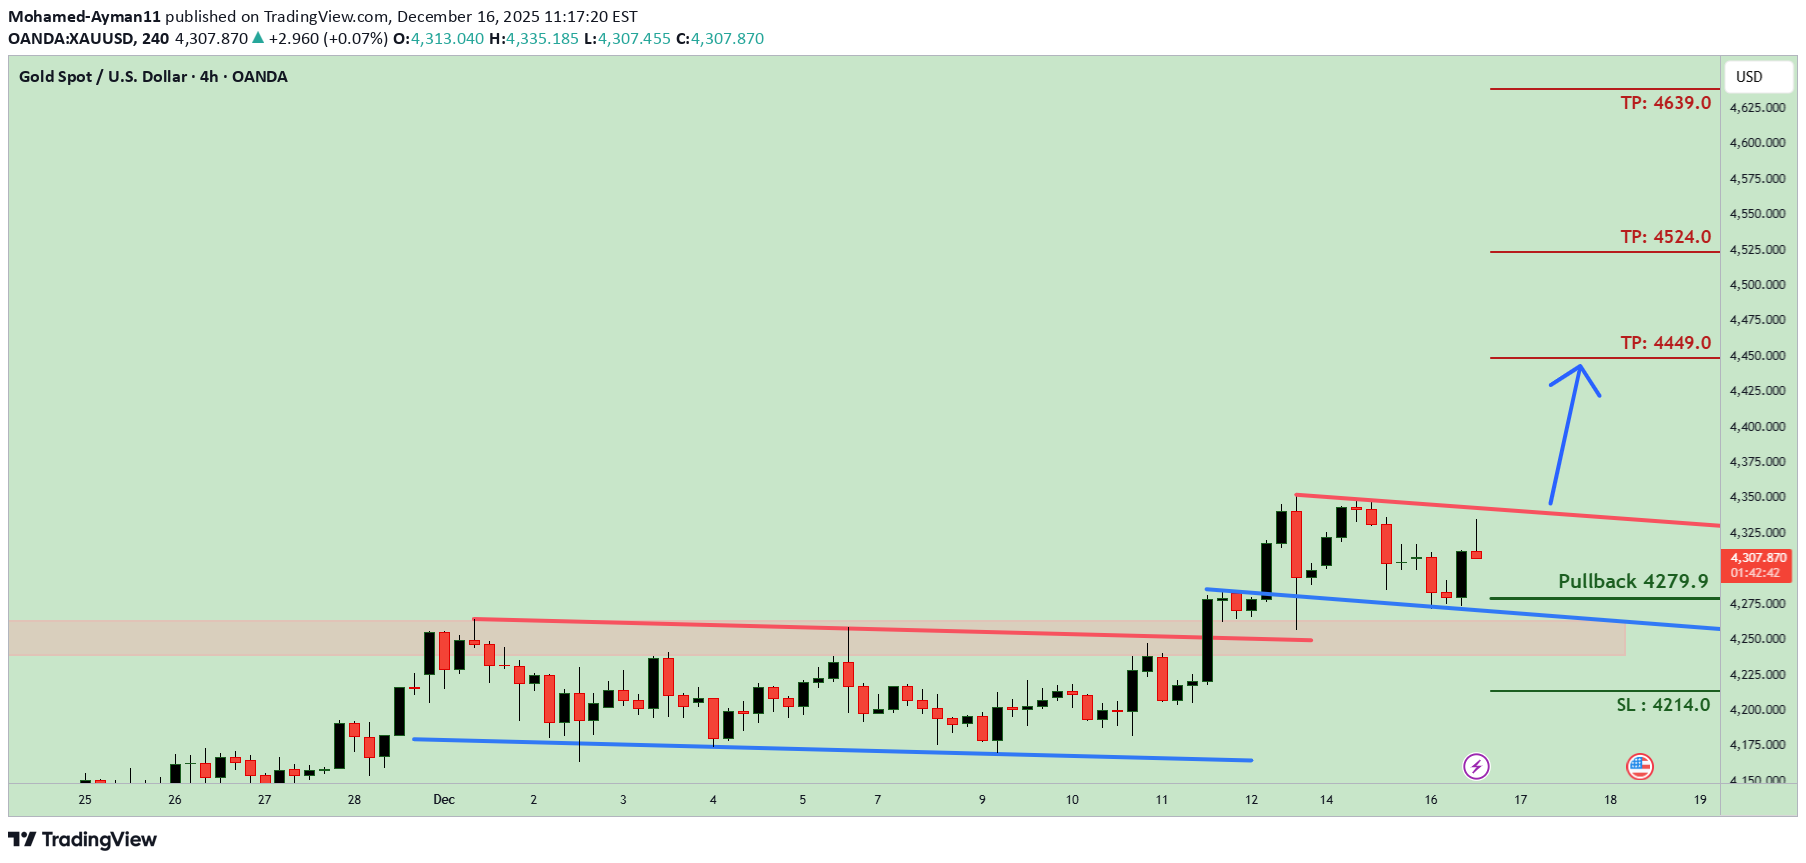
⬆️ Buy now or Buy on 4279.9 ⭕️SL @ 4214.0 🔵TP1 @ 4449.0 🔵TP2 @ 4524.0 🔵TP3 @ 4639.0 What are these signals based on? Classical Technical Analysis Price Action Candlesticks Fibonacci RSI, Moving Average , Ichimoku , Bollinger BandsThere are very good trading opportunities in the market. If you have sufficient funds in your account, please contact me. I can offer you a high-yield trading plan with a return rate of 200% - 400%. If my plan causes any losses to you, I will compensate for your losses! Click the link below to join us: t.me/+Z2GF-Ws1J203MDlk
برنامه خرید طلا: آیا قیمت به زودی به اوج جدید میرسد؟ (سطوح کلیدی خرید و فروش)
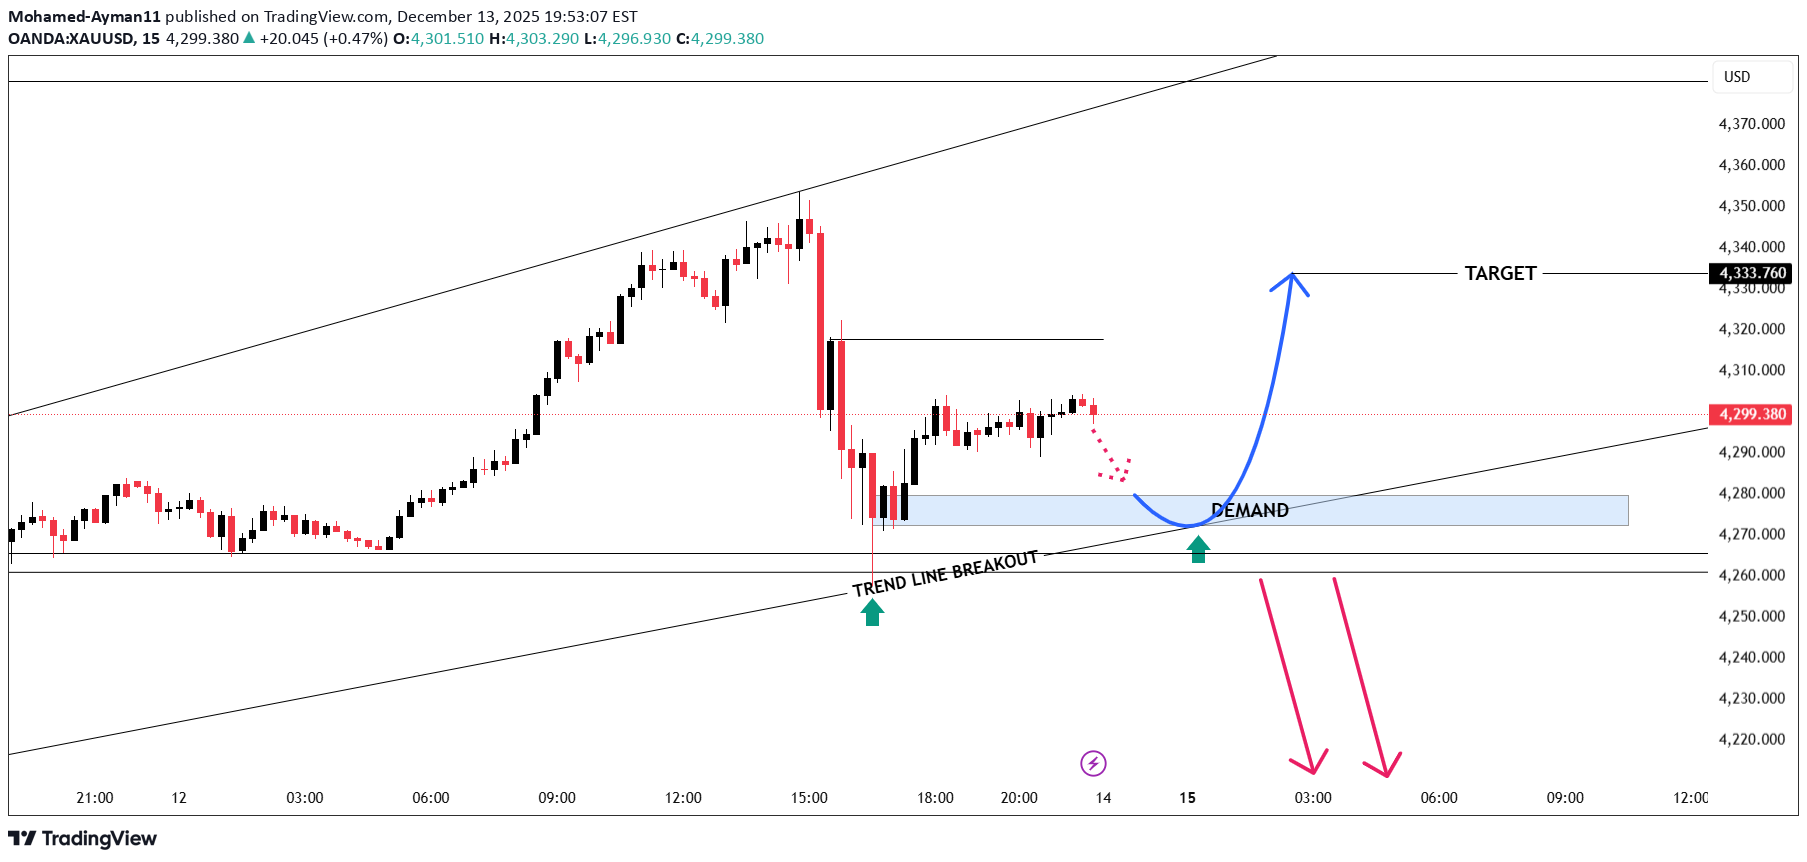
Entry Level: 4276 / 4270 Target Level: 4333 Stop Level: 4260 Bullish momentum building — price holding a strong intraday support zone, and buyers may attempt to push the market upward toward the next resistance level!There are very good trading opportunities in the market. If you have sufficient funds in your account, please contact me. I can offer you a high-yield trading plan with a return rate of 200% - 400%. If my plan causes any losses to you, I will compensate for your losses! Click the link below to join us: t.me/+Z2GF-Ws1J203MDlk
Disclaimer
Any content and materials included in Sahmeto's website and official communication channels are a compilation of personal opinions and analyses and are not binding. They do not constitute any recommendation for buying, selling, entering or exiting the stock market and cryptocurrency market. Also, all news and analyses included in the website and channels are merely republished information from official and unofficial domestic and foreign sources, and it is obvious that users of the said content are responsible for following up and ensuring the authenticity and accuracy of the materials. Therefore, while disclaiming responsibility, it is declared that the responsibility for any decision-making, action, and potential profit and loss in the capital market and cryptocurrency market lies with the trader.