
Mission_Money
@t_Mission_Money

What symbols does the trader recommend buying?
Purchase History
پیام های تریدر
Filter
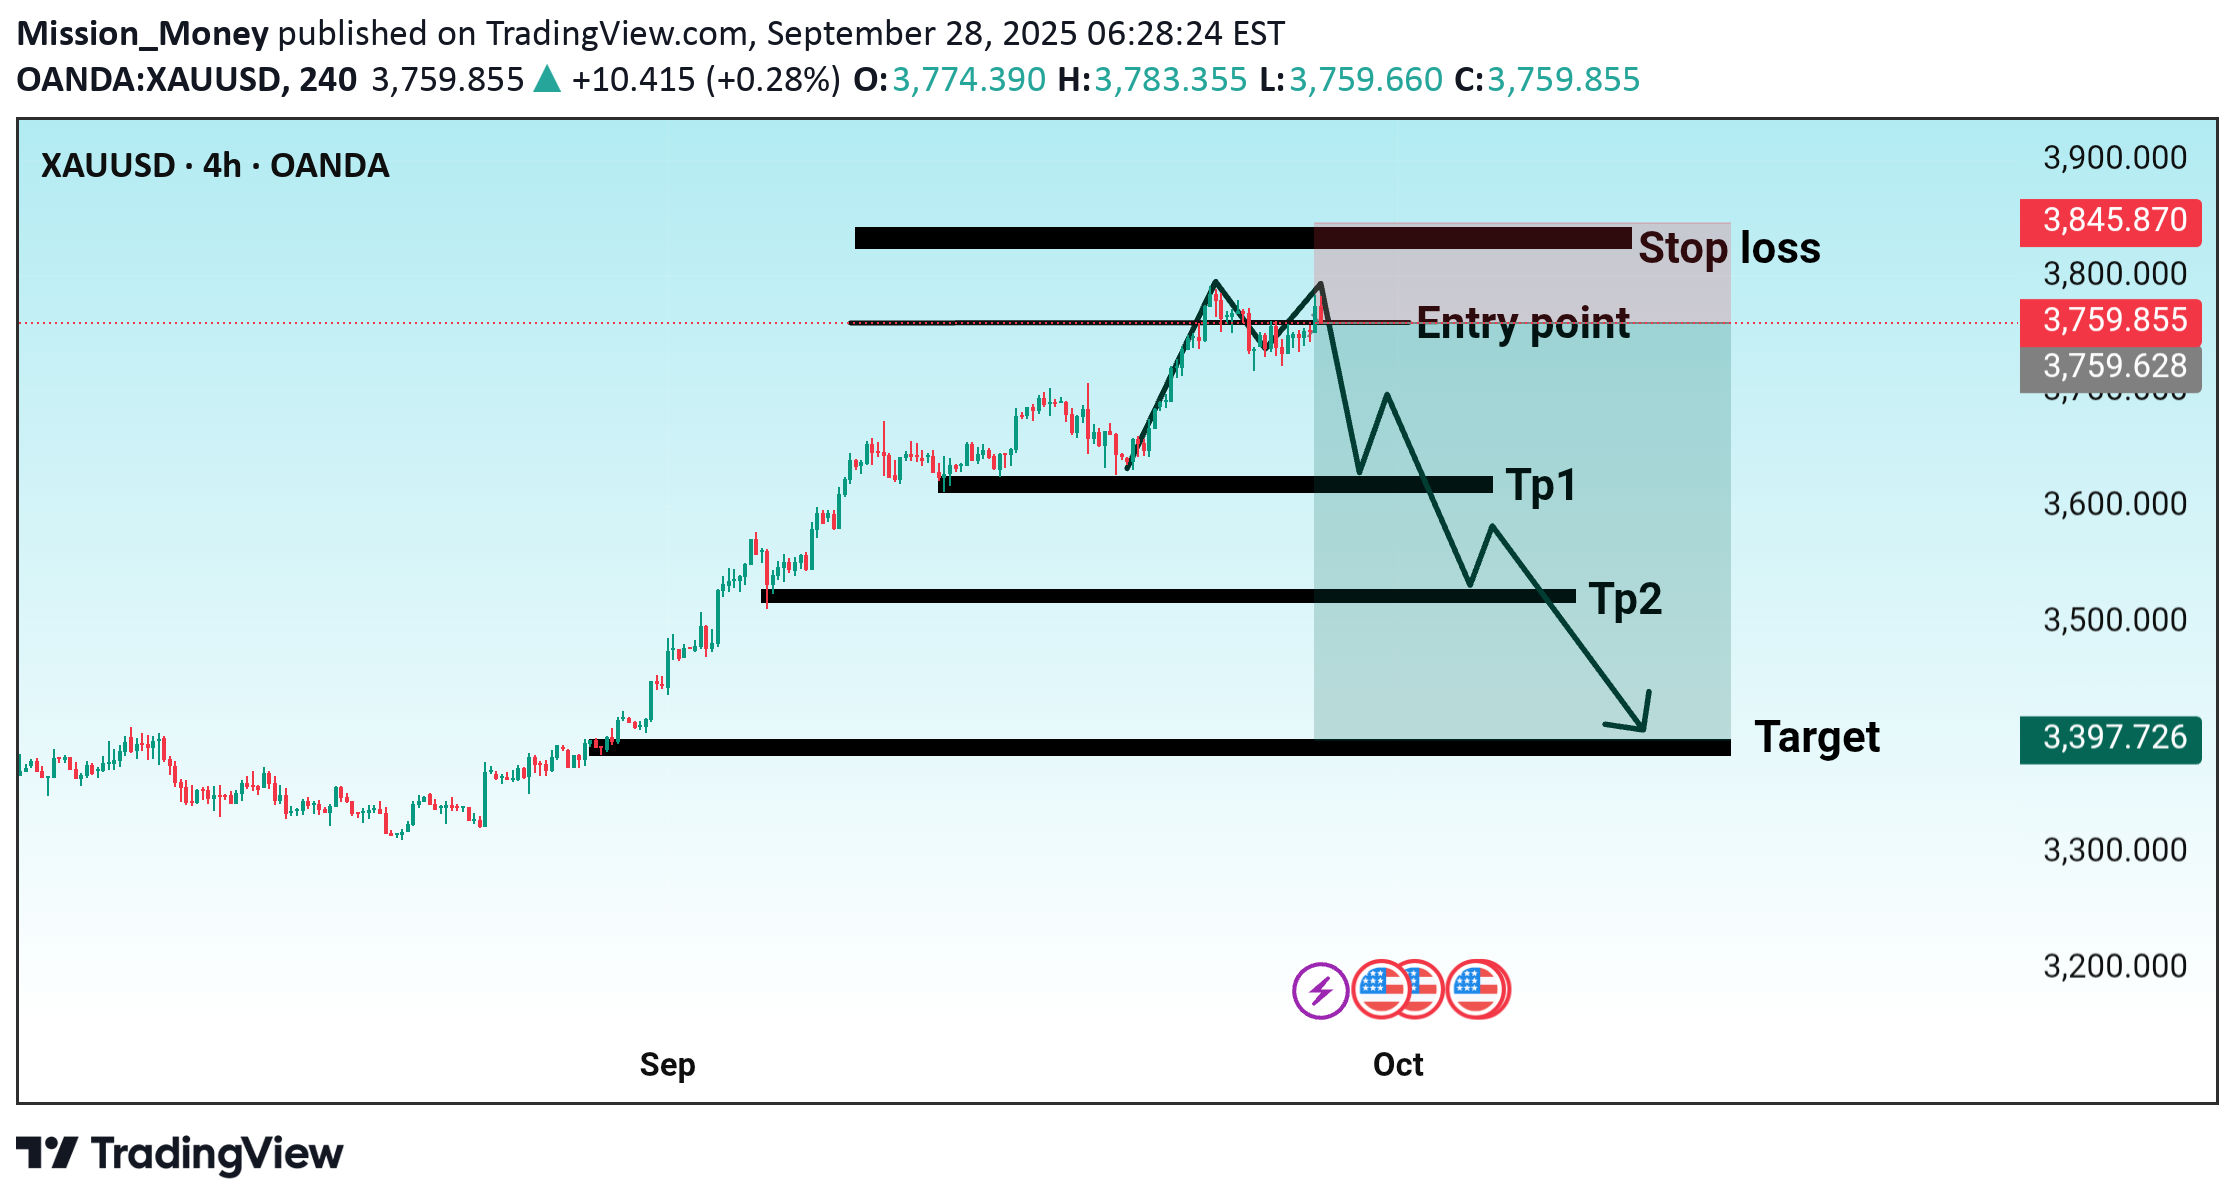
This chart is a bearish (sell) setup for XAUUSD (Gold) on the 4H timeframe. Here’s the breakdown: Entry Point: Around 3759 – 3760 (current price zone where a sell is expected) Stop Loss: 3845 – 3800 zone (above recent highs to protect against reversal) Targets: TP1 (Take Profit 1): Around 3600 TP2 (Take Profit 2): Around 3500 Final Target: 3397 Interpretation: Price has recently rallied but is now expected to reverse. The shaded zone shows a projected downward move. The strategy is short/sell from the entry point, managing risk with a stop loss above 3800–3845. Profits can be taken in stages (TP1, TP2) with a bigger drop possible towards 3397. 👉 This setup assumes gold will reject resistance and continue bearish. Do you want me to also explain why these levels (entry, stop loss, TP1, TP2) were chosen based on structure & price action?
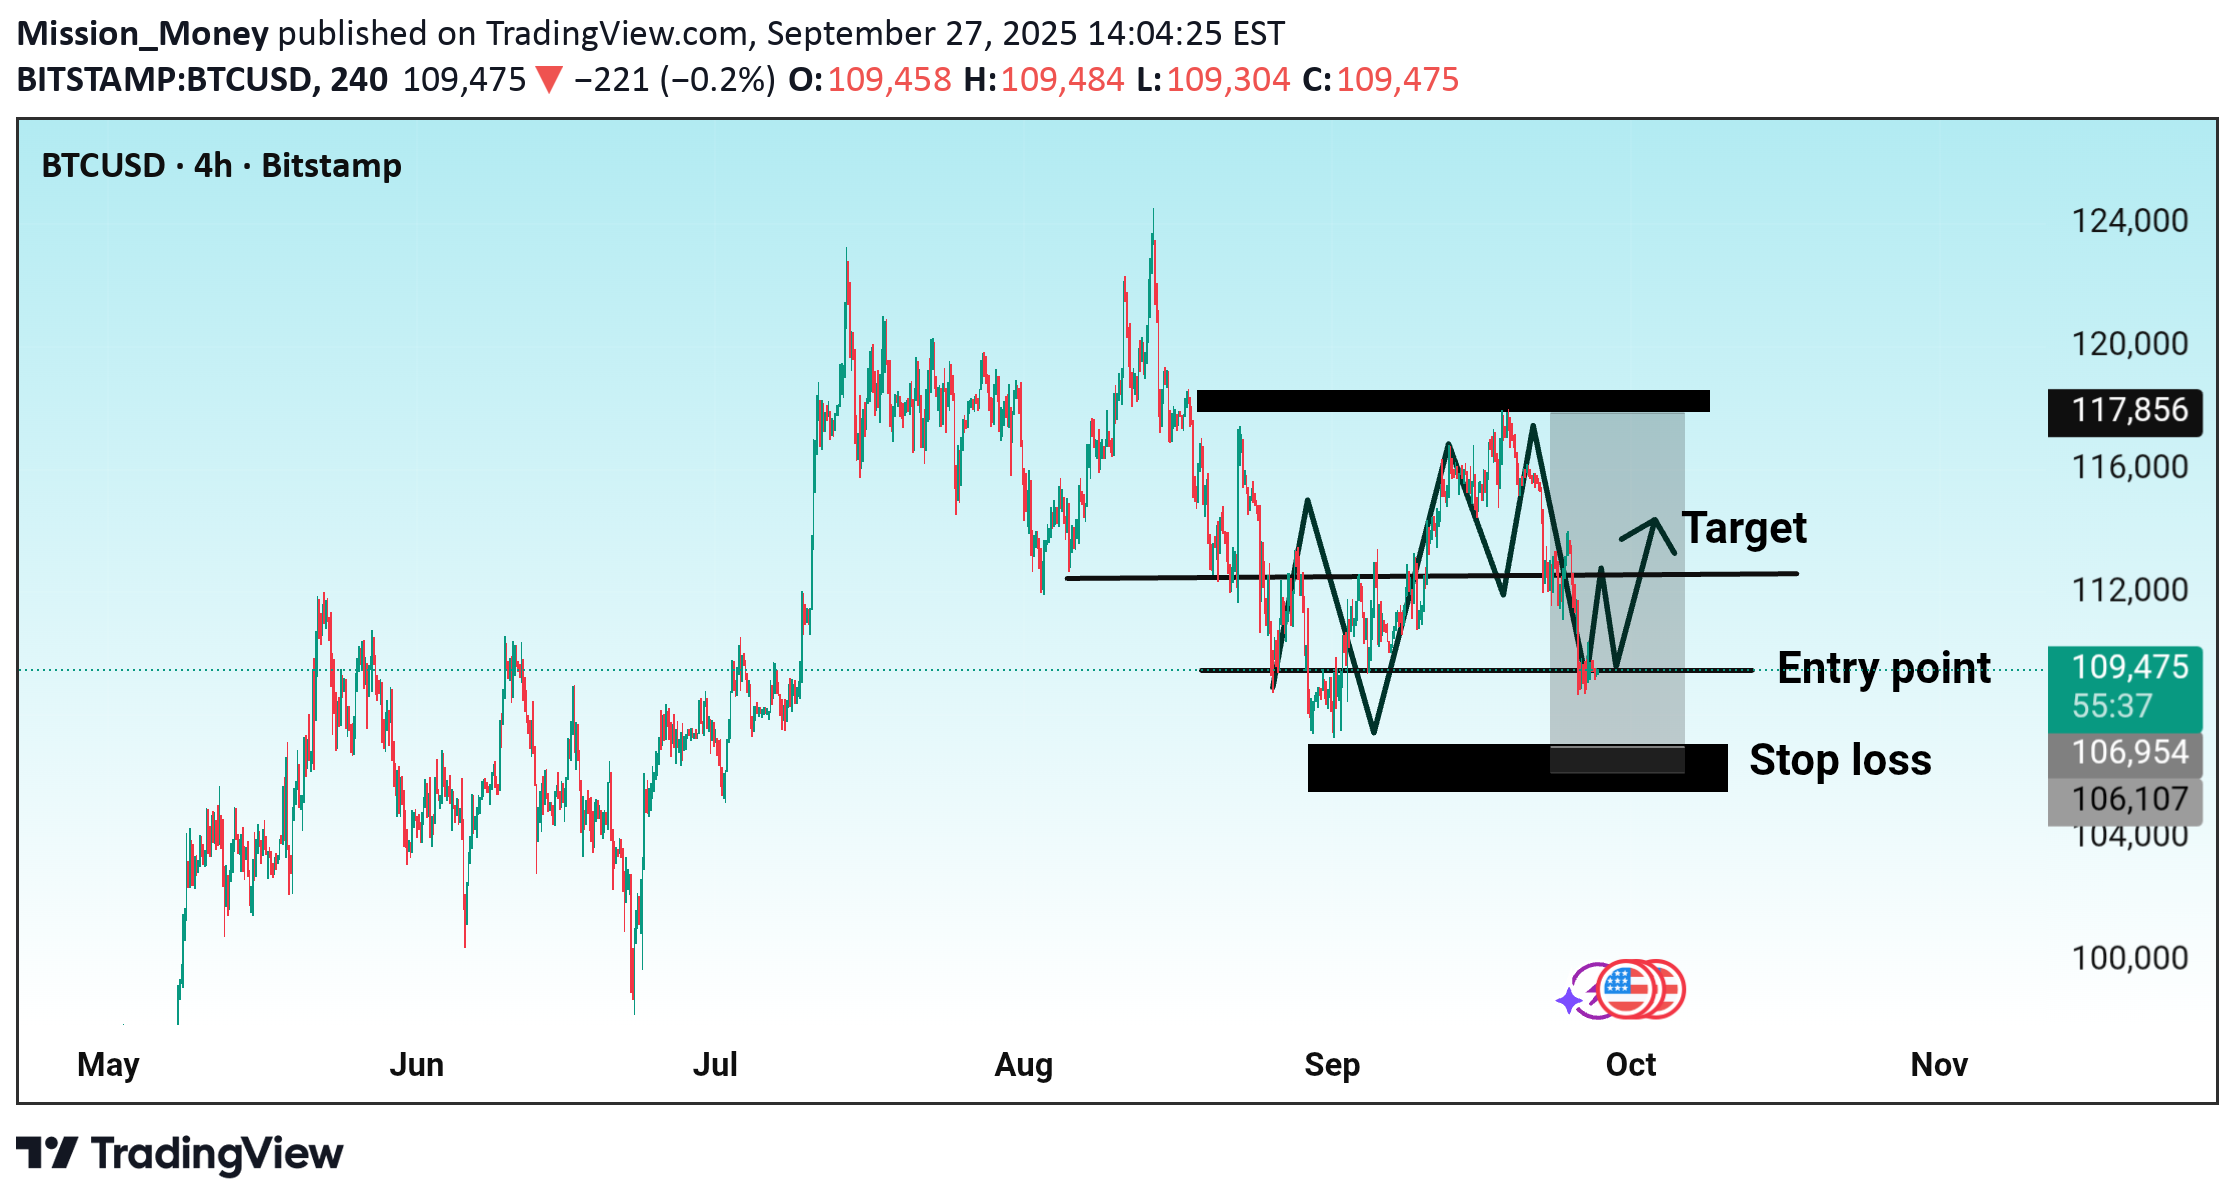
This chart is a BTC/USD (Bitcoin) 4-hour timeframe analysis from Bitstamp, showing a possible long (buy) setup. Here are the details: Key Levels & Setup: Entry Point: Around 109,484 Stop Loss Zone: Between 106,107 – 106,954 (below recent support to limit risk) Target: Near 112,000 (local resistance zone) Structure: The price action is moving inside a range / consolidation zone after a previous strong uptrend. Multiple touches on support and resistance confirm the range boundaries. The chart suggests a bounce from support (around 107k) aiming back toward resistance. Strategy: Buy (Long) entry around 109,484. Stop Loss below 106,954 (to protect against further downside). Take Profit (Target) near 112,000. Risk/Reward: Risk: ~3,000 points (from 109,484 to ~106,500). Reward: ~2,500 points (from 109,484 to ~112,000). R:R ratio ≈ 1:0.8 (not very favorable — better confirmation needed). ⚠️ This setup assumes Bitcoin will respect support and bounce upward. If support breaks, bearish continuation is likely. Do you want me to rewrite this into a short professional signal description (like the ones you post for TradingView/Minds)?
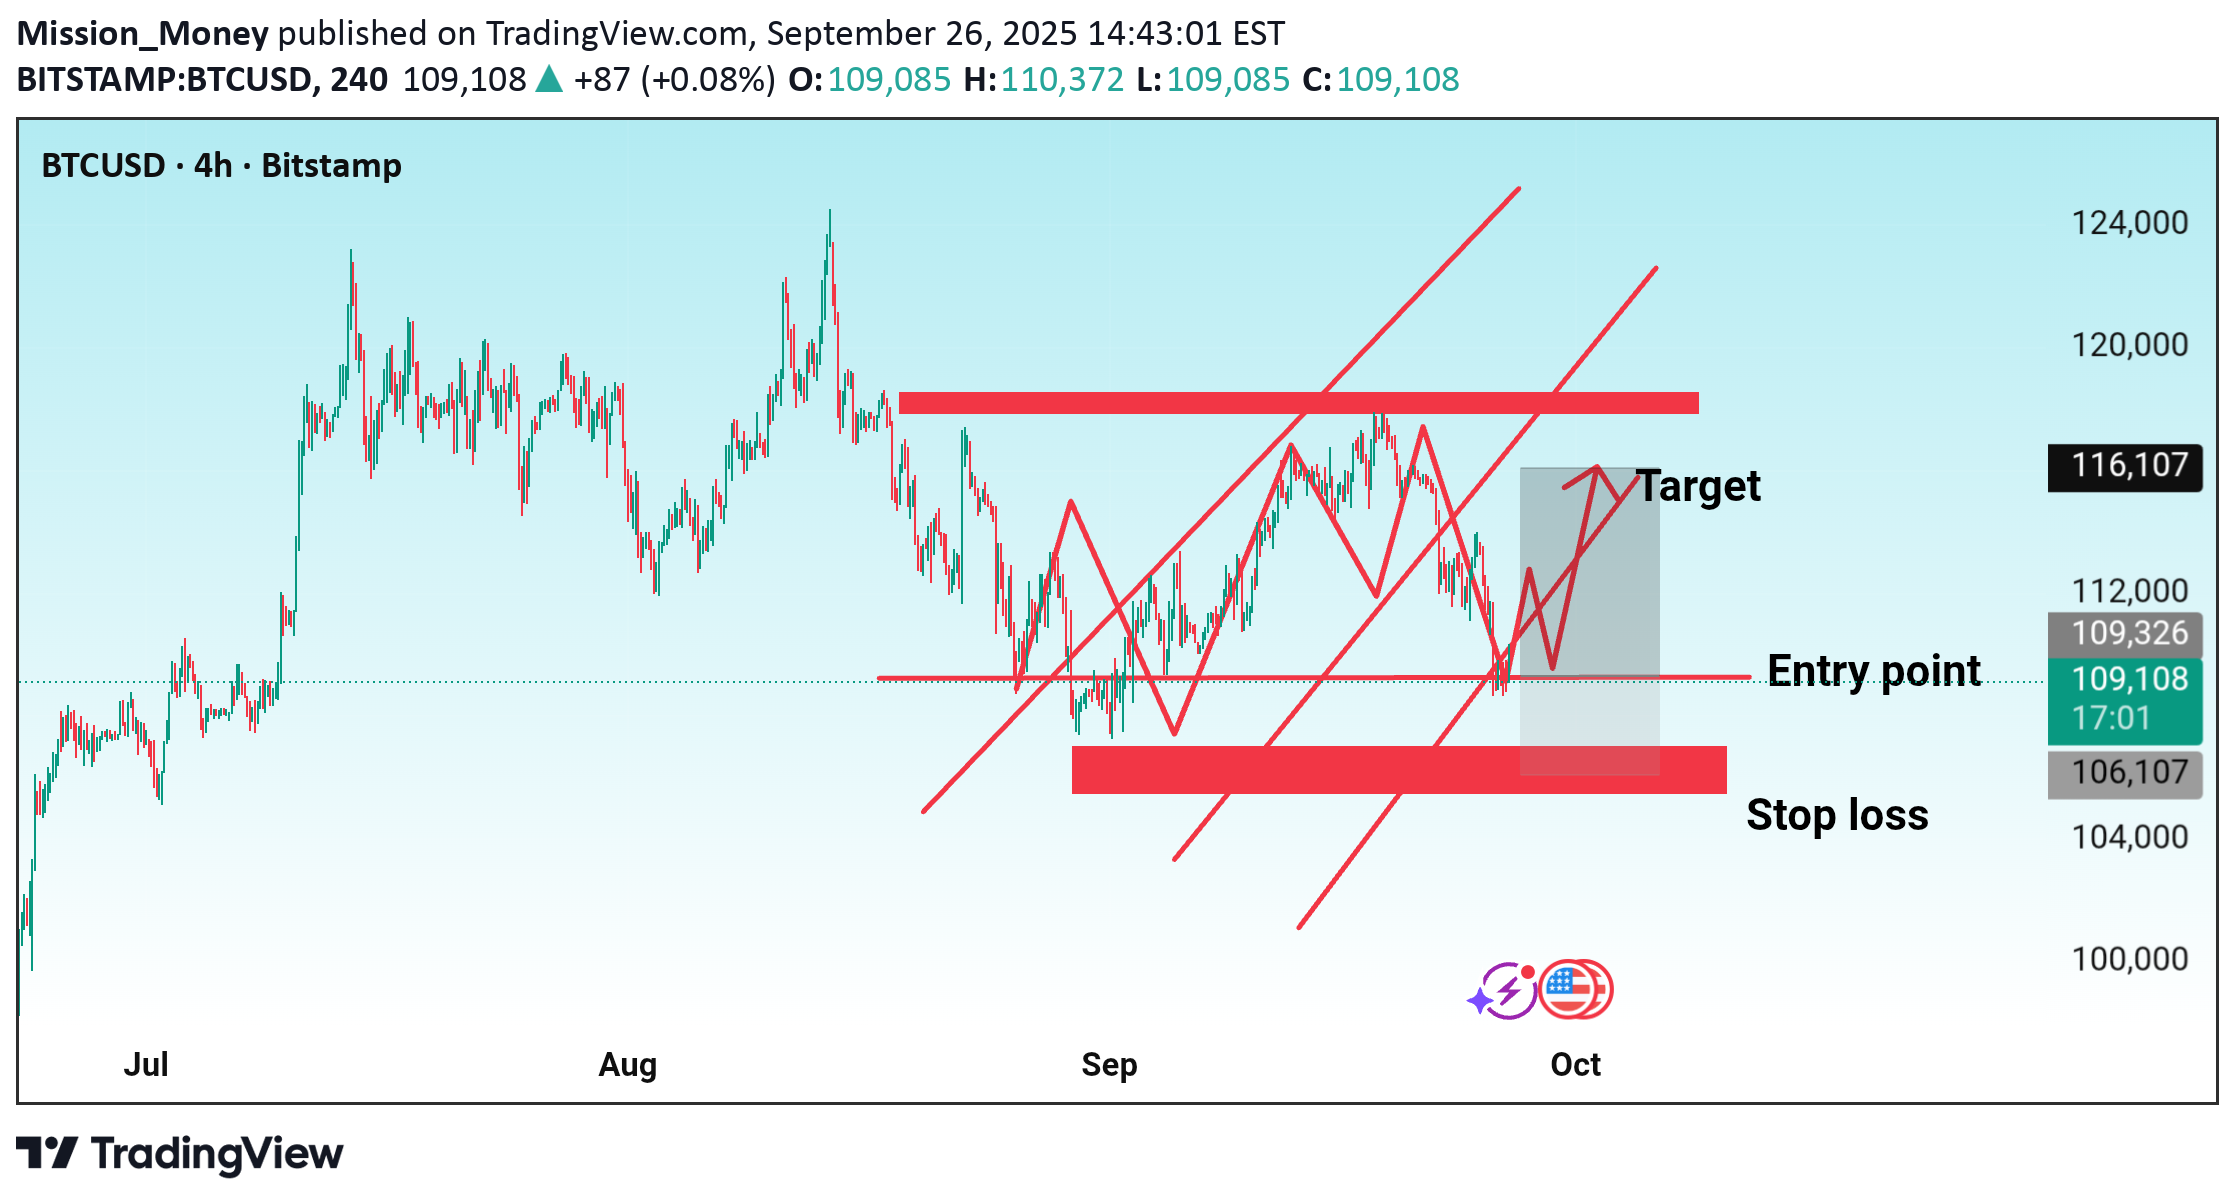
Here’s a detailed breakdown of the trade setup shown in your chart: Pair & Timeframe: BTC/USD (Bitcoin vs US Dollar) 4H (4-hour timeframe, Bitstamp exchange) --- Trade Plan 1. Entry Point: Around 109,326 Price is currently close to this zone (109,139). 2. Stop Loss: Set at 106,107 Positioned below the strong horizontal support zone to protect from downside risk. 3. Target: 116,107 This aligns with the upper resistance level of the channel/structure. --- Chart Structure & Analysis The chart shows a range-to-channel breakout pattern. Price has been moving sideways in a consolidation range (support ~106K – 109K, resistance ~116K). The drawn zig-zag indicates a possible bullish reversal after multiple touches on the lower boundary. Trendlines suggest a breakout towards the upside, targeting the higher channel resistance. --- Risk-Reward Ratio (RRR): Entry: ~109,326 Stop Loss: ~106,107 (risk ≈ 3,200 points) Target: ~116,107 (reward ≈ 6,800 points) RRR ≈ 1:2.1 → Good setup. --- ✅ Summary: This is a long (buy) setup on BTC/USD. Entry: ~109,326 Stop Loss: ~106,107 Target: ~116,107 Bias: Bullish, with a favorable risk-to-reward ratio. Would you like me to also write this in a TradingView post-style description (clear, short, and suitable for publishing)?
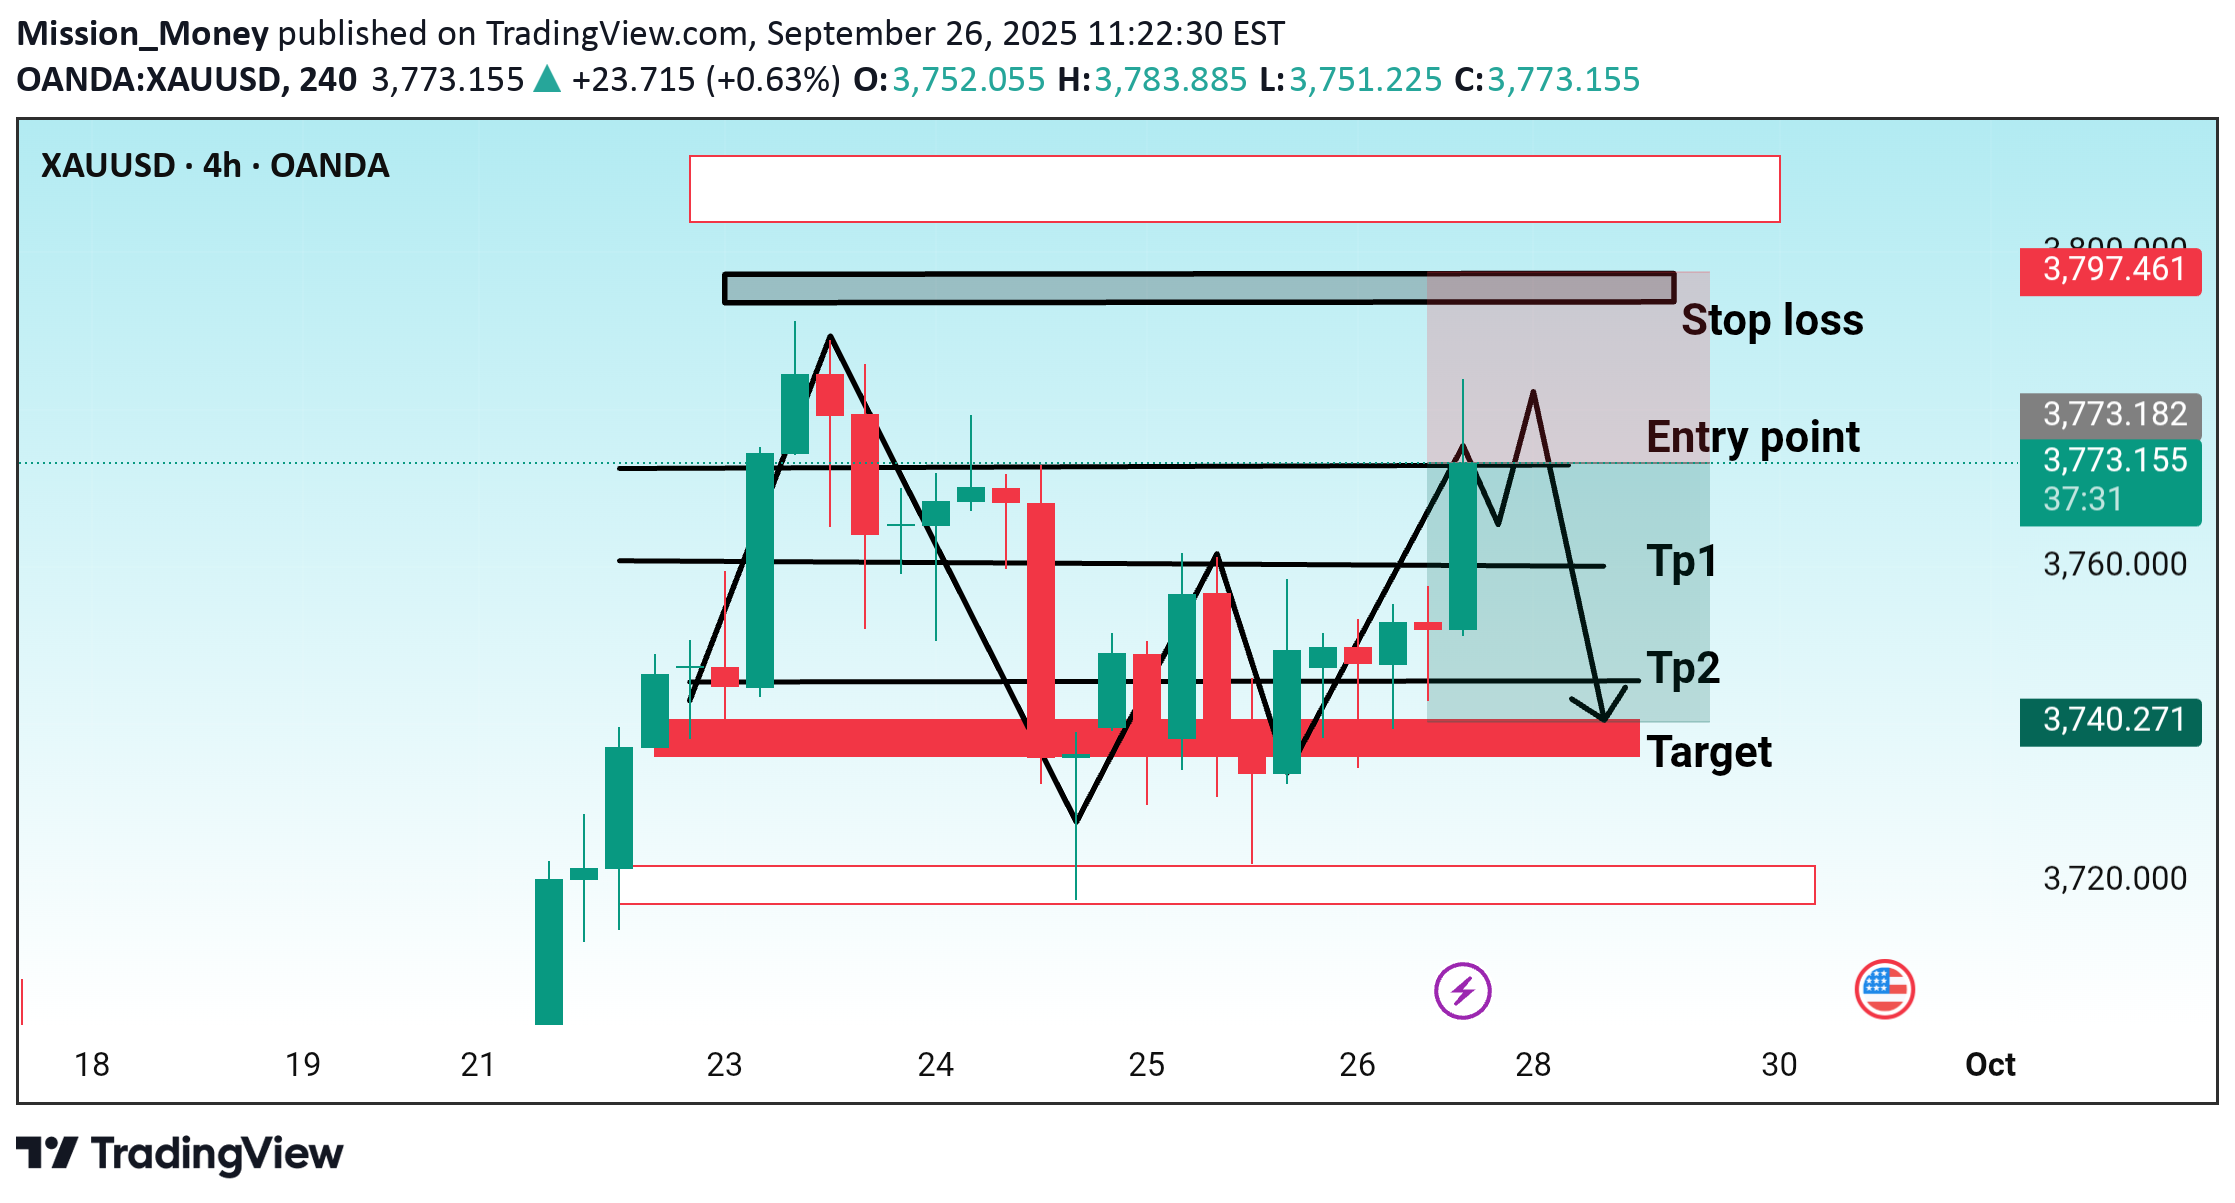
I see your chart for XAUUSD (Gold) on the 4H timeframe, and here’s a breakdown of the trading setup shown: 🔹 Trade Setup Details: Pair/Asset: XAUUSD (Gold) Timeframe: 4H (OANDA broker feed) 🔹 Levels: Entry Point: Around 3775 Stop Loss: 3797.461 (just above resistance zone) Take Profit 1 (TP1): 3760 Take Profit 2 (TP2 / Final Target): 3740.271 Extended Target Zone: ~3720 (shown below as potential continuation if breakdown continues) 🔹 Technical View: Market is forming a potential double top / bearish structure near the resistance area (highlighted zone). The entry point (3775) aligns with a breakdown confirmation. Stop loss is placed safely above recent highs and resistance (~3797). Targets are staged: TP1 (3760) → conservative, near mid-support. TP2 (3740) → stronger support zone. Extended → 3720 if bearish momentum accelerates. 🔹 Risk–Reward: Risk (Stop Loss – Entry): ~22 pips. Reward: TP1: ~15 pips (less than 1:1). TP2: ~35 pips (about 1.6:1). Extended: ~55 pips (around 2.5:1). 👉 This setup is structured for short (sell) positions, with scaling out at TP1 and holding partial positions for deeper targets. Would you like me to write a short description (signal-style) that you can directly post on TradingView/Minds, like you asked in your past signals?
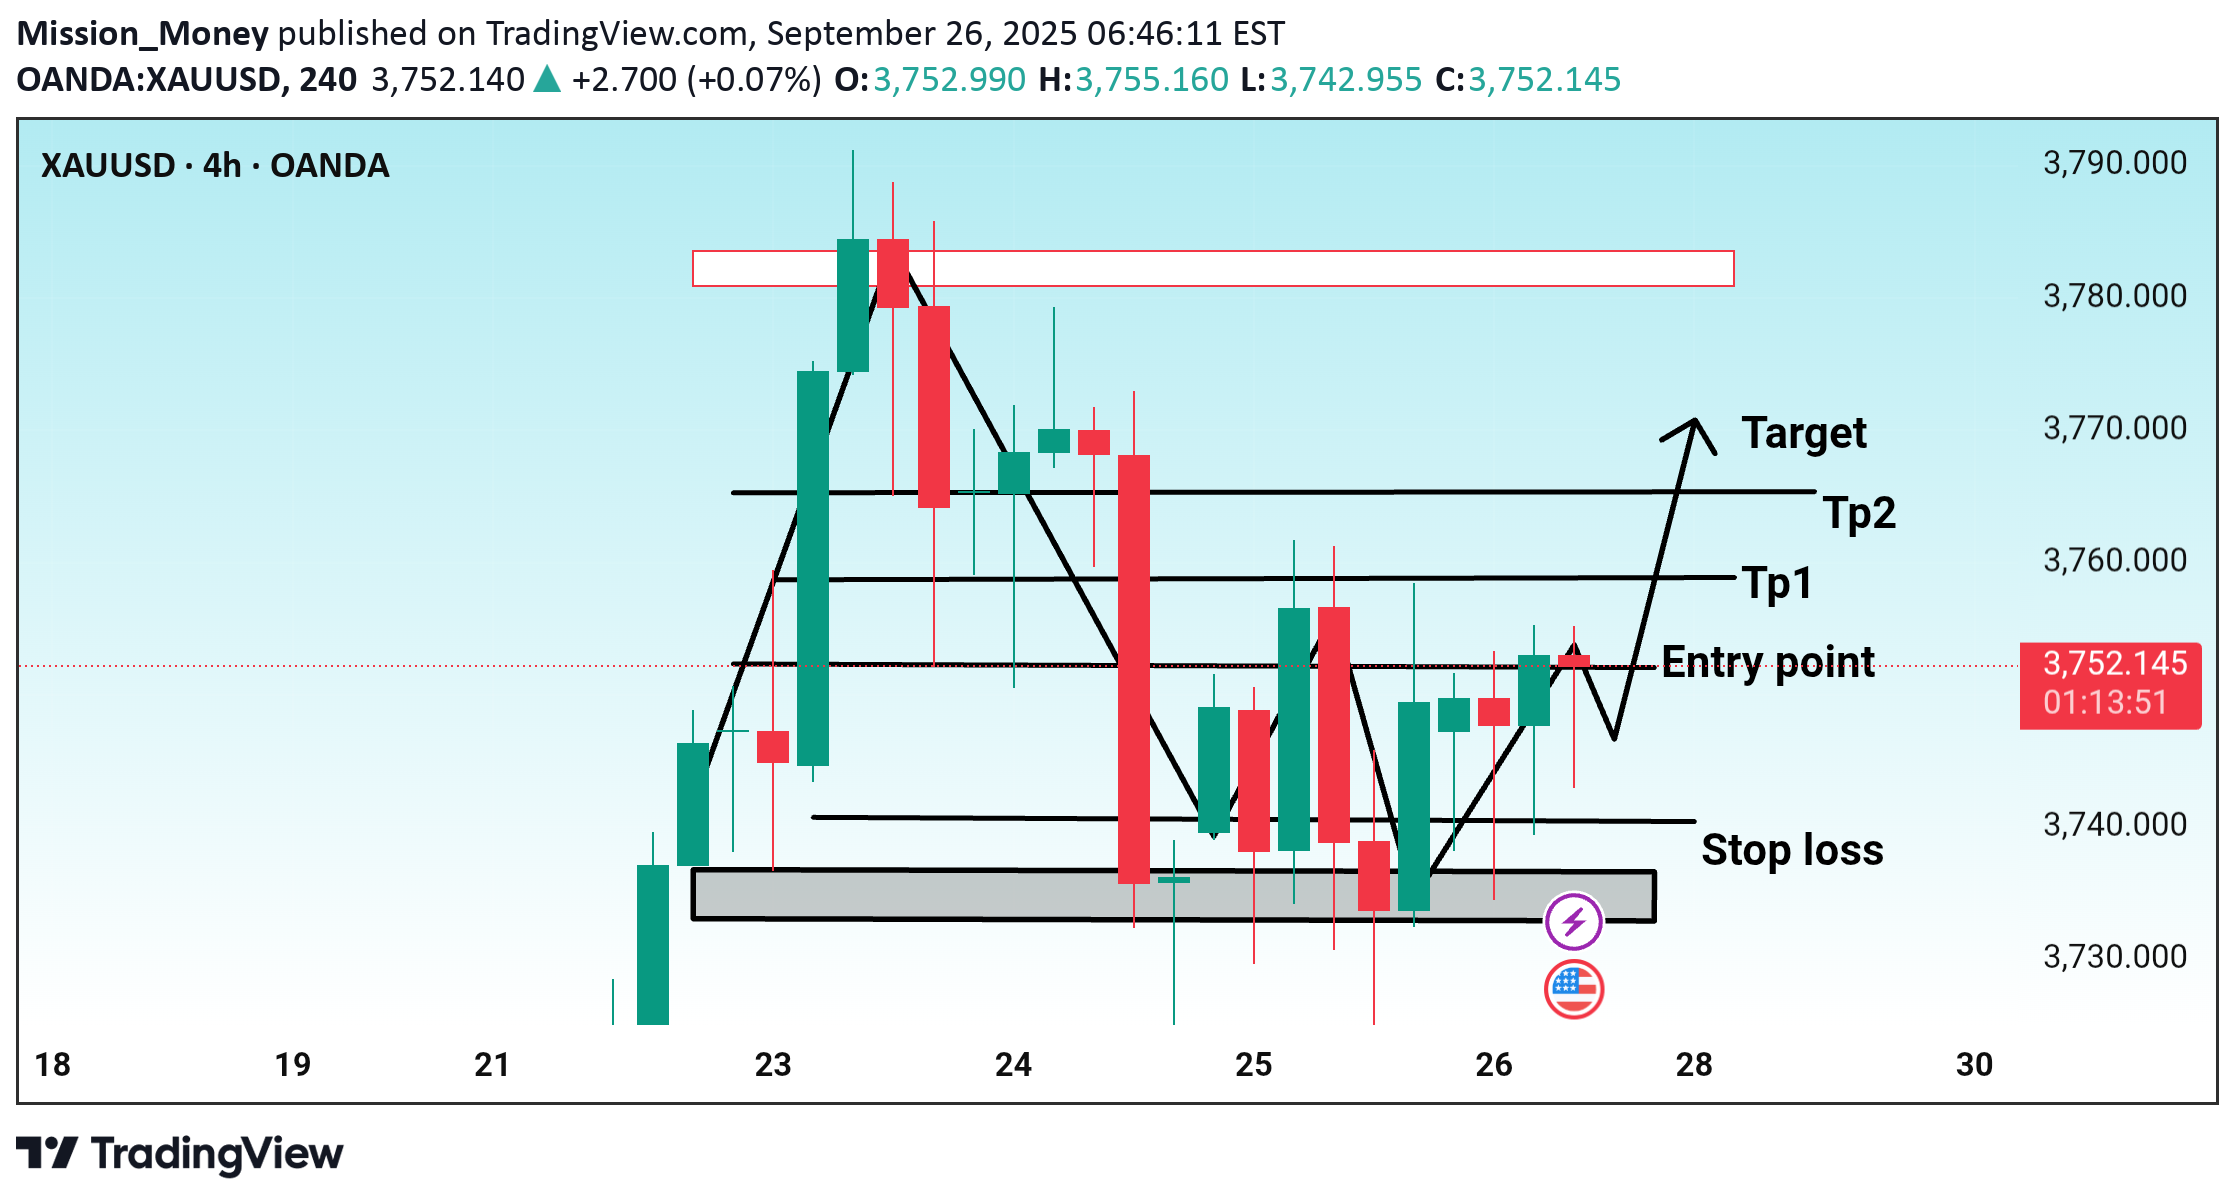
This chart is for XAU/USD (Gold vs. US Dollar) on the 4-hour timeframe (OANDA broker). Let me break down the trade setup shown: Trade Setup Details Entry Point: Around 3752 Stop Loss: Below 3740 (This is the risk management zone marked in black at the bottom) Target Levels: TP1 (Take Profit 1): Around 3756 TP2 (Take Profit 2): Around 3765 Final Target: Near 3770 Chart Analysis The setup is a long/buy trade idea. The highlighted black box at the bottom indicates a support zone, where buyers are expected to hold price. After testing support, the price is projected to rise toward the higher resistance levels. The risk-to-reward ratio looks favorable, as the potential upside (3765–3770) is larger than the downside (3740 stop). Summary Buy (long) entry: ~3752 Stop loss: ~3740 Take profits: TP1: 3756 TP2: 3765 Target: 3770 This is a short-term bullish setup based on support bounce and target levels. Do you want me to also write a ready-to-post description for TradingView Minds (like the ones you ask for signals) with this setup?
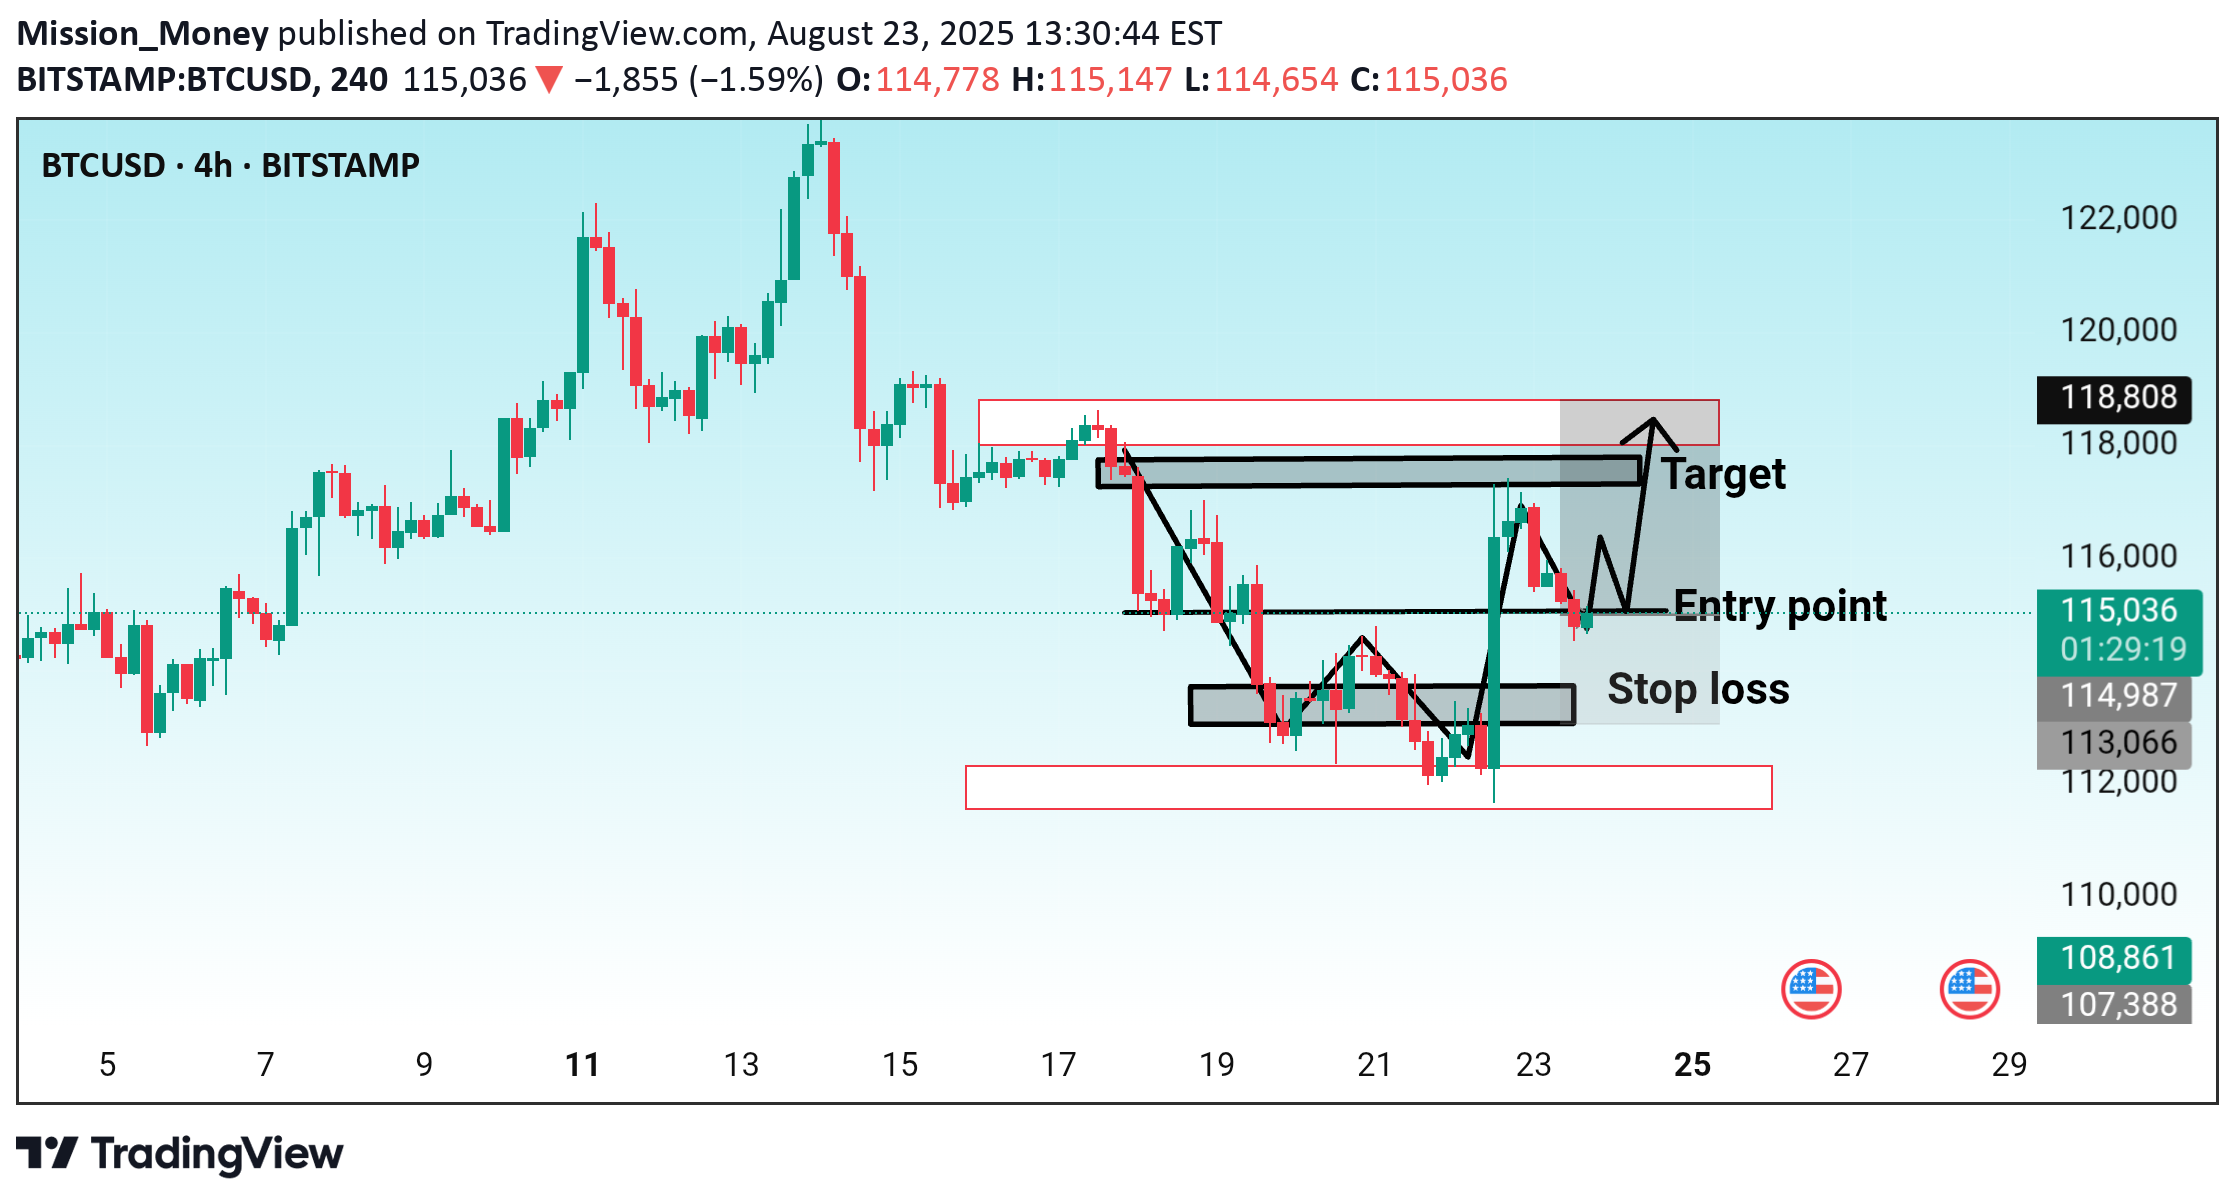
This chart is a BTC/USD (Bitcoin/US Dollar) 4-hour setup showing a bullish trading idea. Here are the key details from the analysis: Entry Point: Around 115,000 This is where the chart suggests entering a long (buy) position. Stop Loss: Placed just below 113,000 – 113,100 This is to protect from downside risk if the price moves against the trade. Target (Take Profit): Around 118,800 This is the expected resistance level and potential profit zone. Chart Pattern: The setup is based on a reversal/breakout structure after a downtrend. The highlighted zones show: A support area where the market previously reversed (bottom box). A resistance zone near 118,800 (top box). The current structure suggests a possible upward continuation toward that resistance. Risk/Reward Ratio: Risk (Stop loss distance): about 2,000 points (115,000 → 113,000). Reward (Target distance): about 3,800 points (115,000 → 118,800). Approximate R:R = 1:2, which is favorable. 🔹 Summary: The chart suggests a buy trade on BTC/USD from 115,000, with a stop loss below 113,000 and a target near 118,800. This is a bullish short-term setup with a good risk-to-reward ratio. Would you like me to also write this as a ready-to-post description for TradingView Minds like I did for your previous signals?
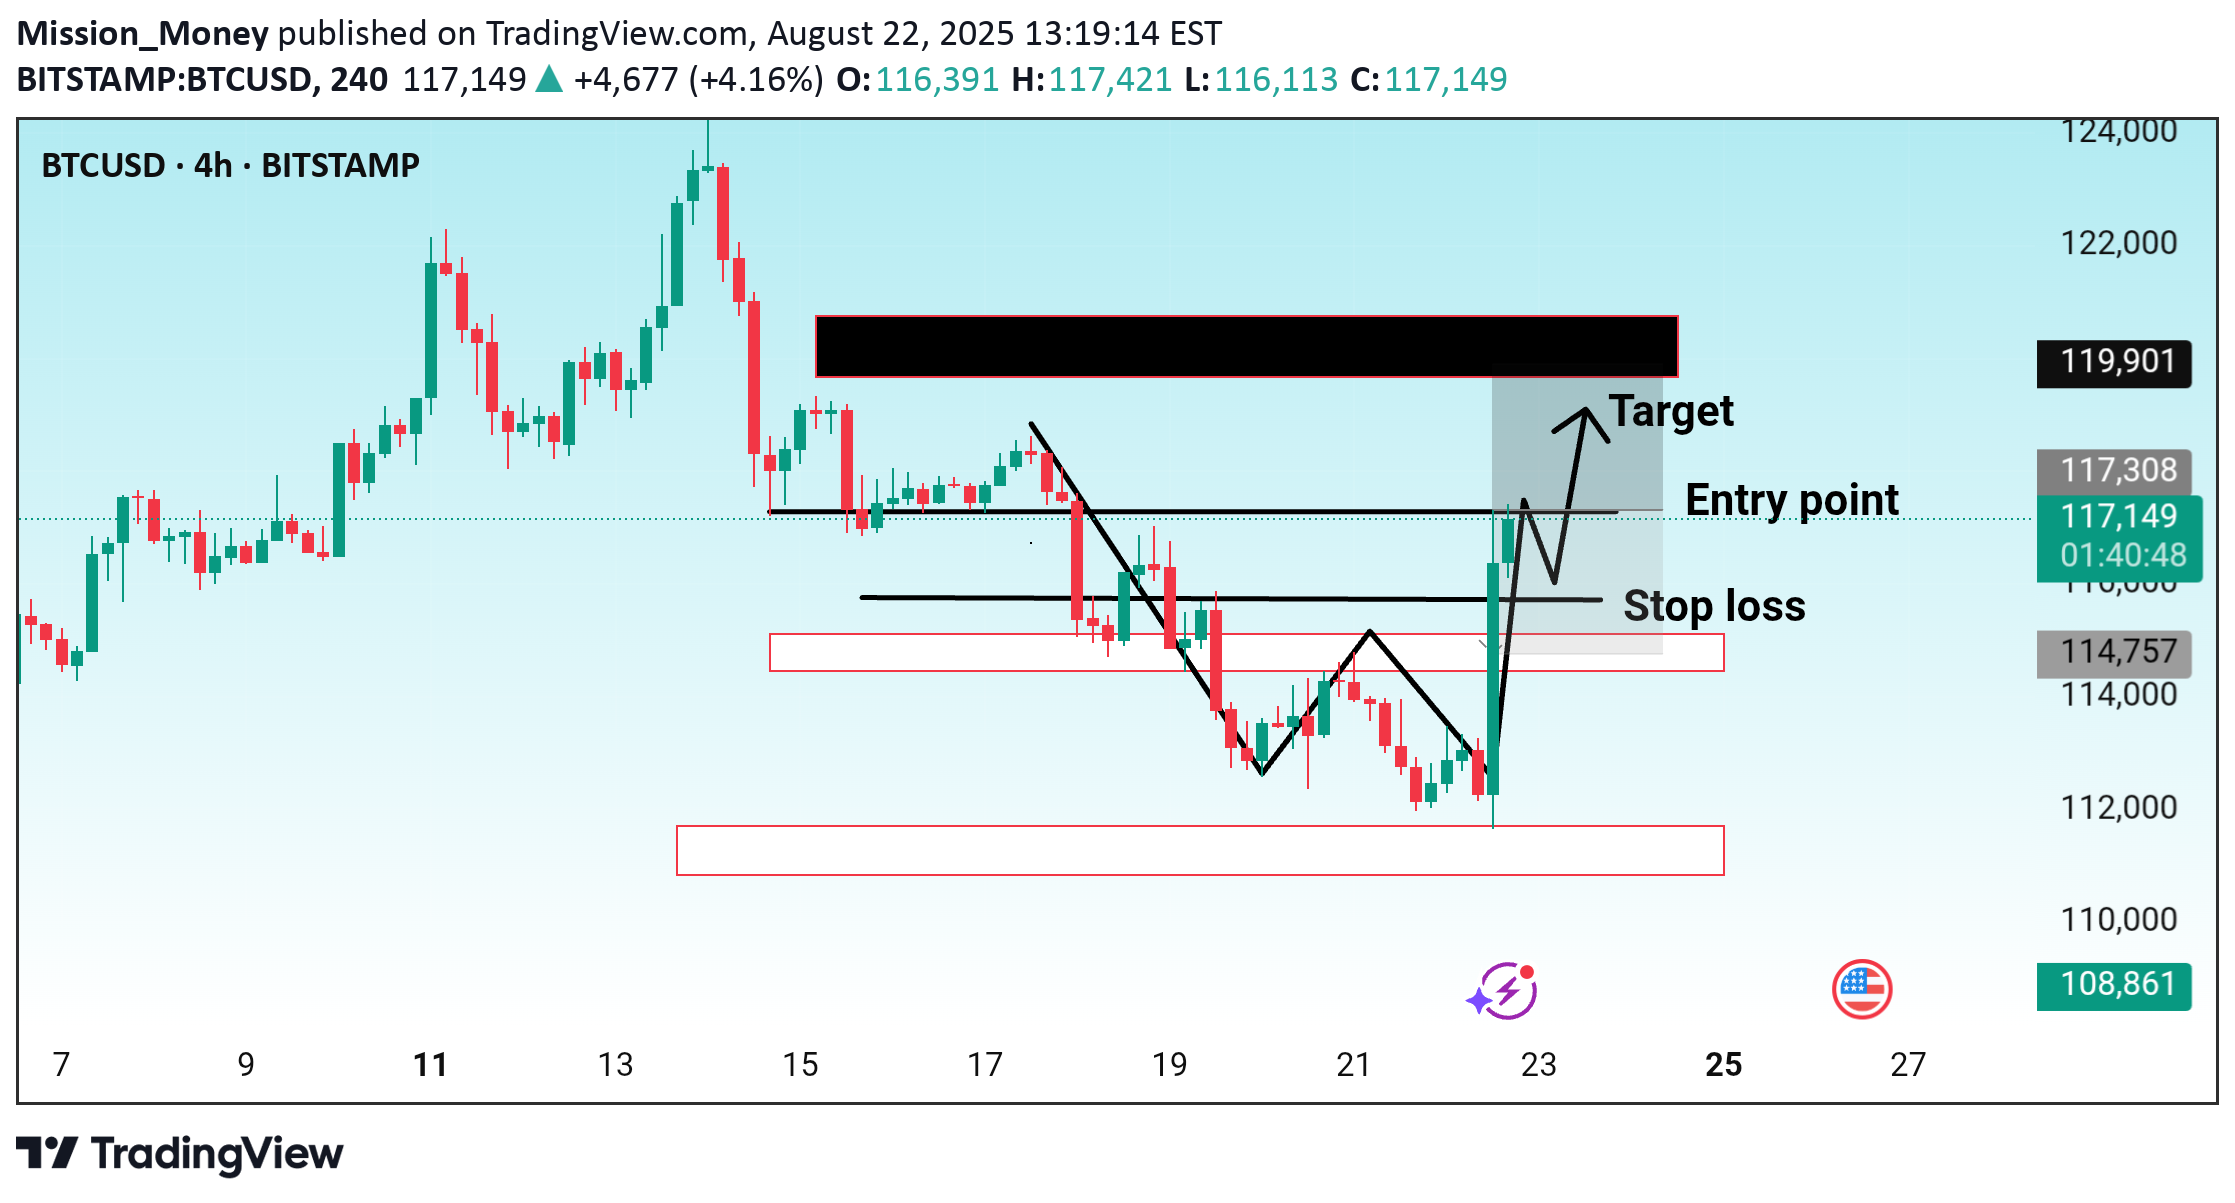
Pair: BTCUSD (Bitcoin / US Dollar) Timeframe: 4H (4-hour candles) Exchange: Bitstamp Trade Setup: Entry Point: Around 117,319 (current price zone). Stop Loss: Near 117,308 – 114,757 support area (depending on risk tolerance). Target: Around 119,901 (resistance zone highlighted in black).
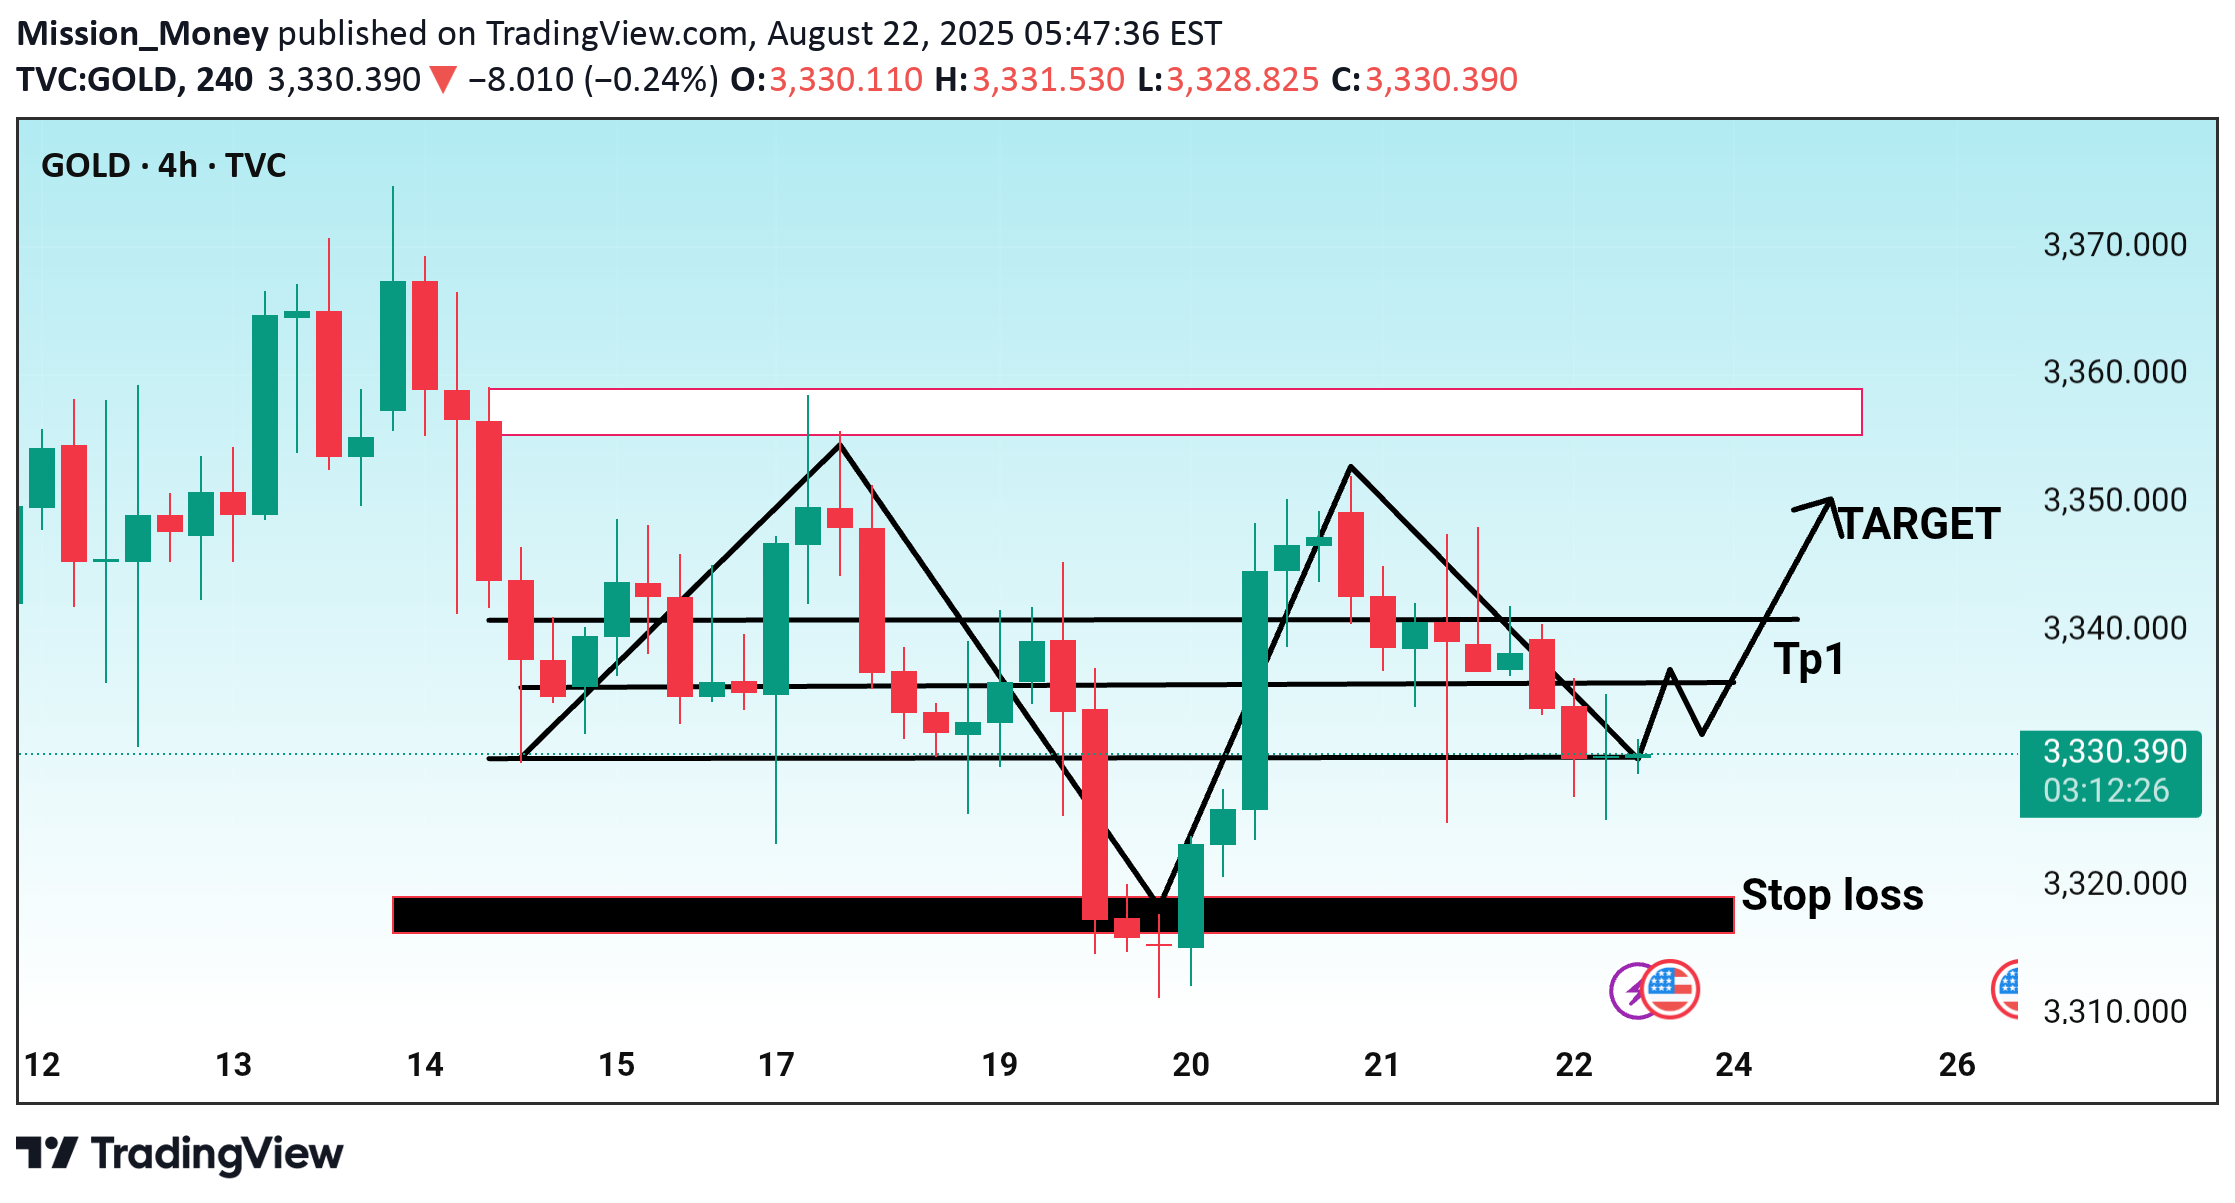
Here’s the detailed breakdown of the Gold (XAU/USD) 4H chart setup you shared: 🔎 Chart Analysis Current Price: 3329.86 Pattern: Double bottom / inverse “W” structure forming, signaling potential bullish reversal. Support Zone: Around 3320 – 3325 (highlighted as stop-loss area). Resistance Levels: First resistance (TP1): 3340 Major resistance / Final Target: 3355 – 3360 📊 Trade Idea Entry Zone: Near 3325 – 3330 Stop Loss: Below 3320 (to protect against further downside). Take Profit 1 (TP1): Around 3340 Final Target: 3355 – 3360 ⚖️ Risk-Reward Risk: ~10 points (if stop-loss is triggered). Reward: ~30 points (upside potential to 3355–3360). Risk/Reward Ratio: ~1:3, which is favorable. 📌 Conclusion The chart suggests a bullish setup with buyers expected to step in around 3325 support. If momentum holds, price could push first to 3340 and then toward 3355–3360 target. Failure to hold above 3320 will invalidate the setup. Would you like me to also write this in a short TradingView description format (like a post caption) so you can directly copy-paste it?
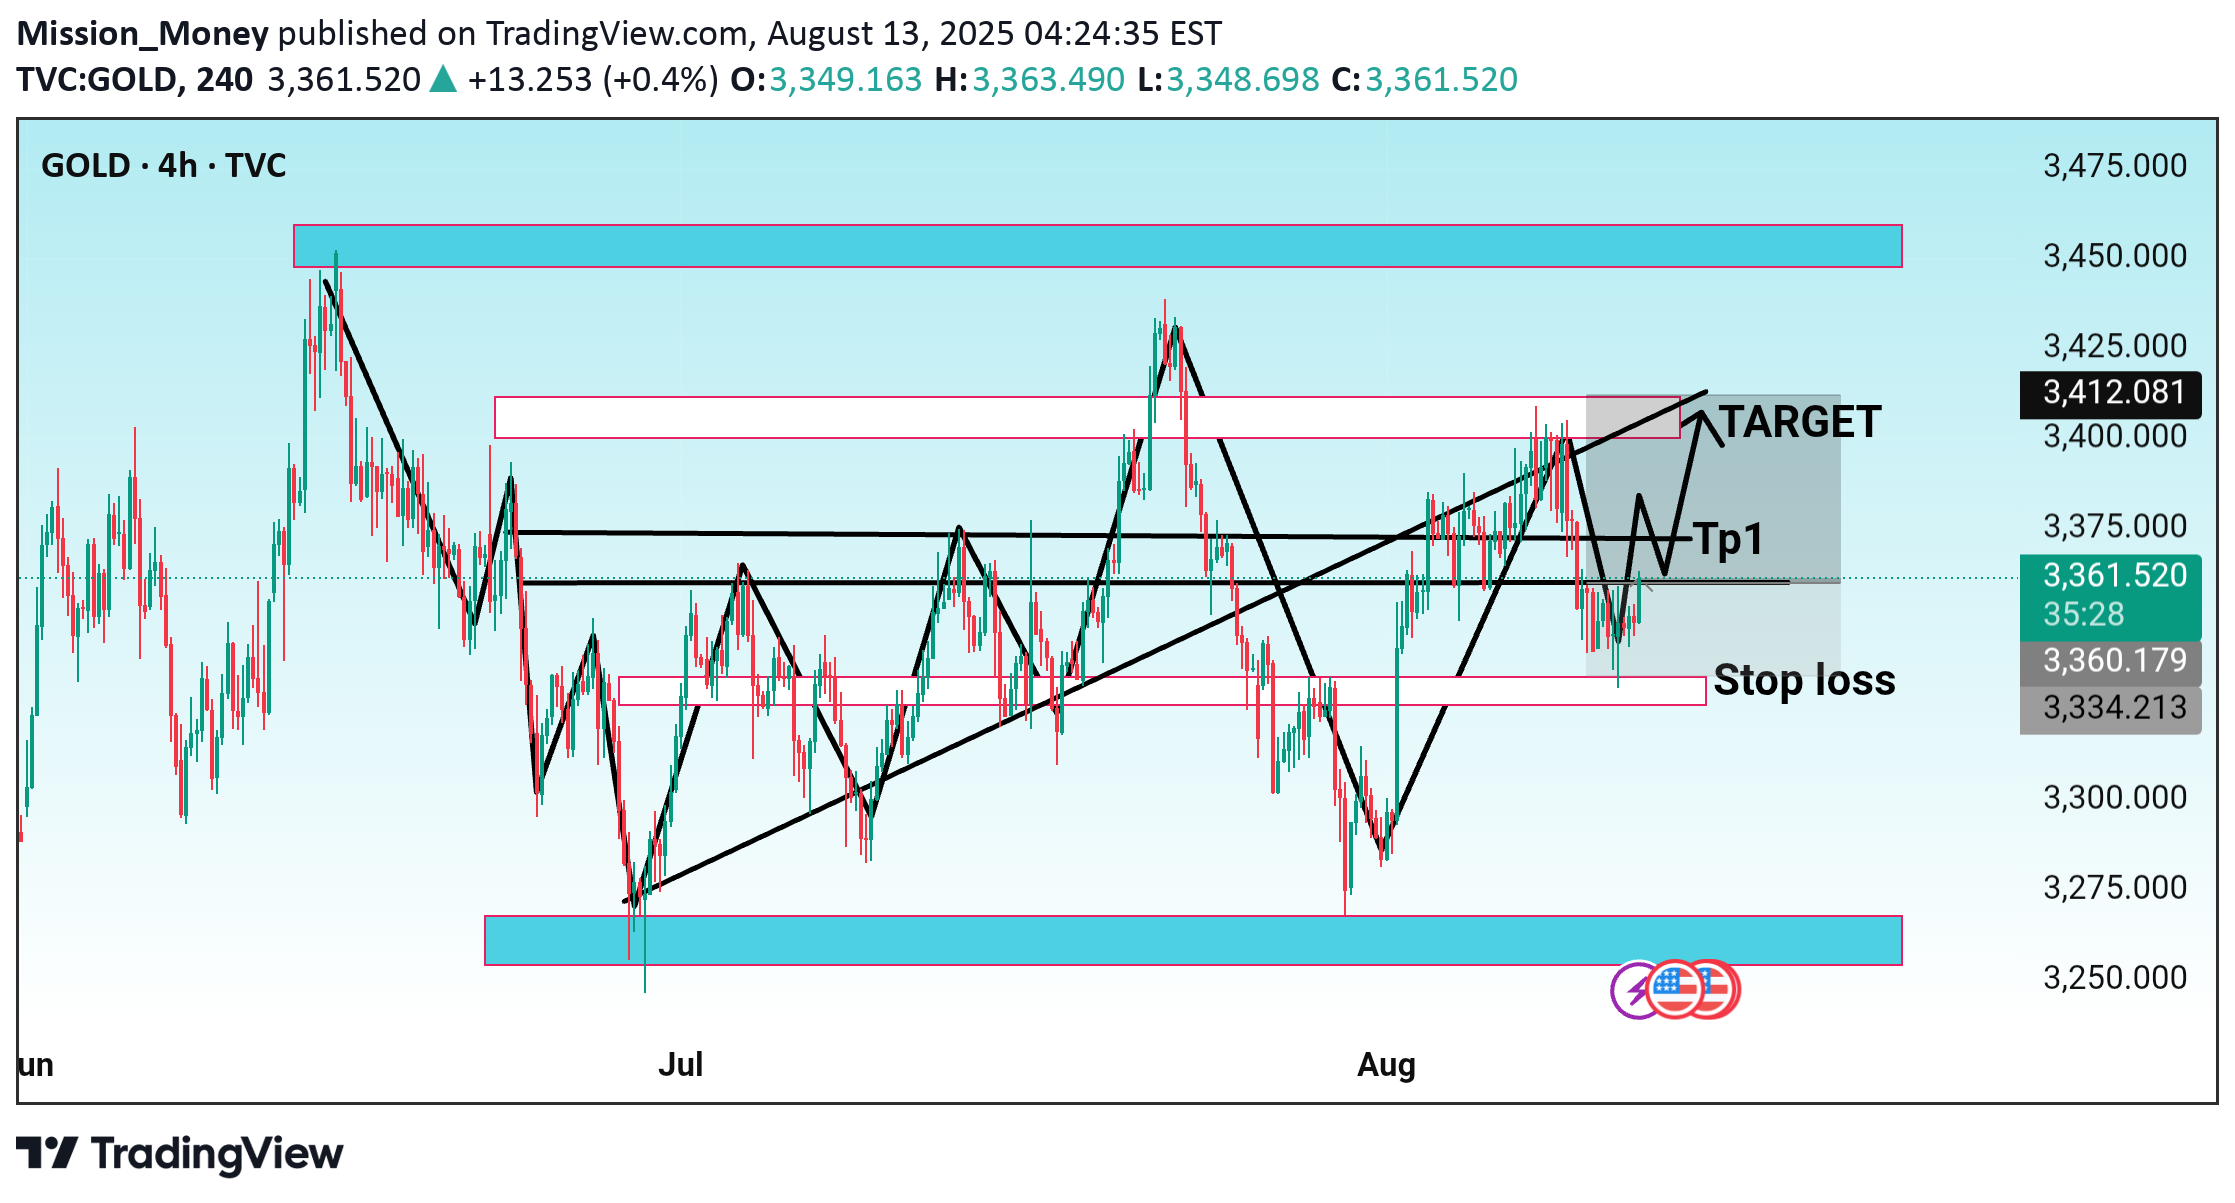
This GOLD (4H) chart suggests a bullish trade setup with a structured entry, TP (Take Profit) levels, and SL (Stop Loss) placement: 1. Current Price Area: Price is around 3,360.843 and has bounced from a recent support level. 2. Support & Resistance: Support Zone: ~3,334–3,336 (pink horizontal level near "Stop loss"). Resistance Zone / Target Area: ~3,440 (upper pink box). 3. Trade Plan (From Chart Markings): Entry Zone: Around current price after breakout confirmation or pullback. TP1 (Take Profit 1): Around 3,400 — partial close recommended. Final Target: Around 3,440 — major resistance level. Stop Loss: Below 3,334 — beneath the recent swing low & support zone. 4. Technical Structure: Market has formed a higher low and is attempting a trend continuation upward. Break above mid-resistance (~3,400) would confirm bullish momentum. Risk-reward looks favorable if entry is near current support. 5. Bias: Bullish as long as price stays above 3,334. Watch for rejection near 3,400 before entering aggressively. If you want, I can also give you a step-by-step trade execution plan based on this chart’s setup.
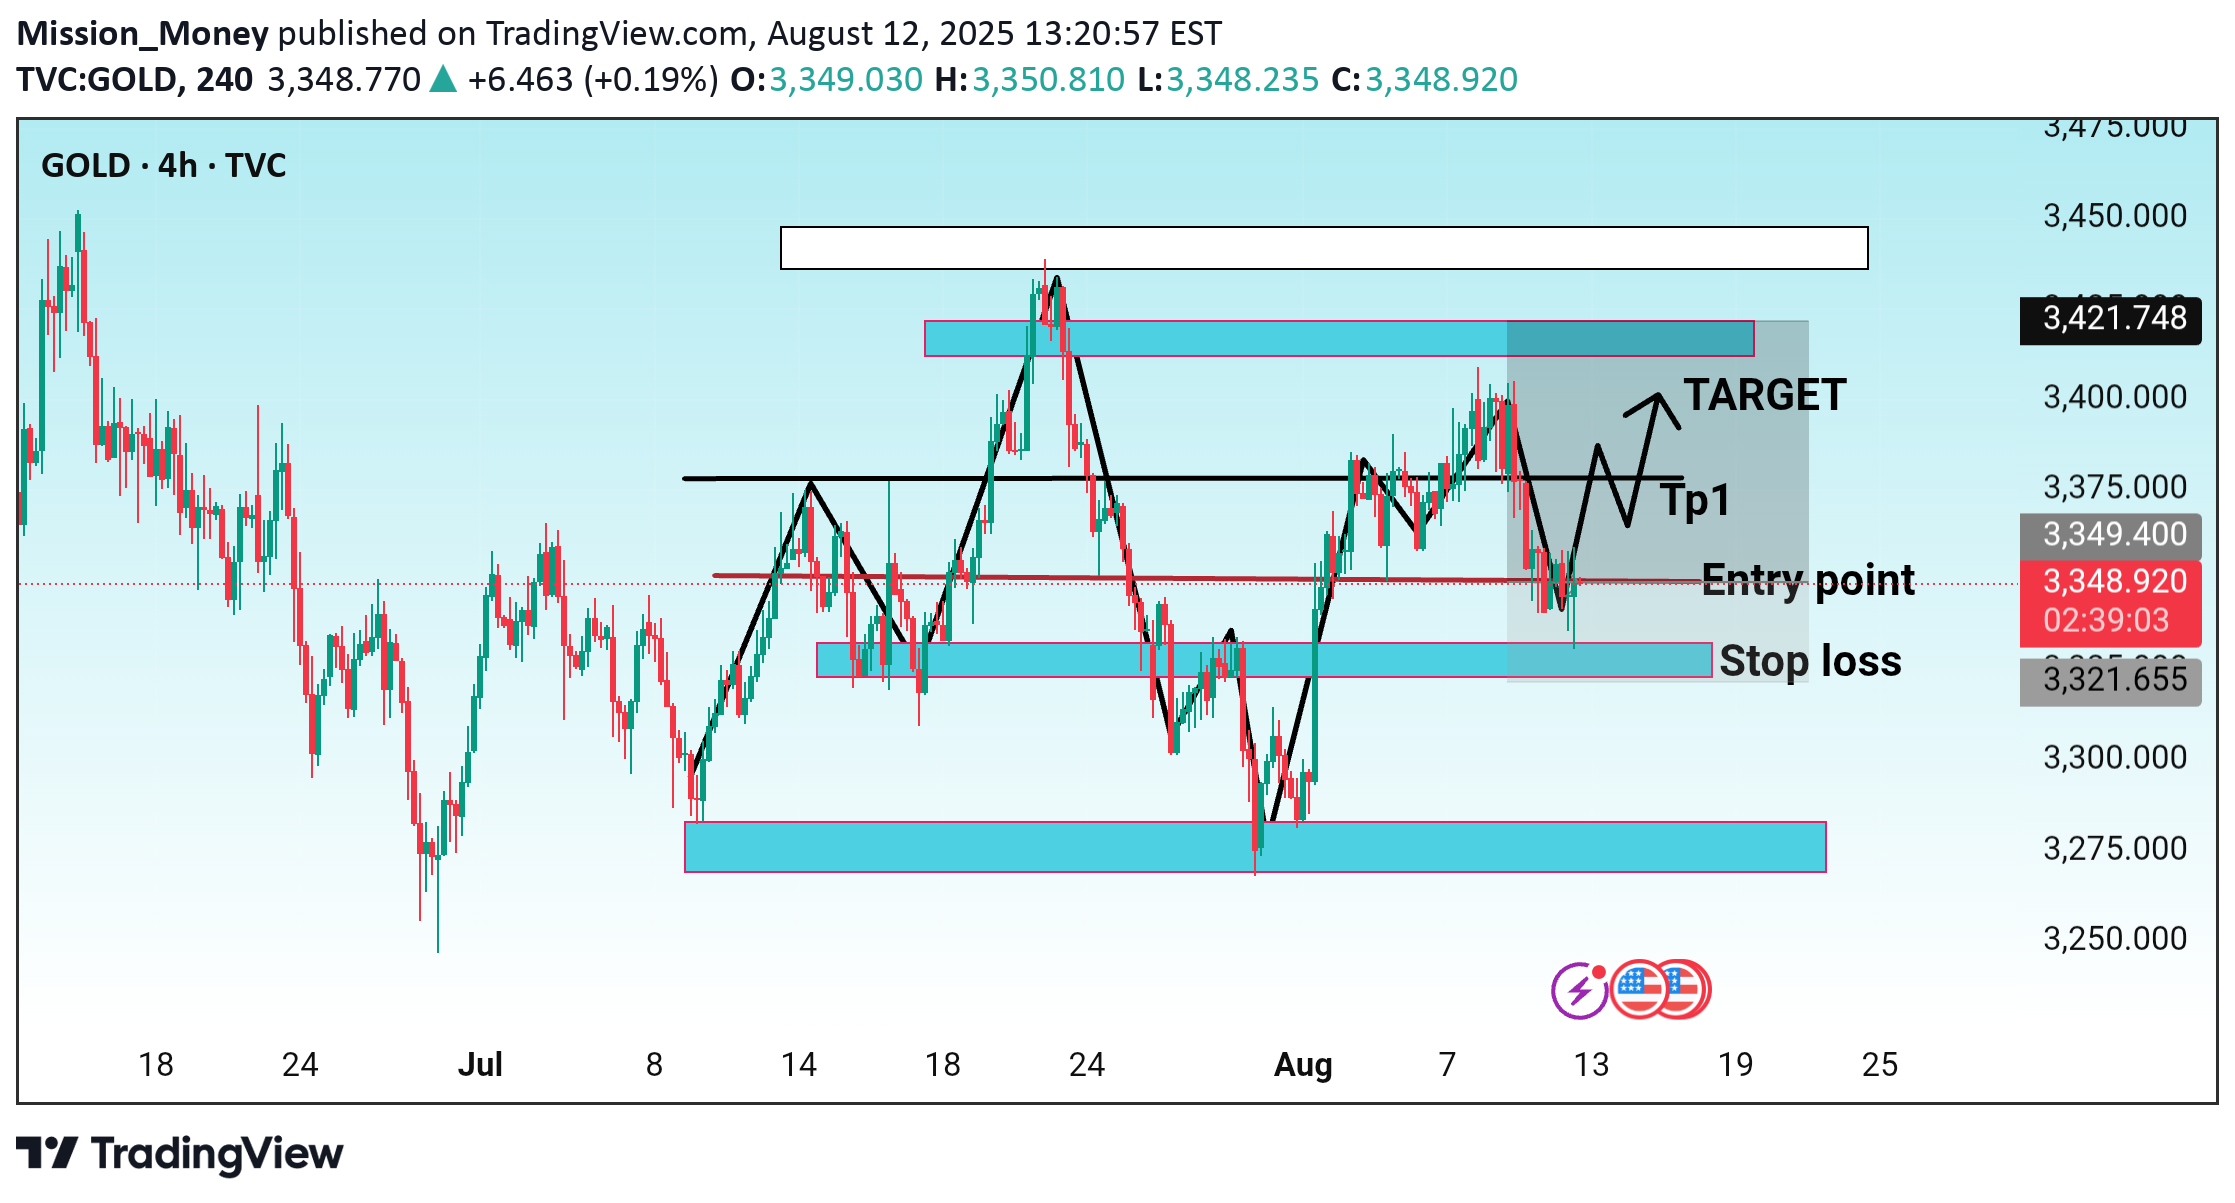
This chart is a bullish trade setup for Gold (4H timeframe) with a clear plan for entry, stop loss, and targets. Here’s the breakdown: Entry Point: Around 3,349.400 Stop Loss: 3,321.655 (below the nearest support zone to protect against downside risk) Take Profit 1 (TP1): Midpoint of the shaded grey area, slightly under 3,400 Final Target: Around 3,421–3,440 zone (highlighted with the top white rectangle) Technical Notes: Price is bouncing from a recent support zone (pink rectangle at the bottom of the grey box). The pattern suggests a possible higher low formation before moving toward the upper resistance. Black arrows indicate the anticipated bullish wave movement. Grey shaded zone marks the area between entry and target for monitoring price action. This plan relies on bullish momentum holding above the 3,321 support, aiming to capture the move toward the 3,400–3,440 resistance area. If you want, I can also give you the risk-to-reward ratio for this setup so you can judge trade efficiency.
Disclaimer
Any content and materials included in Sahmeto's website and official communication channels are a compilation of personal opinions and analyses and are not binding. They do not constitute any recommendation for buying, selling, entering or exiting the stock market and cryptocurrency market. Also, all news and analyses included in the website and channels are merely republished information from official and unofficial domestic and foreign sources, and it is obvious that users of the said content are responsible for following up and ensuring the authenticity and accuracy of the materials. Therefore, while disclaiming responsibility, it is declared that the responsibility for any decision-making, action, and potential profit and loss in the capital market and cryptocurrency market lies with the trader.