
Mikhiavelli
@t_Mikhiavelli

What symbols does the trader recommend buying?
Purchase History
پیام های تریدر
Filter
BTCUSD Daily Inflection Point Update

Previously I mentioned the weekly was consolidating, but there is potential for this momentum consolidation to have a breakout leg as momentum shifts and the final emotional price movements are played out. I was too conservative in my price projections; a lot more than I used to be- but there wasn't a whole lot of TA involved- I figured the dollar issues would crop up earlier.Now that the Fed had pivoted. the yields are creeping back up pushing bitcoin back down. The fed doesn't let on just how dire the situation is- and with global tensions rising, the dollar is at significant risk.I expect a broad correction in all the markets- and cash to become very tight.There is daily momentum consolidation- and if any other events occur that send yields upward- bitcoin is likely to suffer as a consequence. If instead we sail into the new year unscathed- then this consolidation may provide another leg up; but a break below 88k and a push towards 60k may solidify bitcoins correction.DAILYWEEKLY1 Hour consolidation/shift in a 3-hour/daily critical area.!5 Minute rotation and consolidation- possible breakdown, else breakout.1 hour is still rotating- expecting the reversal here. Potential for consolidation-breakout.This is what the daily looks like now- 1 hour and 3 hour had a breakout- At this point the real risk is the X factor- Global Tensions are likely to escalate- and the show is about to begin.If this doesn't gain much more momentum- then it might actually reverse here- It broke out on the 1 hour- but already sold off quite a bit.Seems like the AI market hit is not an accident. An orchestrated black swan event. I get the the feeling that it's the tip of the iceberg. That more events are lined up and will continue to occur to drive the social order.If we don't breakdown here- bitcoin breakout- Markets possibly green- Else- breakdown and continuation- rotation zone- daily downtrend.Looking for a spike in momentum to start a new downward leg here.30 minOur daily inflection point, momentum consolidation maximus.BTC trying to breakout on the daily- If successful it may reach 99k before attempting to reverse. Needs to close green on the daily to attempt the target.Expecting a trend back up- which could easily breakout- looking for consolidation on the next run up- before a major crash.
BTCUSD Daily Inflection Point

This is a continuation of the Weekly Inflection Point.On the daily we're getting close to a crucial area. A downward move here may indicate a large move, correction on the weekly, daily. 16k could easily be hit. There is also the potential for this momentum consolidation to have a breakout leg to 77-88k before a final correction.Watch for a break above or below the keltner channel. If the stock market is about to tank because WW3, the debt bubble created in 2008-2020, then Bitcoin will get shocked with it while everyone scrambles for PM's.After maybe bitcoin will be revived when people realize there isn't enough PM's out there, else some world wide digital currency emerges.Either way I have little hope for bitcoin, unless the NWO backs it because of the transparent transactions that can be traced, blacklisted, non fungible- control. Such a currency is a fools hope and will be used against you when tyranny seeks control over you.Bada Bing Bada BoomBada Bing Bada Boom👀👀👀Uh ohIt's close.Can't tell if we're at the peak of the channel or breaking out- We're in breakout territory, but I expect some Issues by november to emerge in the markets. Bitcoin may lead the way down; or try to breakout to 77k before november. There are some low time frame, 1 hr momentum shifts, which maybe consolidating to move higher, but also signal the potential top as momentum is dying, consolidating, and in position to shift the market bearish. We're in the crucial zone, the inflection point.Unless we get a big rejection, looks like this is the breakout leg to ~77k.So far there had just been consolidation, There are two 1 hour momentum shifts potentially forming a 3 hour shift. Waiting to see if we start the correction or not...3 Hour is breaking out, starting to look bullish.Potential rejection in key area on the daily. 1 Hour momentum shift, not a strong signal, likely consolidation.Price broke out, and is in bull territory on the daily, needs to build momentum, else a potential top remains.Weekly is in a key area- for break out or break down. If bitcoin doesn't follow gold and silver... then it might choose to follow the market after the election. 11.11Not much of an update, but things sren't looking so hot for bitcoin, and I'm leaning bearish still.Things are getting very interesting77k Hit Is it the top? Am I a dollar off the top?By all means this looks like it could keep going up. If it breaksdown it breaksdown.After a win for "humanity" against the NWO- Hope filling the hearts of people, There remains a tension in the air. Can you feel it?89k and now pre-market is dropping - bitcoin following... US10Y Starting to rotate back down.1 Hour, Potential 3 hour, Potential Daily Momentum Shifts. ⚛ soon?😉☢!!!
BTCUSD Weekly Inflection point

What I have here are a bunch of momentum channels piled on each other on the keltner channel oscillator. (weekly light blue, daily green, 3hr light purple) I didn't bother hiding lines from the diff time frames, which helps put into perspective each zone in accordance to the keltner channel TF price is in. IE on the weekly we're above the KC Mid Line. Same with each TF all the way to the 1 Hour where we're consolidating. A shift on the 1 hour makes for a potential shift on the 3 hour, and judging by our position in the relative channels on the various time frames I expect consolidation on the 3 hour with the potential to consolidate on the daily and weekly. This is what I call an inflection point.Weekly:Daily:3 Hour:Here is a previous chart with a daily inflection point:Which direction it goes on the inflection point is a guess, unless watching every timeframe to see the inflection points on the lower TF's develope in real time. Momentum shifts mark a point where momentum consolidates; from which it could break out or break down.When I start to see shifts on the smaller time frames, they tend to consolidate, and push thier final peaks of emotion (price peaks) until the larger time frames develope a shift and consolidates as well.My first chart uses a weekly inflection point/momentum shift and the keltner channel to determine that price would drop to 20k from 60k...Daily:See the daily channel we're in (green) we're at the top of the channel which I used the bottom line to create. If you look at the larger daily chart above, you can see how on the oscillator price makes a lower peak as mometum dies, but on the chart price has moved significantly higher. At some point price on the chart correlates with the price bar movements on the oscillator, a divergence... So daily has gone through this momentum consolidating cycle several times, creating a weekly divergence.The weekly is creating a new downward channel so if this all plays out on the 3 hour, then instead of a break out, there will be a breakdown, a correction. This is the formation of the potential correction.3 Hour:So I expect price to follow this channel down, with a few exceptions, color coded, price will likely consolidate in the boxed area, while the daily will show the area of breakdown or breakout (the mid KC line/keltner channel) If price ranges in the daily/weekly KC channel, and pulls it downward, then the weekly correction comes into play, as the daily correction will either result in 1 more leg before a larger correction, or is an abc/123 B wave leg of a larger ABC correction from 69k which then may go to 10-11k if C ends below A.1 Hour:Here the 1 hour is at a critical point for this to play out, if it breaks below the KC mid line, and stays below it, then the less likely it is for another breakout leg to form; signifying the emotional price peak before selling becomes dominate and price reverses trend.Otherwise we're winding up for another significant leg up to 58-59k.1 Hour UpdateStill consolidating on the 1 hour, but may approach 50k before reversing back down and continuing consolidation.Early, but adjustedSignificant momentum on the smaller timeframes from that move, so likely to move higher before consolidating on the 1 hour, but doesn't rule out the larger timeframes.unadjusted for reference1 hour is starting to consolidate, watching for any break outs when we get close to the mid KC line3 Hour: if we break 49.5 and hold below 50k, then the 3 hour will start to consolidate.Still haven't started consolidating on the 3 hour, but the 1 hour looks like it's breaking down below the mid KC line (20 ema)3 hour is near an inflection point1 hour - the 3 hour is starting to consolidate, there maybe a bounce and a leg up, however if not, then after some consolidation, I'll check the daily to see if it starts consolidating.The 3 hour fell out of the purple channel, and may start a bearish leg, after consolidating.DailyWe need to break below 47k to begin daily consolidation and hold in that range, breakdown further to confirm large consolidation phase.3 hour update: here's a couple potential paths from an inflection point.If we get another breakout leg, the height of which will determine if it's the beginning of a larger move upward, or mometum continuing to die down.I'd like to see price fall and stay below the 3 hour keltner channel mid line.Right now it could potentially just be consolidating before another move upward.1 Hour UpdateBitcoin popped up and was immediately rejected, so if the downward momentum starts with a breakdown in this area, then 3 hour consolidation will mean a larger move downward as we define a new range somewhere between here and 47k- further breakdown suggest daily breakdown opening up new targets... time will tell.3 hour:3 Hour: Not a whole lot has been happening, waiting to see if we go ahead and breakdown out of the daily channel here:So far it seems that way.Adjusted the weekly channel (moved the line, used same angle)So we never got to consolidate on the daily. Price broke out from the 3 hour consolidation and nearly hit 58k as predicted on feb 11th.Monthly and weekly momentum shifts are still in play assuming we don't gain any more momentum.Bitcoin will once again grind upwards, now with the halving coming up, however the end of march and april may bring about new conflicts, market issues, and may thwart the bullish sentiment.So here I posted the 3 hr and the daily, on the 3hr we're starting to consolidate, we could consolidate sideways for up to 2 weeks then attempt another leg up, I would project 72-74k if successful, 77k and 88k if for some reason there is lots of emotion tied to price.Else, I think we're still at a potential reversing point for a major correction. The market as a whole may correct, else gold and silver will take off. So I expect a major event in the last weeks of march or the first week of april.see previous comment1hr and dailyWe hit 74k as expected, now we're really starting to consolidate, the consolidation I wanted earlier, but things never really go the way you want them, they do what they're going to do.Here we have 1hr momentum shift, and also on the 15 minute, this marks the last leg up, which may make a new high or get rejected.After this there will be consolidation, and then potentially after the market "event" a massive crash.We need another breakout, to avoid breaking down. Daily consolidation, weekly consolidation cycle potential.Daily chart:The question begs, just what is going to happen april 8th? grid collapse? quakes? May the rays of light illuminate the darkness.Speculating...Maybe a massive sell off in bonds coming next 7 days; perhaps sparked by a banking crisis.I think yields will approach 6% on the 10yr fairly soon.🦢🦢🦢☢☢☢""After this there will be consolidation, and then potentially after the market "event" a massive crash.""feb 27th "Bitcoin will once again grind upwards, now with the halving coming up, however the end of march and april may bring about new conflicts, market issues, and may thwart the bullish sentiment."mar 7th "Else, I think we're still at a potential reversing point for a major correction. The market as a whole may correct, else gold and silver will take off. So I expect a major event in the last weeks of march or the first week of april."weekly channel in blue, green is daily1w1d1mTally-ho!Theres been a lot of interesting occurances, there is a short supply of transformers and a large region of sunspots creating the largest solar storm in 20 yearsThere has been an escalation of the ongoing conflicts in the ME with countries retaliating and attacking a US ally for escalating the conflict there.There was a contatiner ship the destroyed am important strategic port in the USThere are multiple ongoing economic problems caused by all these events and more, and leading up to these events. I think it's all apart of a multifacted war- as war goes beyond a battlefield these days.There will be continued escalations and problems as time goes on.For the record...About timeTLDRFeb 11 ...Which direction it goes on the inflection point is a guess, unless watching every timeframe to see the inflection points on the lower TF's develope in real time. Momentum shifts mark a point where momentum consolidates; from which it could break out or break down.When I start to see shifts on the smaller time frames, they tend to consolidate, and push thier final peaks of emotion (price peaks) until the larger time frames develope a shift and consolidates as well....If price ranges in the daily/weekly KC channel, and pulls it downward, then the weekly correction comes into play, as the daily correction will either result in 1 more leg before a larger correction......Here the 1 hour is at a critical point for this to play out, if it breaks below the KC mid line, and stays below it, then the less likely it is for another breakout leg to form; signifying the emotional price peak before selling becomes dominate and price reverses trend.Otherwise we're winding up for another significant leg up to 58-59k....Feb 27So we never got to consolidate on the daily. Price broke out from the 3 hour consolidation and nearly hit 58k as predicted on feb 11th.Monthly and weekly momentum shifts are still in play assuming we don't gain any more momentum.Bitcoin will once again grind upwards, now with the halving coming up, however the end of march and april may bring about new conflicts, market issues, and may thwart the bullish sentiment.Mar 7So here I posted the 3 hr and the daily, on the 3hr we're starting to consolidate, we could consolidate sideways for up to 2 weeks then attempt another leg up, I would project 72-74k if successful, 77k and 88k if for some reason there is lots of emotion tied to price.Else, I think we're still at a potential reversing point for a major correction. The market as a whole may correct, else gold and silver will take off. So I expect a major event in the last weeks of march or the first week of april.Weekly Correction In play my frensNow downward momentum is starting to build...We're at an inflection point on the daily chart. Breakdown here would spiral downward quickly.
BTCUSD Quickie 3hr

Here we have the beginnings of a momentum shift on the 3 hrHere we are on the daily. In breakdown territory (rotation zone), while there is hope it bullish breaks on the daily, it could also, breakdown in a bad way. I call these inflection points. Signaled by momentum shifts.So there are a combination of mometnum shifts that create an inflection point.Looking for a quick boom, or disaster to strike. I think bitcoin will lead the market and crash, then the market after the equinox will crash. Else something crazy will happen, covid 2.0, taiwan invasion, ww3, middle-eastern war...Potential rejection in the rotation zone, possibly headed to 38k.We're at the 3hr rotation zone now it's bounce or die.This is the Monthly Rotation zone in green.Bitcoin should consolidate and range down to 22k, after that it may break down below 16-13k or Breakup with a possible 5th wave.
AAPL Winding up for a Pump or Massive Drop - Inflection Point
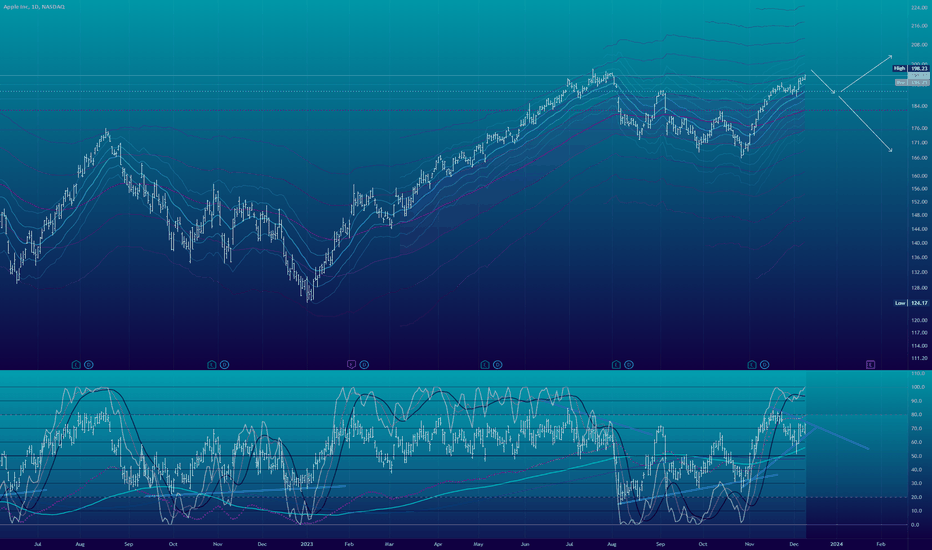
Within the next few quarters we're likely to see some impressive fireworks in the various markets around the world as we gear up for multiple black swan events IE negative oil prices. The storm isn't over, it's just begun. 3 Month Monthly Weekly Daily^ 3 Hour* whoops :) 3 Hour3 Hour Updatecould we potentially just be getting started?And I quote "Multiple black swan events""General Flynn Calls Baltimore Barge Disaster A Black Swan Event"🦢🦢🦢1 hourUh ohseems to be getting hot in here.Won't be long now.
BTCUSD - Potential Daily Inflection Point

This probably still needs time but we're approaching an inflection point, it may take another month or two to wind up, so I'll have to watch. Bitcoin has been popping up in it's low liquidity enviroment, and the MM is likely net short due to the influx of buyers. Since the market needs sellers, it's possible MM will push price down to get some liquidity.On the 1 hour, DXY is playing it's usual games, and bitcoin is hitting a momentum shift; looks like another short squeeze without any follow through.As DXY pushed up, bitcoin gets hammered back down. I made some trend lines on the keltner channel that gives me the momentum shift signals. Here is an earlier SS from last night:Current Daily: So I expect the resistance on the daily and dxy to push bitcoin back down into breakdown territory.If not then it could be a major breakout.Price had found a local top, and is going to retest the keltner channel mid line, from which it could breakout or breakdown.After a break to 35k everyone is in bullmode. Personally I have a feeling that this will end up coming right back to 28k, and consolidating, maybe it will spike higher, perhaps it will start dropping and increasing volatility right away.either way, there are more surprises around the corner.dailyoct 2nd and oct 22nd markedwe didn't hit the daily keltner channel mid line, but more agressively bounced off the 3 hour. (1 hour)😮😲😰😨😱Alright, momentum finally shifted back downward, and the move is correcting. Will take a while to see if it will go back up or straight down, If bond yields rise and dxy rises, then the correction should hold and commodities and bitcoin breakdown.As per my dec 11th analysis the fed ended up being dovish; while the next meeting is 18 days away and there is a 95% chance that rates will not change.The dovish fed led to yields dropping since dec update and bitcoin traded up front running the etf release. Since there has been a correction, I expect some weekly consolidation so after a drop to 38k, bitcoin might take a few more runs up before correcting significantly in march thanks to a "big surprize" to the world, and economies- PM markets, ect. Maybe everything will correct harshly at once. Whatever the case I will be watching march 23-25th and early april just in case a black swan appears.There will be no shortage of swans will there
Execute Order 666: BTCUSD The Final Collapse - Inflection Point

Here we continue the saga of the FTX fallout. Another dominoe in the collapse is falling. Bitcoin has broken a 4 hour momentum channel which appears to be the next leg to lower lows.This is the Daily version, since the 1 hour chart will not play for very long. 4 Hour Channel:I imagine if we don't breakdown at this point today, then it could draw out and consolidate near the 18k level for a few weeks before deciding to head down.Else we can watch for a potential bullish reversal. The CPI print suggest inflation is slowing, and a 25bps increase in interest might cause markets to push up a final time. (with bitcoin following) It's all BS though. The only thing good for the markets is a significant reduction in interest rates. Inflation is at an uncontrollable point (huge amount of money has been printed and is already out there slowly working the economy so that is can get the best advantage on prices) and interest on the debt is ludicrously large meaning taxes will have to increase. The fed putting debt on its balance sheet is simply delaying the inevitable. The dollar cannot be saved the markets are fully leveraged and anything could pop this debt bubble and start hyperinflation.Sound currency is the best, but bitcoin is like tulips. It does well in a inflationary, but growing market. A stagflationary market is horrible for bitcoin unless it can pay the bills and hold its value well. A gold backed digital currecy will rise and likely the chinese will develope it, competing currencies will fight for global domination and whomever is in control of it becomes king of the nwo.The government of currency is the most powerful government.This is not financial advice.And what a bull trap.1 hour has formed a momentum shift, top/4 hour is headed to retest the bottom of the channel after rejecting the top.Seems they're going to continue to shrink the markets to protect the dollar and keep demand low by continuing to raise interest rates by 50bpsExplains the blow off top instead of consolidating.4 hour channel is breaking down again:The hour found a temporary bottom, hopefully it either consolidates or heads down lower from here to confirm the channel breakdown on the 4 hour inflection point.4 hour channel looks like it's about confirmed. Expecting price to build downward momentum and start heading down quickly. Consolidation isn't ideal, I want to see some action.potential momentum shift on the 4 hour is forming, sometimes these continue to breakdown and start to move pretty quickly. If it starts consolidating, then I will look for a retest of 18k.signs of a momentum shift on the hourly chart, may result in a restest of the previous highs.looking for the next daily candle 19-20 hours to close bullish for this play out.a rejection here would be a disaster for bitcoin.every 4 hour candle closed below the previous daily close.not looking good for the bulls.you know some times being this good is scary.alright that looks like the last move, momentum is shifting back down, good chance for price to reverse trend here.If you zoom out of my chart; you can see I've been waiting for a retrace for a while, I pointed out two TZ's transient zones that were created on the way down, these are potential targets for a retrace and reversal back down. lets say bitcoin heads back to 25-30k; this makes sense since fed intervention should prevent a sudden collapse; so prospects may allow price to retrace for 3-5 months, and at some point head back down before the rest of the markets.Amazingly FTX has come up with some money that was stolen from investors, so will have to see how this all plays out.Anyways, this is just an opinion and should not be construed as financial advice.Price momentum is pretty strong, so if it were to move up it wouldn't be surprizing.there are some potential shifts back down; and the TZ's just created will at least provide and entry to ride this to 25k and look for the shift back down in that range.otherwise sometimes bitcoin just does bitcoin and reverses suddenly and unexpectedlyThe 15 min is showing a potential shift back down; if that holds, then the 4 hour's shift might play out, meaning the start of the next bearish leg down.The 4 hour had a fairly decent sell signal, momentum shift.Going to watch and see if it plays out, but this maybe when things start to finally get some momentum.Else I'm watching for a reversal at the transient zones created on the way down.Right on the cusp the verge the edge of breaking out. Will this play out?this might finally be the reversal, or atleast a decent retrace.We didn't break down on the 24th, but we rejected a breakout. The momentum shift is still in play, and I've been watching the 15min and made a prediction like 6 hours ago.So if we can get a little momentum downward we'll retest 18k.So here is the 1 hour, price lost a significant amount of momtenum, I think its more likely to swing and retest 18k before trying to test 24-25k. If it carries through 18k with lots of downward momentum, then we're starting the next large leg down.I like it.slight possibility it could tap the 25k level, but it likely will hit the 18k transient zones, in a rotation zone right now.The daily is starting to breakdown, but the 1 hour is trying to find a bottom. If it consolidates, then thats good for the bulls. For the bears I want to see a breakout breakdown in this zone.So I checked out the bitcoin/gold chart to see if the transient zone targets hold up on a chart that is not skewed by inflation. What I outlined is some low targets formed 7-9 years ago, and found that a few of the zones the 25k target is not a transient zone on the gold chart. There is a small zone that on a large timeframe doesn't hold up. Around the 30k level. So, the primary transient zones are below the current price level.These zones are areas where price briefly traveled and did not return.Price action is mostly recurrent, as in it passes back and fourth in an area and never really leaving bars alone, price gets boxed into areas where large traders continulously bet at two price levels and bounce price between the two and trade others out of thier positions.the blue line was a transient zone, the 13k-15k area on the usd chart. On the daily usd chart, the 18-19.2k area is still a target, maybe it will reverse and retest the iffy upper transient zone.So bearish targets are as low as .94 oz xau to 2.55 oz xau or 1500-5000 USDOh yeah, how could I forget to provide an updated 2 hr usd chartit broke down within 1-2 hours of my call for the bearish breakdown.daily breakdownI updated all the transient zones with the latest info posted here and a few more details.I like the big break on the daily, and I expect a decent amount of follow through with consolidation being likely before it decides to go lower.If it breaks with a lot of momentum, then the larger transient zones on the monthly charts come into play, I expect 5-10k soon, then eventually 1500-5k.I made an alternative count in orange, with my original in yellow.This momentum shift appears to be a very strong signal with multiple timeframes.The reversal here marks the elimination of the final TZ remaining from the bear leg the past 6-12mos.Now the primary TZ's other than the Top, are below current prices.Now there is still a chance for a reversal at these TZ's to create a final "5th wave" for bitcoins macro price structure.I still think fundamentals wont allow for this leg, and a poor economy and failing dollar will lead to people putting thier money into more important items. As thier purchasing power will be absent for the most part. I can imagine something like mexico where the dollar loses significant value overnight, if a "bail in" occurs there wont be individuals able to even buy bitcoin. If you can sell it, you might have to in over to cover soaring food prices.World leaders, the wealthy, how much interest do they really have in bitcoin when governments create thier own currencies; chinas working on gold backed digital currency, how can bitcoin compete? Especially since the government(s) has a motivation to control currency, and regulate competition out of existenceIf there is a new global currency; central banks would not allow something to replace thier power structure unless they can or do control it, and thusly incorporate it into thier system and negating the original purpose of bitcoin.The government of governments is money.This is not financial advice.Now that's a nice looking bar. Mmmmm.Just a little further :)Alright well bitcoin managed another leg up to 30k and hit some key levels.Now that those targets are hit; bitcoin is still in a reversal zone and isn't in bull territory yet.Gold is pulling back, the market is pulling back and the fed isn't dovish quite yet.The dollar is being abandoned, so demand for dollars will implode and they will come rushing back to the united states. However that may take a while to play out. So at least in the mean time during this "recession" bitcoin will drop back down and retest some lower levels.If there is a large amount of momentum, then another bearish leg will start.I currently see gold and oil rising- doubling in price...However I doubt bitcoin is going to follow... not untill there is no gold for sale...Send It.wait for the other shoe to drop
XAUUSD Gold to 4K

Timeline is 6 months - 2 years The crash has already started. At some point everyone will start to sell thier treasury bonds, yields will go up proportionally to inflation until the dollar loses it's status as the global currency and dramatic measures are used to stop inflation resulting in stagflation and yield recovery. Else hyper inflation and the dollar is replaced entirely.I see the momentum indicators shifting in various markets. Below is a brief summary of each, relevant indicators/markets. see charts.US1YRBILLSWTI CRUDESILVERUSDBONKCOINTSLALooking for up to 4 months of retracement then in june the potential start of the bull run to 4k.if the dollar actually last this long *I like gold. :)Now do you believe?Send It.☺☺☺😃😃😃✝🦢🦢🦢UPDATE I love golddd 1 day1 hourIs it finally time?
Execute Order 666: BTCUSD The Final Collapse

Bitcoin at a critical juncture in our lives. A tiny dominoe is about to collapse the house of cards.Was it all by design? Is the math sound? Does a fiat collapse in the woods make a depression?Come with me down to the depths of sound insanity.The 1 hour had shifted. The recovery is over. In the next 6 months you will begin to understand The Final Collapse.*Delay of launch**Flight departing*might just be a dead cat bounce to flush out shorts1hr is potentially shifting again, so if the momentum doesn't continue then a reversal is highly likely.there is a transient zone that has been pulling price action up to revisit the 17567.45 levelJust gotta keep up the downward momentum and we'll be on our way.Getting tigghttttt.15 min is showing a potential shift back up, but 5 min is looking like it's exhausted, so I'm leaning intoa breakdown on the 1 hour here to start the leg back down to retest lows.This is the 15 minThe 5 I just noticed the pattern I saw on the 15min, we need a bullish breakout here to tighten the pattern on the 1 hour more, we could get a breakdown here.The 1 hour tightened, tried to breakout and was rejected back down.I like this configuration, its a larger signal on the 1 hour of the momentum shift back down.This looks like downward momentum is going to start building again.I'll be on the lookout for a reversal back up.A closer look at this 15 min rally:had a 15 min top, that made a larger 1hr momentum shift down, was followed by a 15 min bottom, that is the current rally you see here.I'm looking for this to reverse back down, with the 1 hr shift on the large Time Frame.Perhaps something like this on the 5 minute: this could try to get to the transient zone at 17,5 stillprice action is fairly random.15 min1 hourhere we can see a channel the 4 hour is inthere was a larger shift up on the 4 hr, but where the 1 hour had a shift, is also showing up on the 4hr, so I'm leaning towards another leg down before a large long correction back up, then potentially another leg back down to lower lows.More or less something like this on the weekly:15 min update1 hour update5 min rolling over, lots of sideways...15 min targets1 hour targets4 hour targetsdaily targetsweekly targets15 minute is forming a potential momentum shift.the 15 min signal failed to form, but today resulted in the 1 hour creating a signal...finally the 1 hour signal played out and the 4 hour channel is breaking down.potential shift on the 15 min:either we'll breakout and try to hit the transient zone above, or the large leg down will finally start.Need to continue to breakdown to confirm 15 min toptransient zone was finally hit and the breakdown averted for now.its still in dangerous territory and hasn't started the bullish reversal yet,switching updates to this chart ^updated chart ^^^^^^^^updated chartSo I checked out the bitcoin/gold chart to see if the transient zone targets hold up on a chart that is not skewed by inflation. What I outlined is some low targets formed 7-9 years ago, and found that a few of the zones the 25k target is not a transient zone on the gold chart. There is a small zone that on a large timeframe doesn't hold up. Around the 30k level. So, the primary transient zones are below the current price level.These zones are areas where price briefly traveled and did not return.Price action is mostly recurrent, as in it passes back and fourth in an area and never really leaving bars alone, price gets boxed into areas where large traders continulously bet at two price levels and bounce price between the two and trade others out of thier positions.
BTCUSD 1 Hour - Slow and Certain Breakdown. 11/13/22

Indicators are signaling a breakdown for some time, and now momentum is building, fate has been decided.20K target was reached from my dec 2021 analysis. Every target hit this year.Next up is domino contagion now that everyone has realised the crypto sphere is built on lies.FTheXWe have reserves, against 9x liabilities, in order to profit and extract from the market with user funds, while simultaneously getting exposed to financial instruments used to prop up the institutions that is keeping you under control.Bitcoin was the greatest bait and switch, built by the Seeing Eye Eh?Instead of granting you freedom it used you to finance the next step to slavery.I swear to lick the hands that spare me and grant me small comforts after taking everything away by limiting said choices in this game to pathways to nowhere. You can't win if there is no pathway to success; if there is no free market of ideas; there is only an illusion you can win.100%June:you can see how the same pattern is starting to play out again.June 4 Hour:4 Hour Present:Buy signal on 15 min resulted in a retrace back up, but looks like it will soon roll back over, a 15 min sell signal has followed and now looking for the follow through.A lil MM stop hunting.fake out, and back into reversal territory.15 looking week, expect 1 hour to start shifting downwards.I'd be surprised if this got any tighter:1 hour is rotating, that was a nice try bulls, very good.trading is easy when you know what to look for
Disclaimer
Any content and materials included in Sahmeto's website and official communication channels are a compilation of personal opinions and analyses and are not binding. They do not constitute any recommendation for buying, selling, entering or exiting the stock market and cryptocurrency market. Also, all news and analyses included in the website and channels are merely republished information from official and unofficial domestic and foreign sources, and it is obvious that users of the said content are responsible for following up and ensuring the authenticity and accuracy of the materials. Therefore, while disclaiming responsibility, it is declared that the responsibility for any decision-making, action, and potential profit and loss in the capital market and cryptocurrency market lies with the trader.