
MiddleEastTradingAcademy
@t_MiddleEastTradingAcademy

What symbols does the trader recommend buying?
Purchase History
پیام های تریدر
Filter
MiddleEastTradingAcademy
فرصت خرید سویی برای SUI: استراتژی DCA و اهداف بزرگ تا 5 دلار!
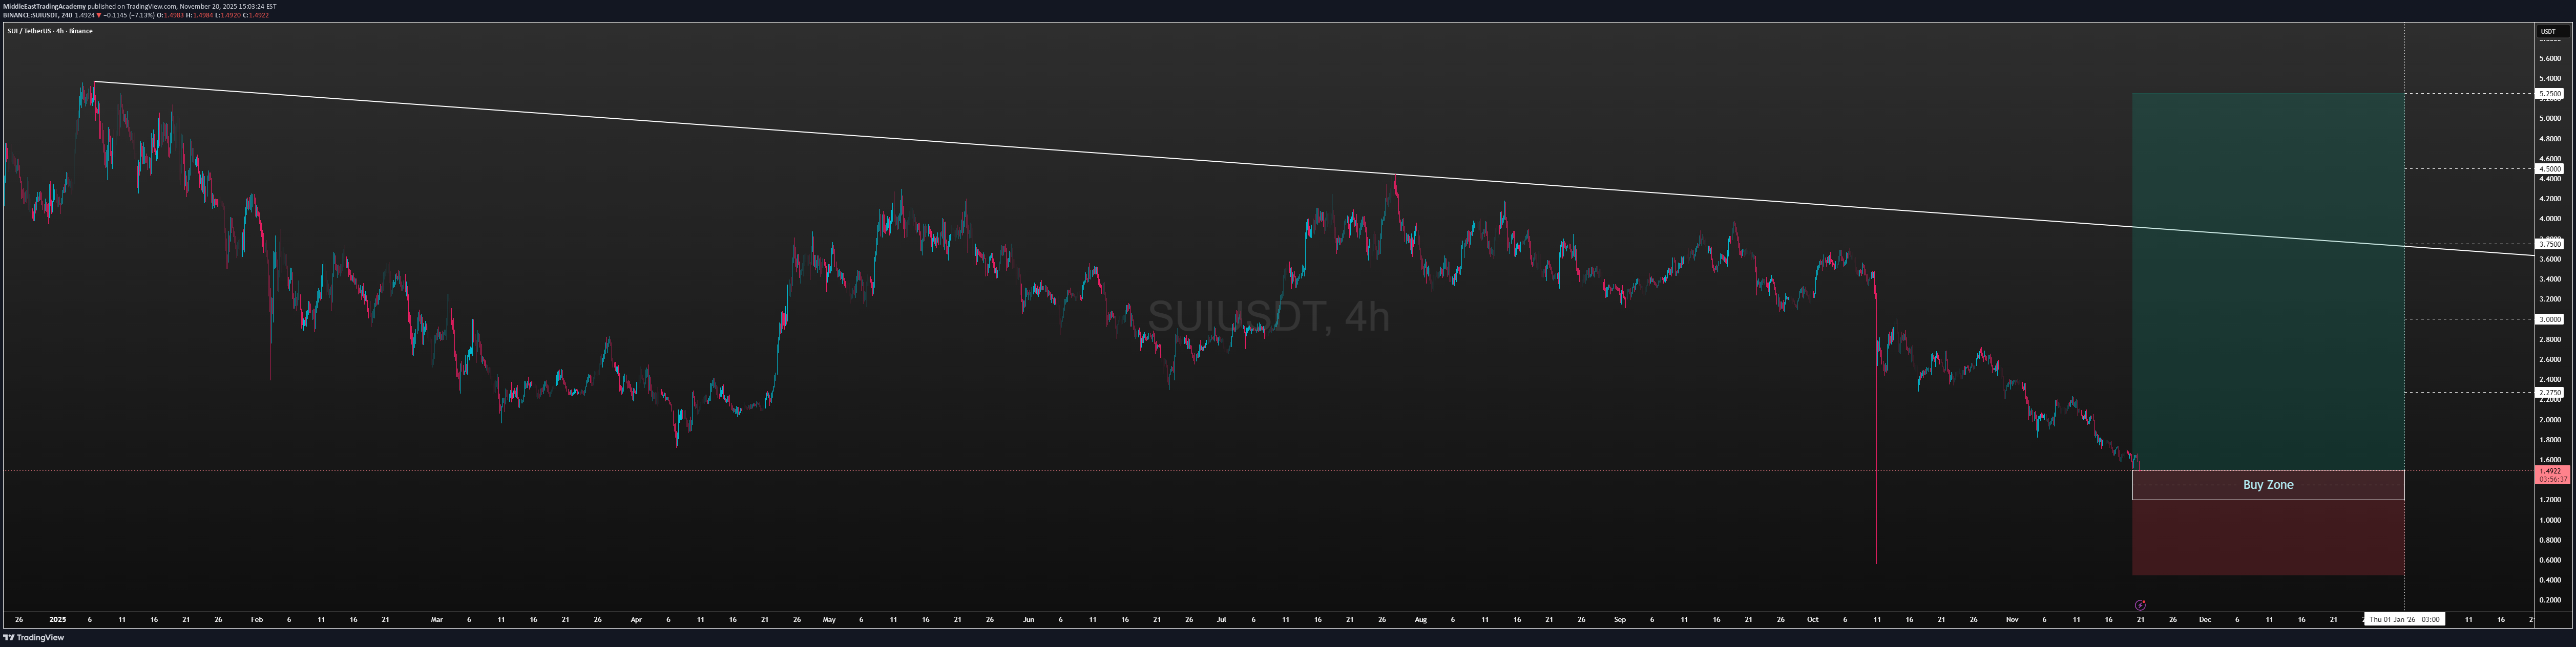
📌 Buy Zone (DCA Strategy) I’m planning to accumulate SUI inside the 1.50 – 1.20 USD demand zone using a DCA structure: Entry 1: 1.50 Entry 2: 1.40 Entry 3: 1.30 (DCA helps average the entry during volatility inside the zone.) ⛔ Stop Loss Weekly candle close below 1.20 USD A confirmed weekly breakdown invalidates the bullish swing structure. 🎯 Targets (Swing Outlook) TP1: 2.2750 TP2: 3.0000 TP3: 3.7500 TP4: 4.5000 TP5: 5.2500 These targets align with major liquidity levels and structural resistance zones on the higher timeframes. ⚙️ Trade Management This is a swing trade, not a day trade. Partial take-profit at each target is recommended. Move stop-loss to breakeven after reaching TP1 (2.2750). Strict risk management is essential due to the weekly stop-loss structure. ⚠️ Disclaimer This plan reflects my personal analysis and execution style. It is not financial advice, and each trader should manage risk according to their own strategy.Update on the SUIUSDT Swing Buy Idea Price has activated the first two DCA entries at 1.50 and 1.40. After entry, SUI dropped toward 1.32, but did not reach the third DCA level at 1.30, so the 1.30 order remains pending. We are now trading back around 1.40, and the plan is updated as follows: ✔️ Position Management 1) Entry @ 1.50 Price is approaching the original entry again. ➡️ If SUI returns to 1.50, this position will be closed at breakeven. 2) Entry @ 1.40 This position remains active. ➡️ If the price drops again to 1.30, we will activate the third DCA order. ➡️ If price later returns to 1.40, this position will be closed at breakeven while maintaining the lower entry. 3) Pending Entry @ 1.30 Still waiting to be filled. If filled, it will become the main active position in the setup. 🎯 Targets (unchanged) 2.2750 3.00 3.75 4.50 5.25 Targets remain the same as long as the weekly structure holds. ⛔ Stop Loss (unchanged) Weekly candle close below 1.20 USD This invalidates the swing structure. ⚠️ Disclaimer This update reflects my personal trade management approach for educational purposes only.
MiddleEastTradingAcademy
تحلیل تکنیکال VET/USDT: استراتژی خرید سوئینگ و اهداف قیمتی جذاب!

🎯 Buy Zone (DCA Structure) I’m planning to enter VET in the 0.013 – 0.011 accumulation zone using a DCA approach: 1st entry: 0.013 2nd entry: 0.012 3rd entry: 0.011 Since price is currently trading close to 0.013, I prefer taking the first entry around 0.01320 – 0.01325 only if we see clear bullish reversal candles and positive closes on the lower timeframes. ⛔ Stop Loss Weekly candle close below 0.011 A confirmed weekly breakdown invalidates the swing structure entirely. 🎯 Targets (Swing Structure) TP1: 0.020 TP2: 0.027 – 0.034 TP3: 0.041 – 0.048 These levels represent key structural break zones + liquidity pockets. Partial take-profits are recommended at each level. ⚙️ Trade Management This is a swing trade, not a scalp. Strict money management is required. Take partial profits at each target. Once TP1 (0.020) is hit → Move stop loss to breakeven (BE). Let remaining positions run toward higher structural targets. ⚠️ Disclaimer This plan reflects my personal analysis and execution approach. It’s not financial advice, and everyone should manage their own risk based on their strategy and risk tolerance.Update on the VETUSDT Swing Buy Idea Price has reached the first DCA entry at 0.013, activating only the initial position of the setup. After entry, VET briefly dipped toward 0.01250, but has now recovered back to the 0.013 zone. At this stage: ✔️ Active Position Entry 1 @ 0.013 → Active and holding. ✔️ No Changes to Plan The second and third DCA entries (0.012 and 0.011) remain pending. Stop-loss is still unchanged: Weekly close below 0.011. Targets remain as originally published: 0.020 – 0.027–0.034 – 0.041–0.048 Market structure is still aligned with the swing outlook, and the recovery back to 0.013 maintains the integrity of the setup. ⚠️ Disclaimer This update reflects my personal swing-trade management approach for educational purposes only.
MiddleEastTradingAcademy
بیت کوین در آستانه صعود بزرگ؟ استراتژی خرید ارزشمند در محدوده 83 تا 87 هزار دلار!
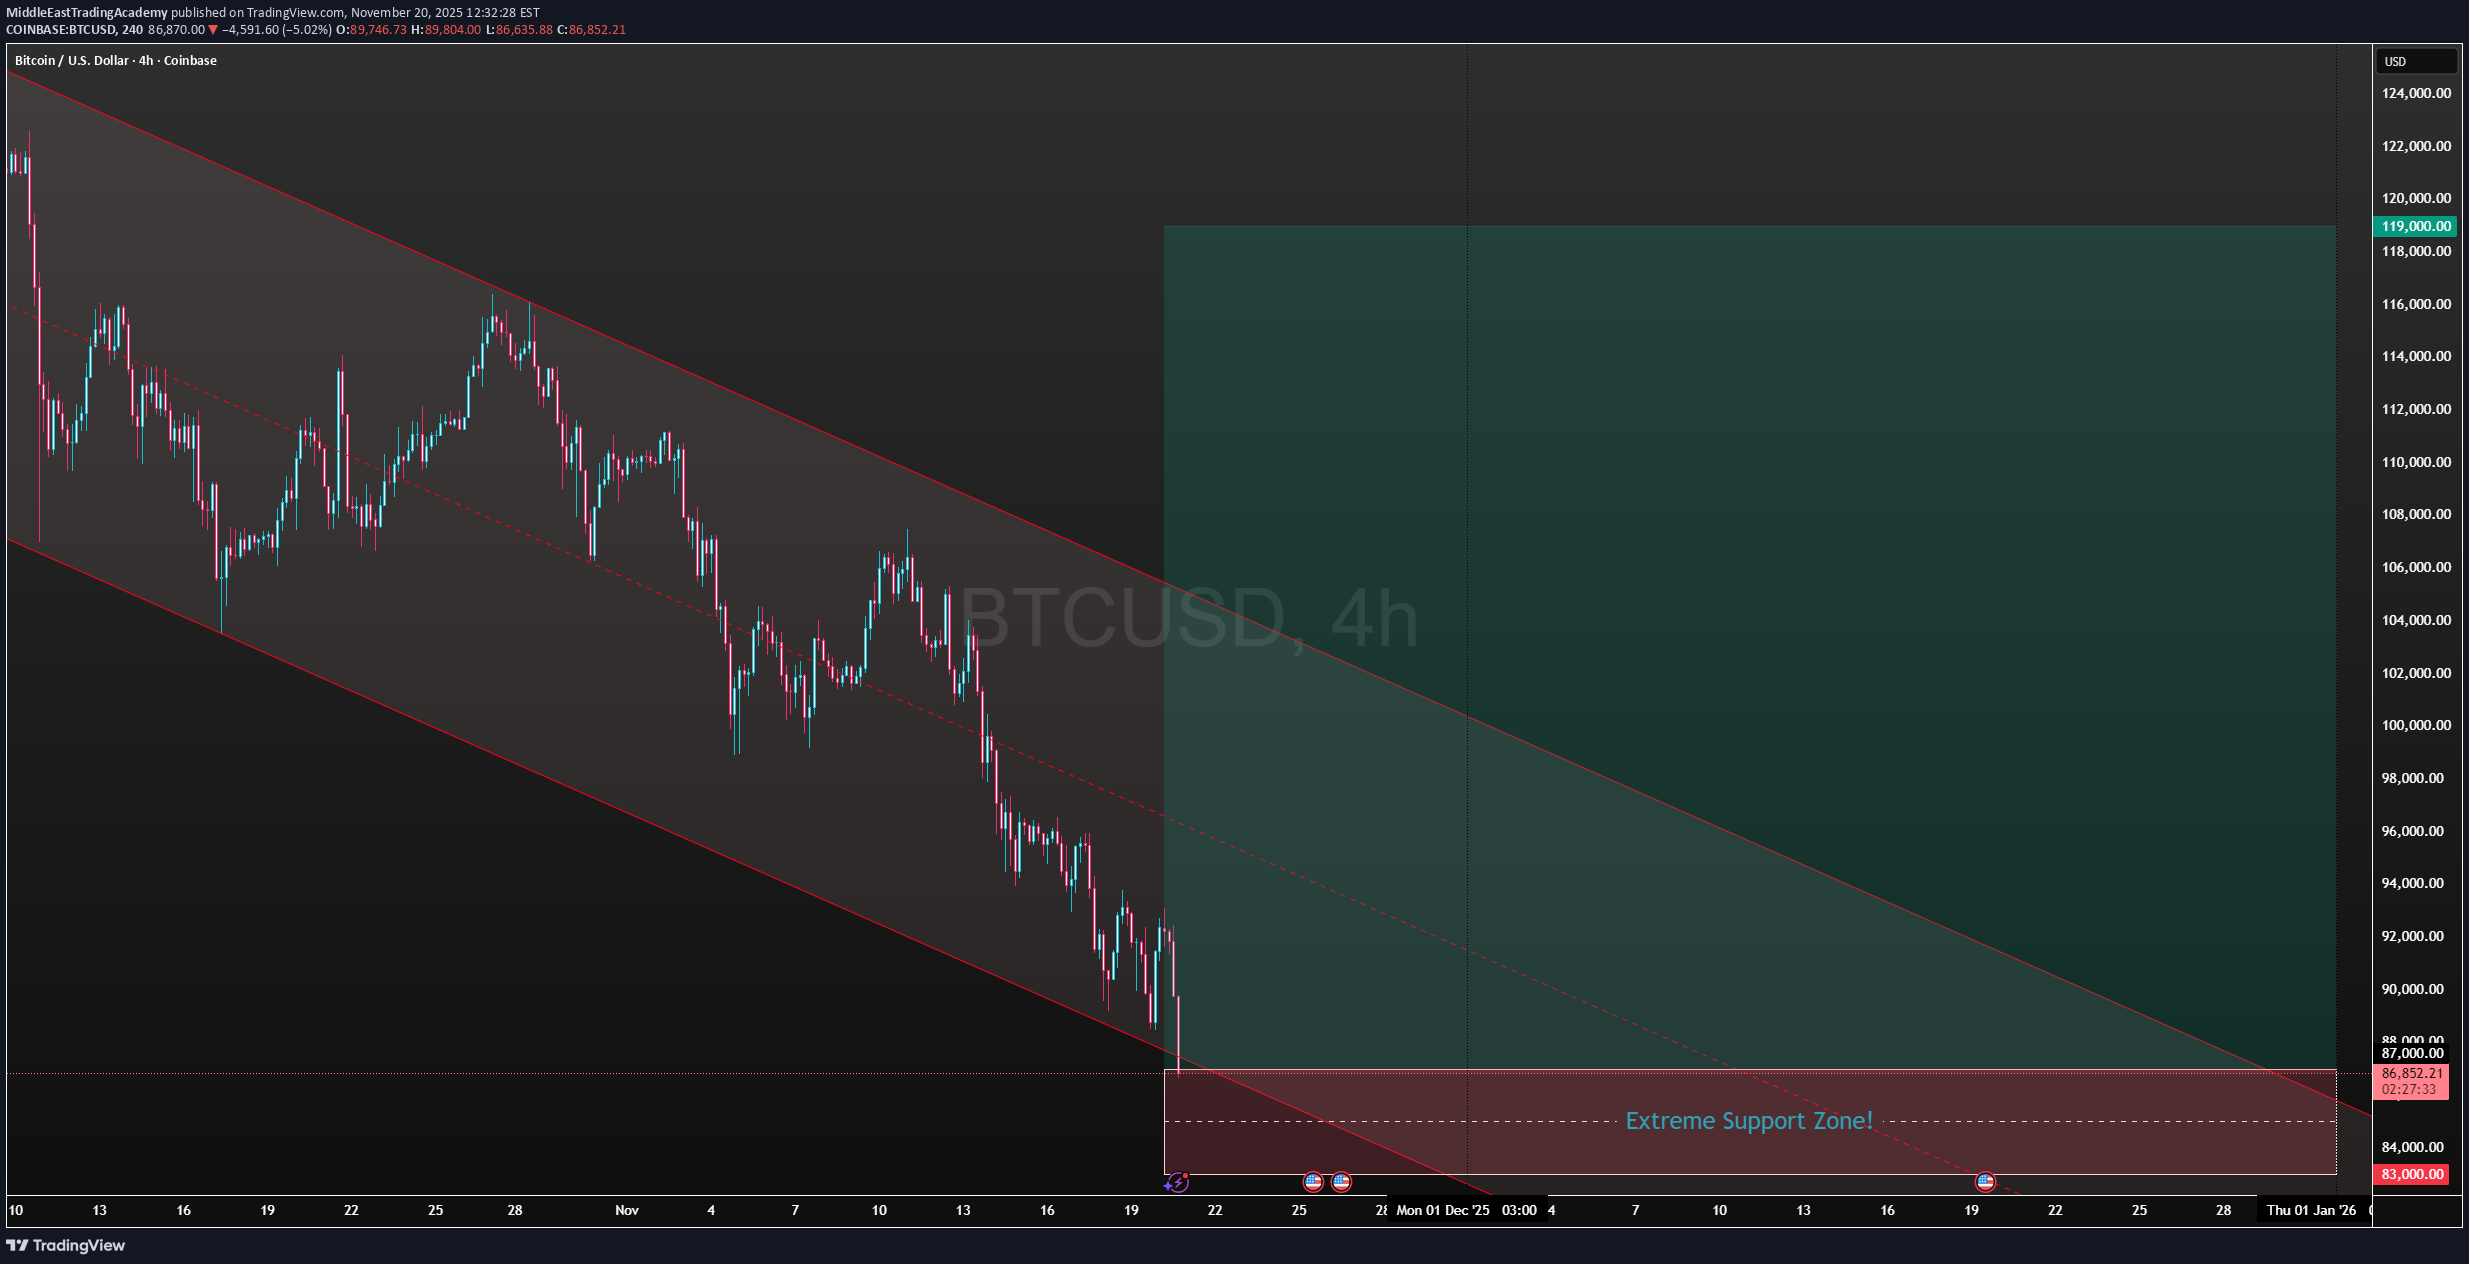
📌 Market Context Bitcoin is approaching a major long-term demand zone between 87,000 – 83,000 USD, which historically represents a strong accumulation range for medium-term investors. As long as weekly candles remain above 83,000 USD, the bullish macro outlook remains intact. 🎯 Buy Zone (DCA Approach) You may distribute entries in either structure: Option 1: 87,000 85,000 83,000 Option 2: 86,000 84,000 82,000 (Both methods follow the same logic: staggered accumulation inside the broader 87–83 zone.) ⛔ Stop Loss Weekly candle close below 83,000 USD. A confirmed weekly breakdown invalidates the long-term bullish structure. 🎯 Targets (Investment-Based) Each target represents a partial take-profit zone as Bitcoin recovers from the accumulation range: TP1: 91,000 TP2: 95,000 TP3: 99,000 TP4: 103,000 TP5: 107,000 TP6: 111,000 TP7: 115,000 TP8: 119,000 ⚙️ Trade Management Use DCA across the buy zone to reduce average entry. Scale out gradually at each target. You may move the stop loss to breakeven only after a strong structural recovery above 91,000–95,000. This setup is designed for investment, not short-term trading. ⚠️ Disclaimer This idea is for educational purposes only and does not constitute financial advice. Trading and investing in crypto markets carries significant risk. Always use proper risk management.Update on the BTCUSD Investment Idea Price moved down and activated all three DCA entries at 86,000 – 84,000 – 82,000. After touching the 82k zone, BTC has now retraced back toward 84,000. Based on risk management rules for this investment model, the positions are updated as follows: 1) 84,000 Entry Price returned to the entry level. ➡️ Position closed at breakeven. 2) 86,000 Entry Target for this position is now adjusted to breakeven. ➡️ If price revisits 86,000, the position will be closed flat. 3) 82,000 Entry (Main Active Position) This becomes the only active position in the setup. Management continues as per the original plan with targets unchanged. Summary 84k → closed at breakeven 86k → breakeven target 82k → main active position continuing toward the original targets This update maintains the overall investment structure while reducing exposure and protecting capital after the recent volatility. ⚠️ Disclaimer This update reflects my personal trade management approach for educational purposes only.
MiddleEastTradingAcademy
آموزش فروش طلا (XAUUSD): استراتژی معامله در منطقه مقاومت حیاتی
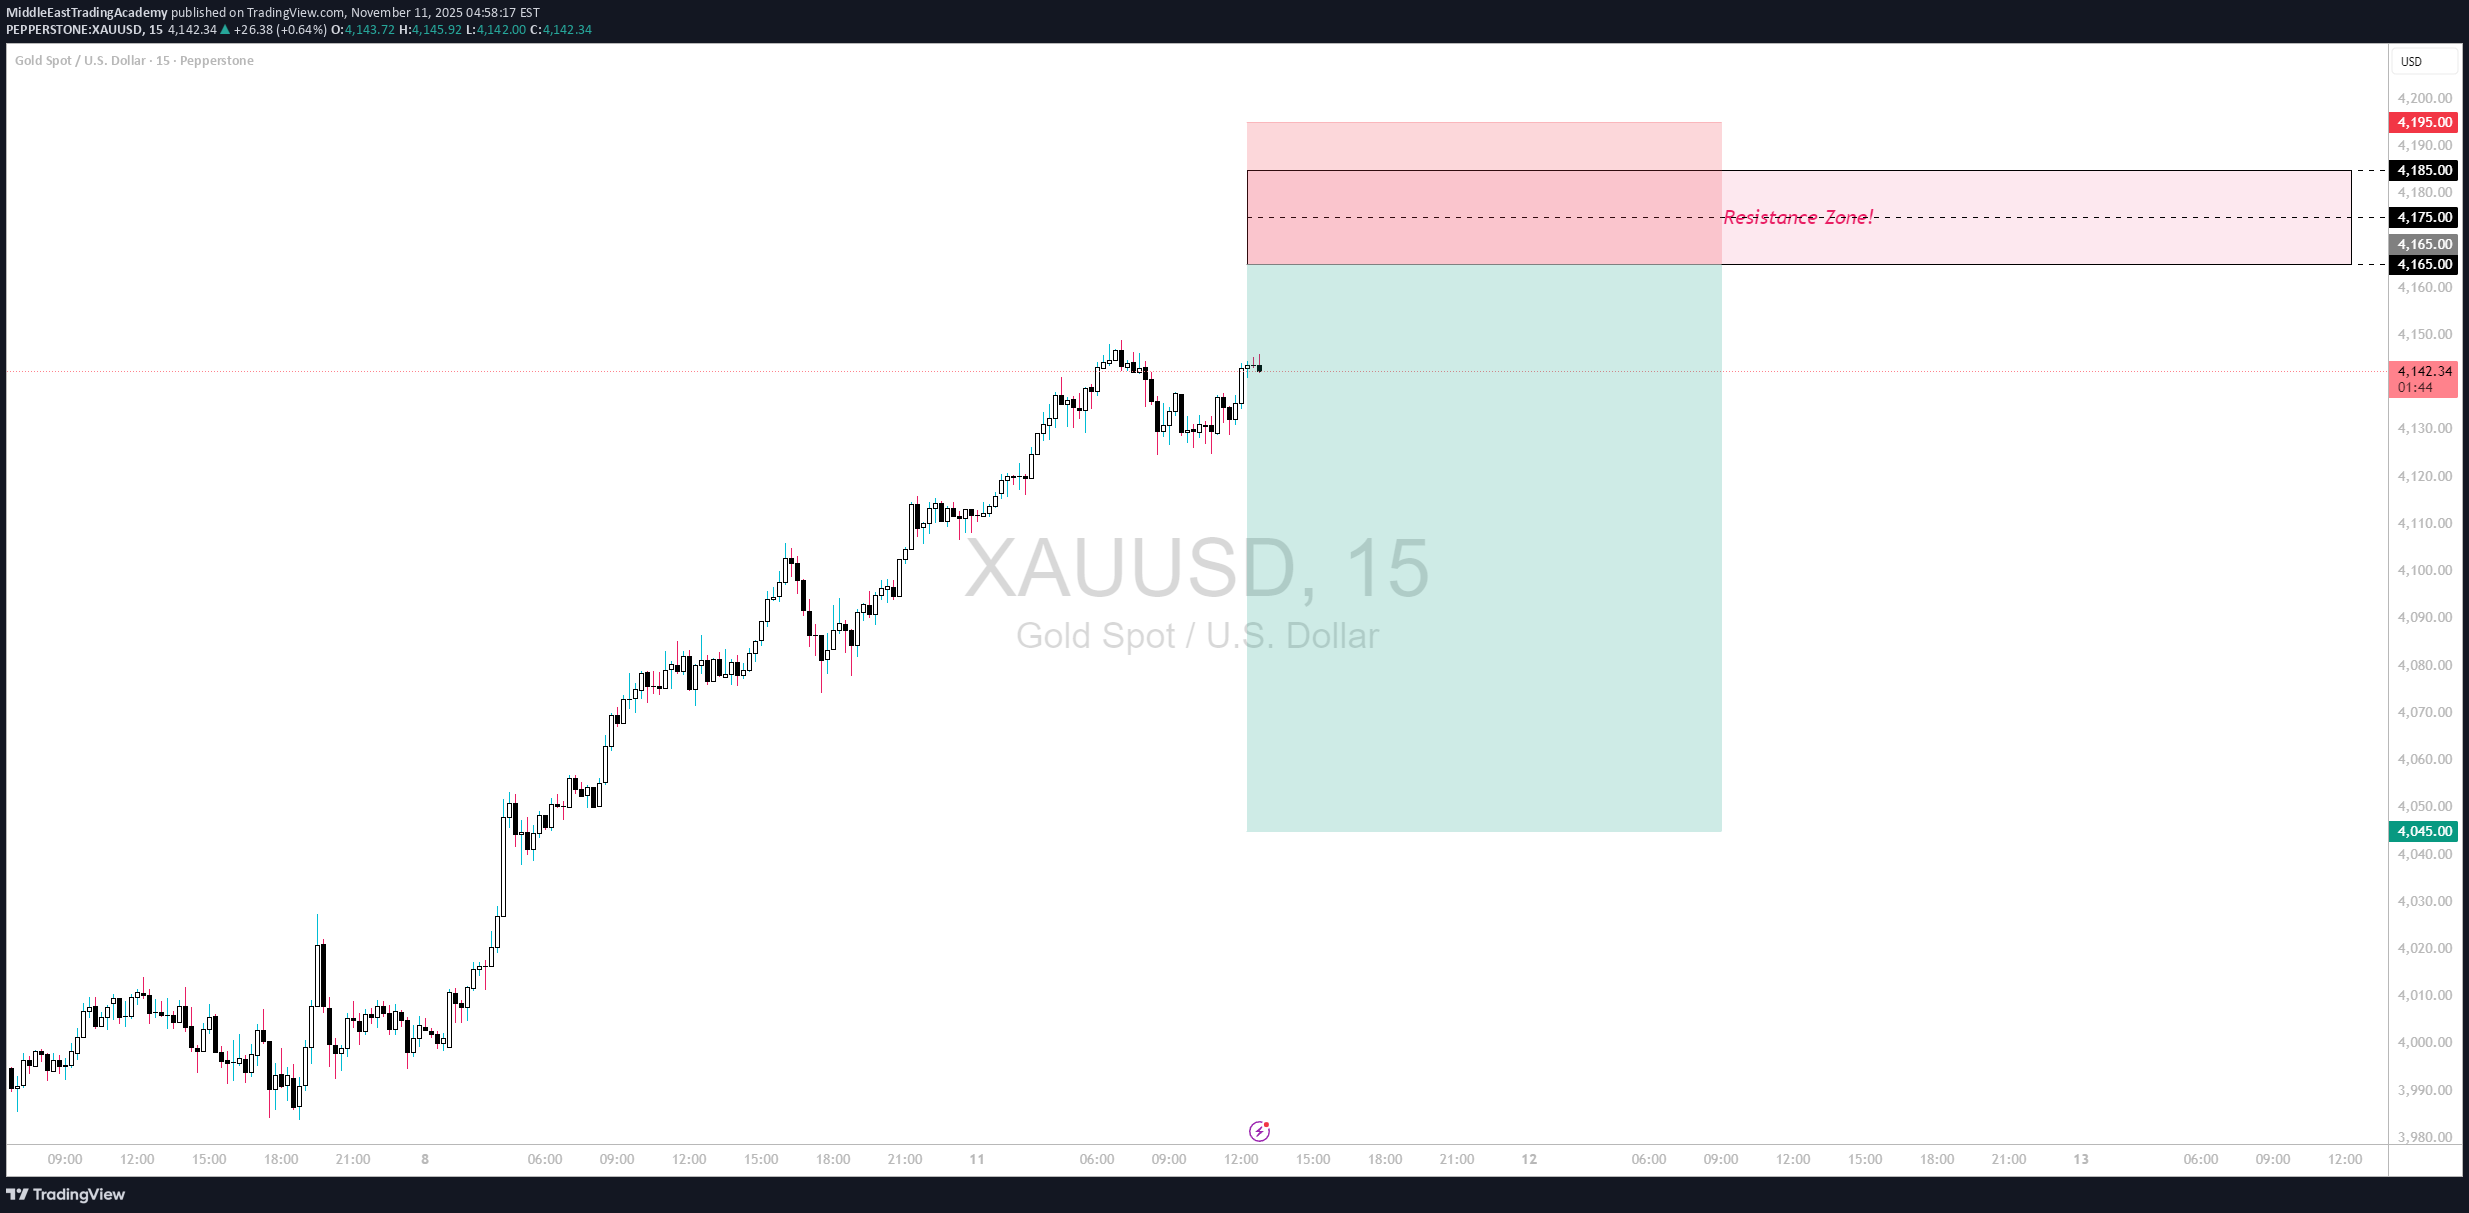
Gold is currently approaching a major resistance area around 4165 – 4185, a level that has repeatedly acted as a short-term supply zone in recent sessions. This region remains crucial for determining the next directional move — whether price confirms rejection or breaks through toward higher targets. We are closely monitoring this zone for bearish reversal confirmation, preferably a bearish engulfing candle or any strong rejection structure on the 4H or 1H timeframe. Once a clear reversal candle forms, short positions may be considered with strict money and risk management. 📊 Trade Overview Type: Educational Sell Setup Entry Zone: 4165 – 4185 (confirmation required) Stop Loss: 4195 (4H candle close above) Setup Context: Price testing resistance; potential corrective move expected upon rejection. 🎯 Target Map (Risk–Reward Structure) (SL: 4195) EntryRisk ($)TP1 (1:1)TP2 (1:2)TP3 (1:3)TP4 (1:4)TP5 (Extended)R:R Ratio 4165 30 4135 4105 4075 4045 — 1 : 4 4175 20 4155 4135 4115 4095 4045 1 : 6.5 4185 10 4175 4165 4155 4145 4045 1 : 14 Each position is managed independently. Partial profits are taken at each milestone (1:1, 1:2, 1:3, 1:4), and stop-loss is moved to break-even after TP1 is reached. Remaining exposure may target the extended level at $4045 if bearish momentum continues. ⚙️ Trade Management Rules 1:1 (First Target): Partial profit + move SL to entry. 1:2 and 1:3: Gradually reduce exposure while protecting capital. 1:4: Full closure unless strong momentum remains. Extended TP5 (1:6.5–1:14): Optional trailing continuation only under sustained bearish structure. 📈 Technical Notes The 4165–4185 range is a confirmed supply area on the 4H structure. 4H close above 4195 invalidates this setup and shifts bias toward 4205 → 4285. Rejection within this resistance zone keeps the short bias valid toward 4045 as an extended target. ⚠️ Disclaimer: This analysis is for educational and informational purposes only and does not constitute financial advice. All entries, targets, and risk parameters are provided for learning purposes within structured trading frameworks.
MiddleEastTradingAcademy
تحلیل طلای جهانی (XAUUSD): طلا در آستانه انفجار صعودی! سطوح کلیدی ۴ ساعته
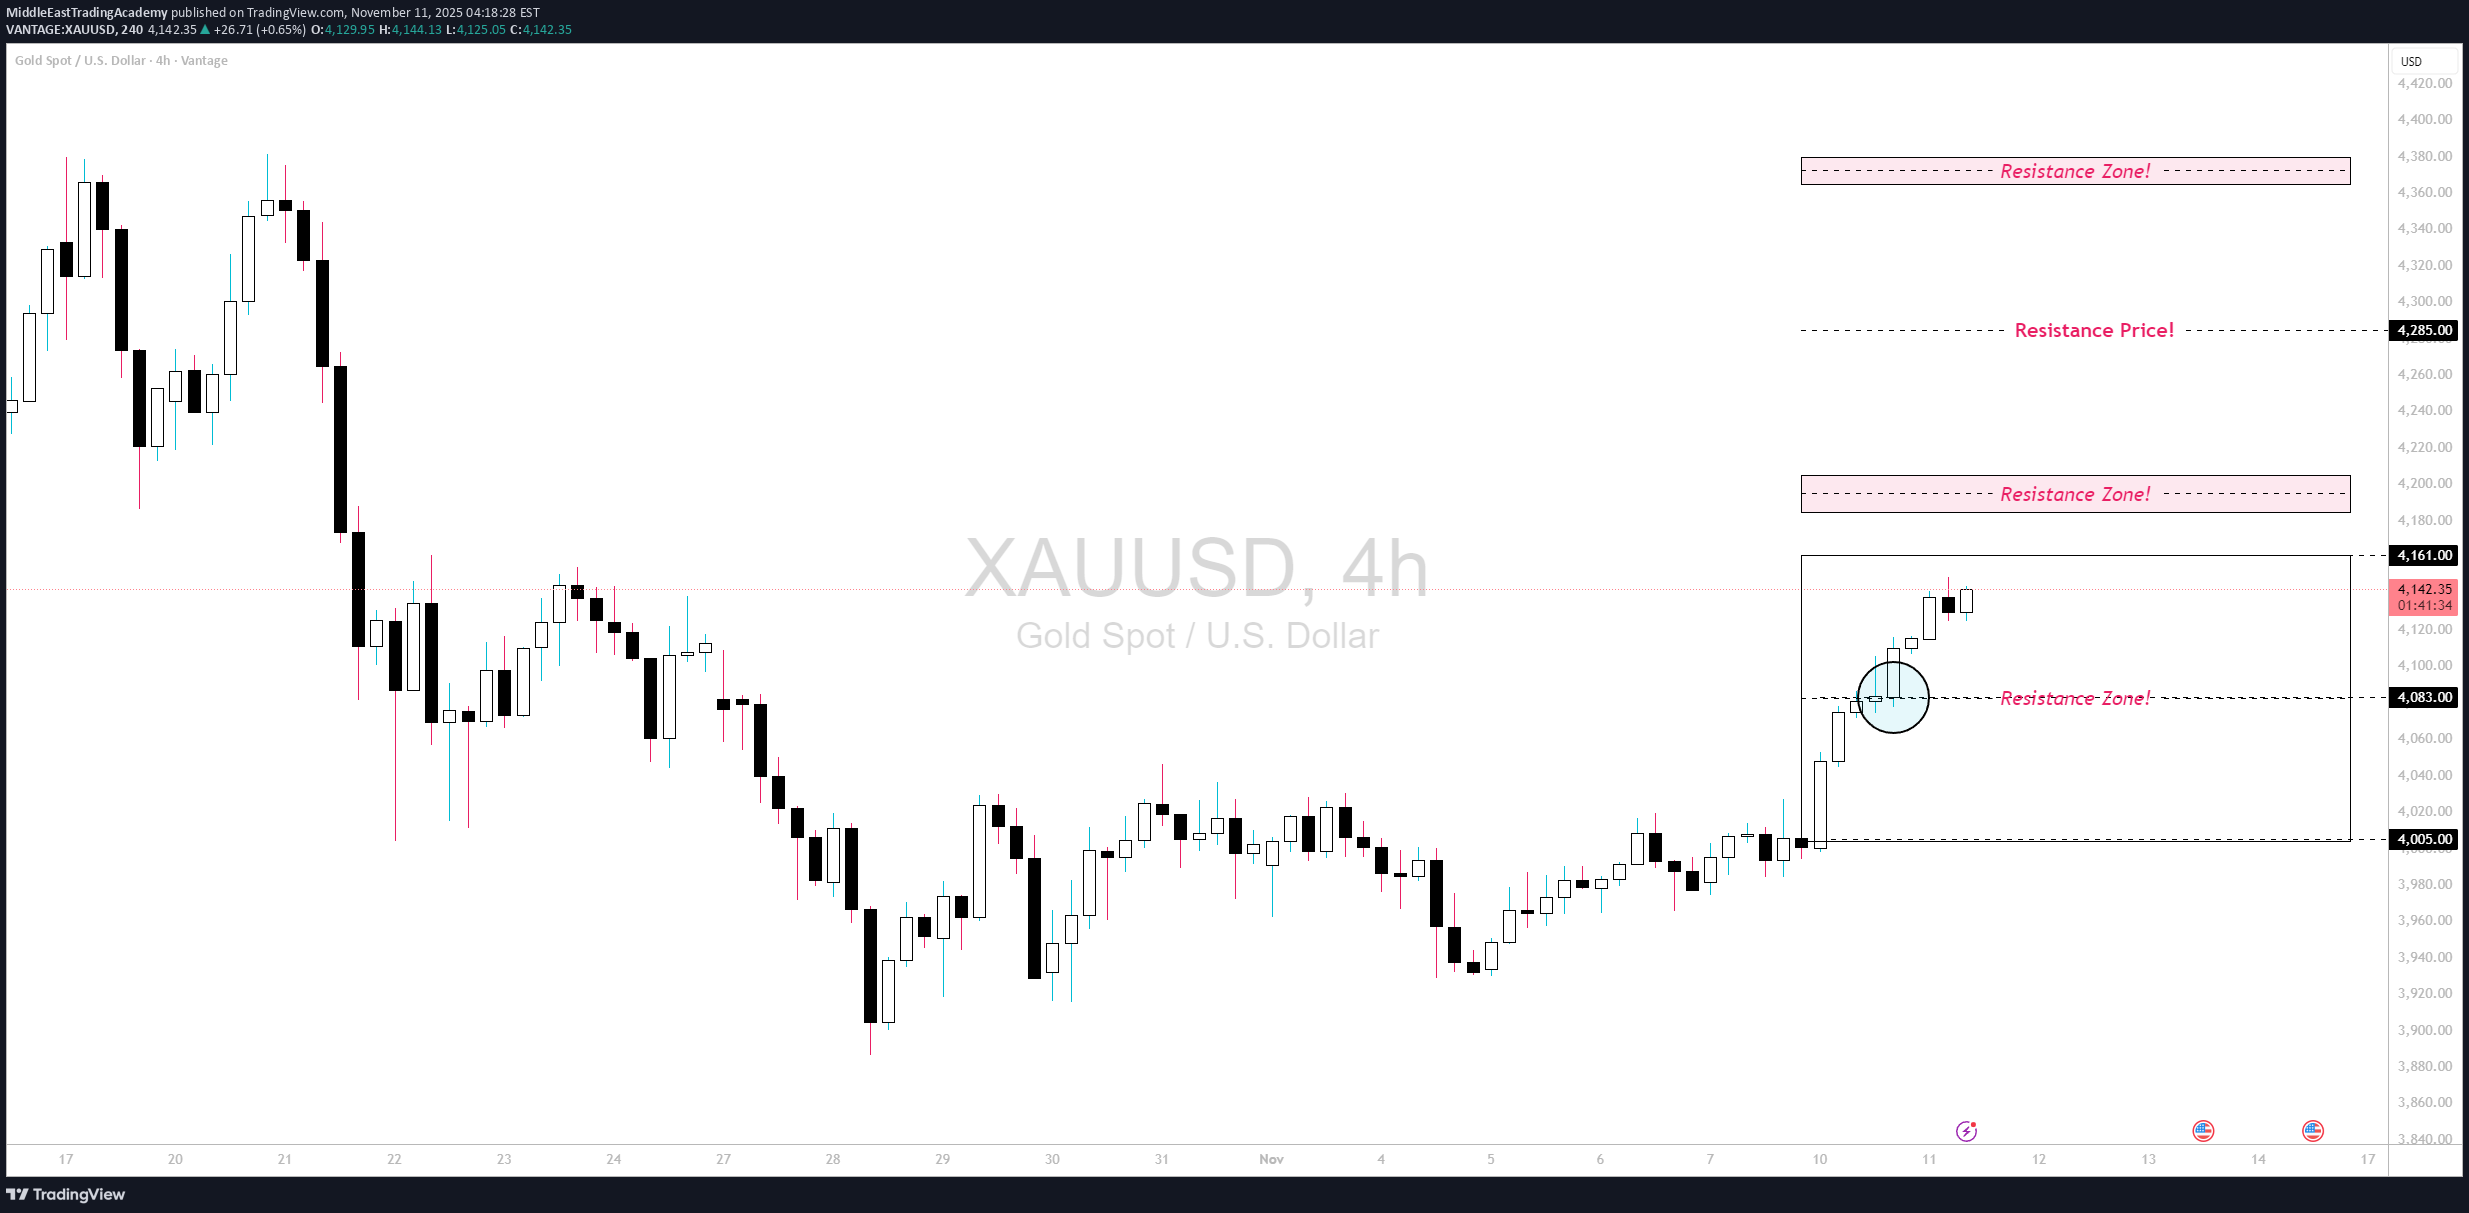
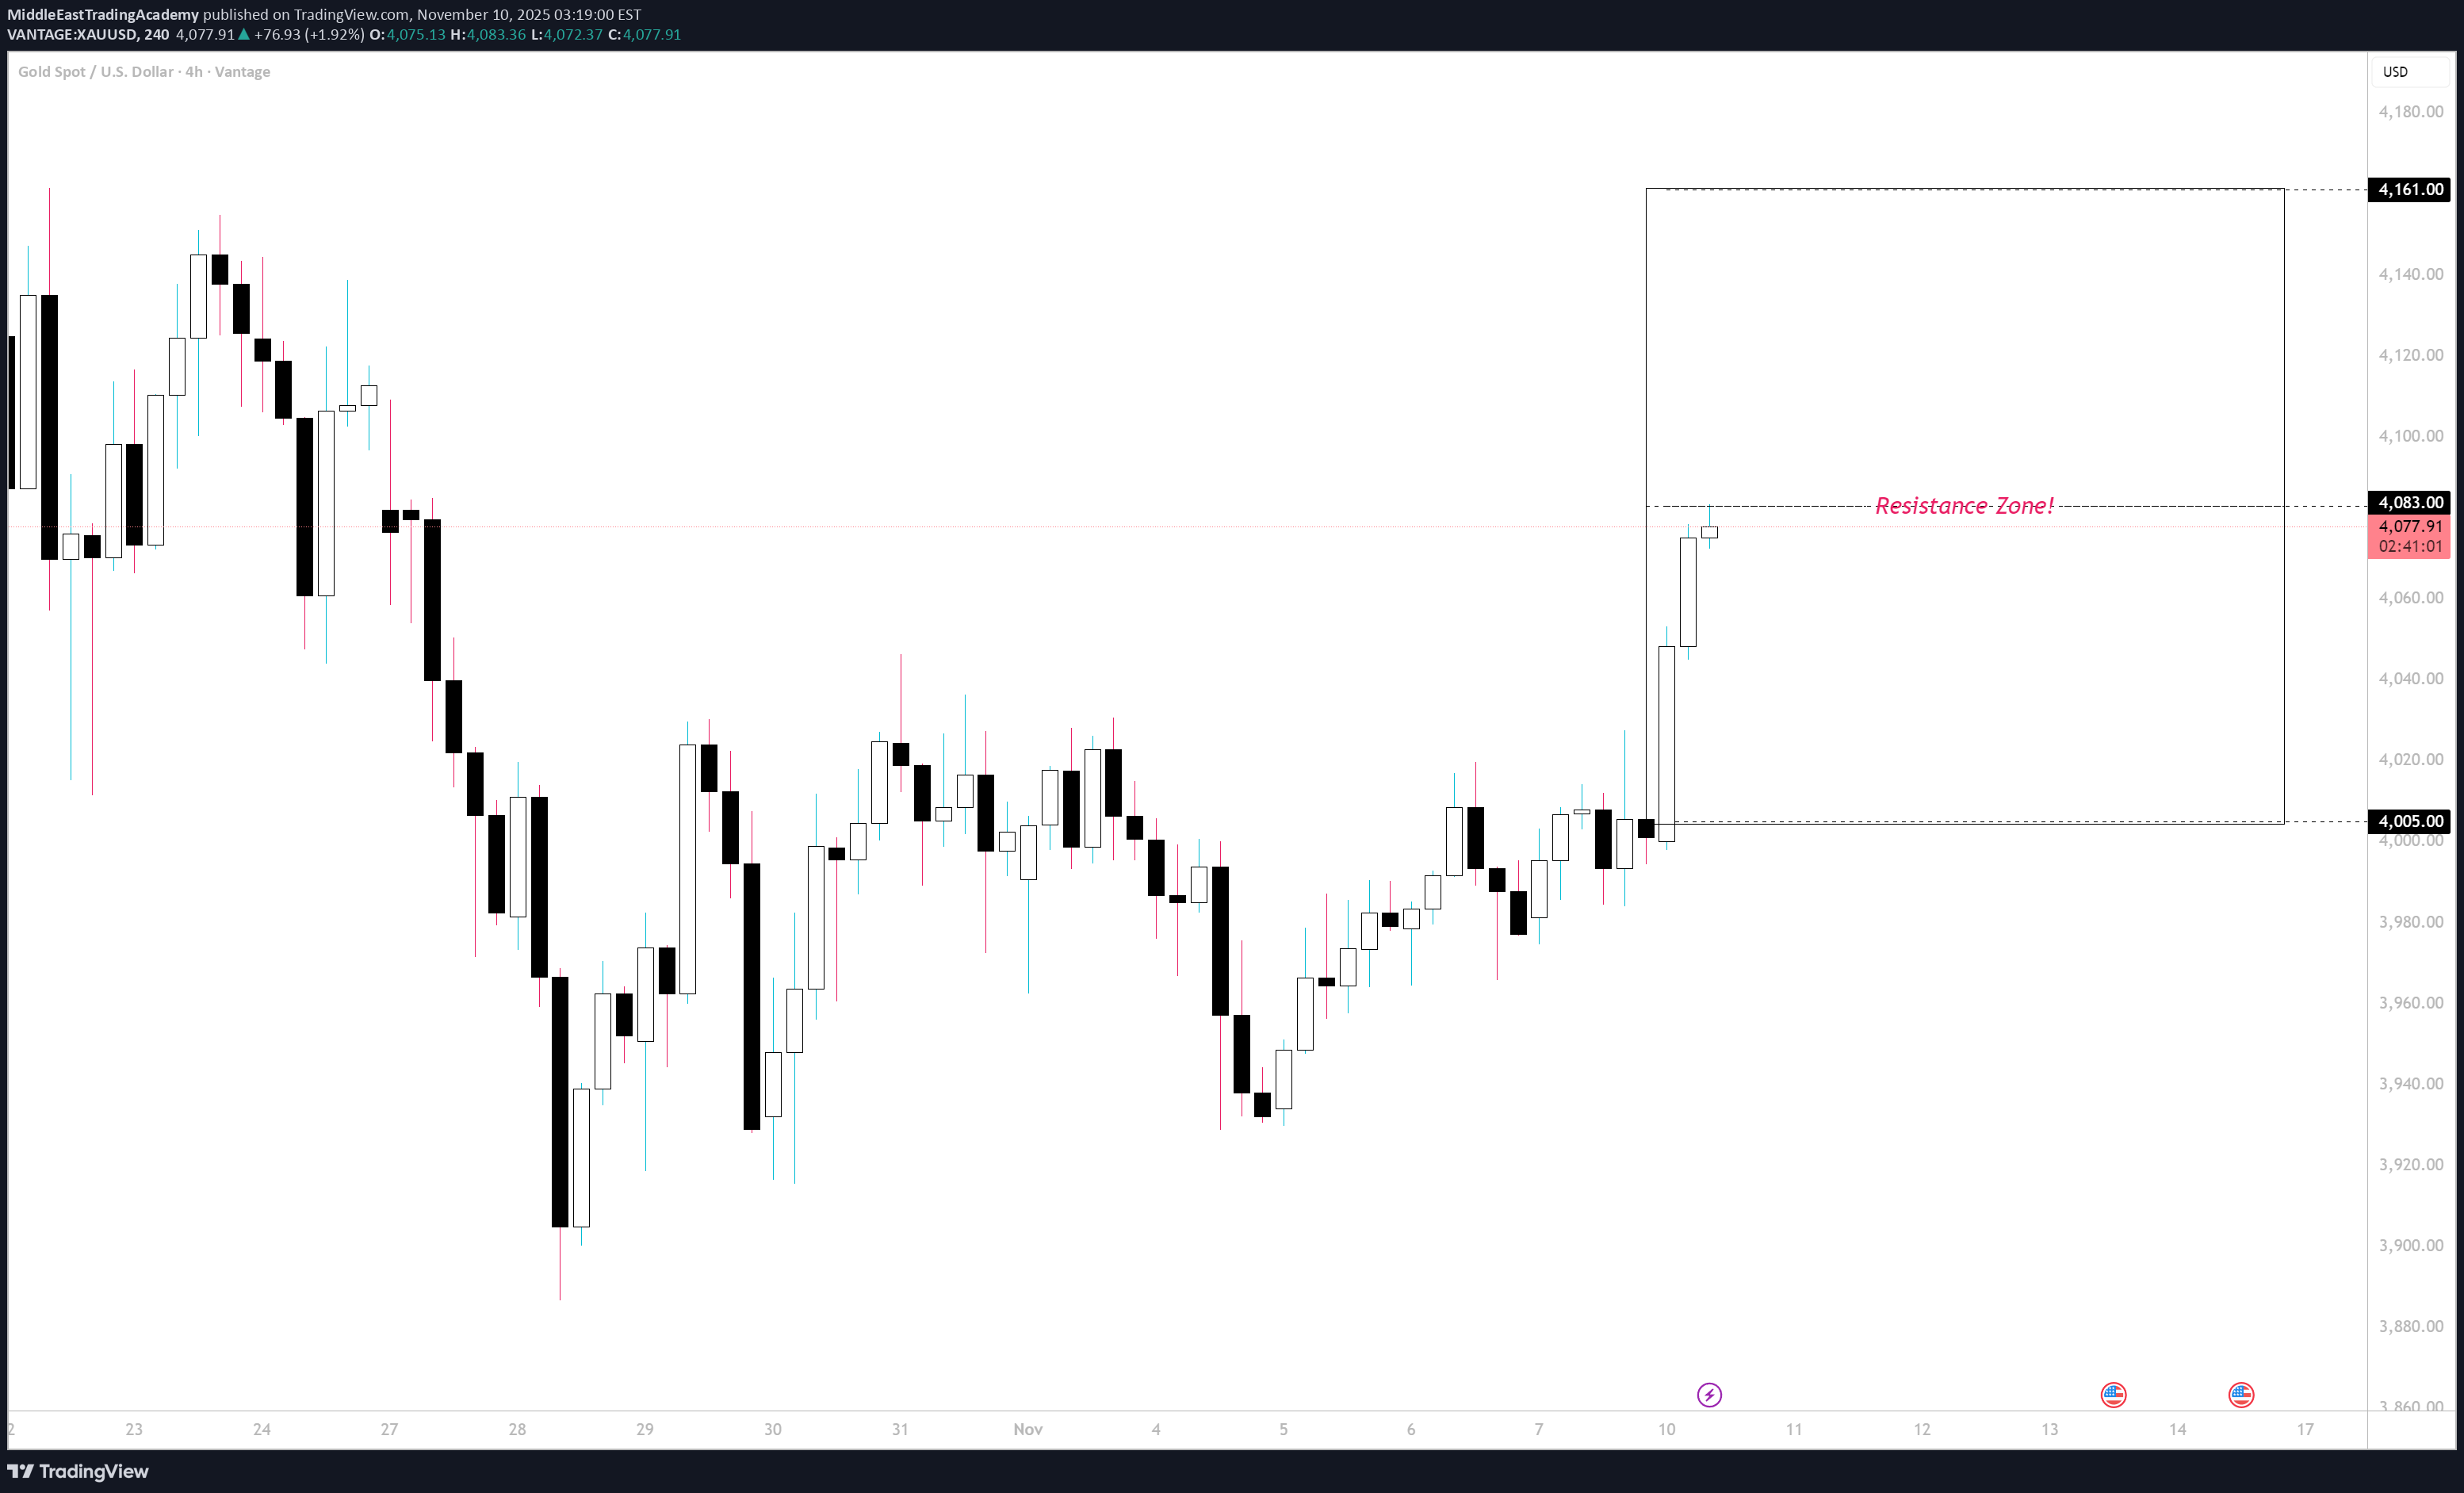
🧭 Market Overview Gold continues to trade within a strong bullish momentum after breaking above the $4,083 resistance level, confirming short-term strength and pushing prices toward the current resistance area around $4,135–$4,160. This region represents a critical decision zone, where the next move will likely determine the short- to medium-term direction of gold. 📊 Technical Structure Key Support Zone: $4,005 – $4,045 Decision Zone (Current): $4,120 – $4,135 Resistance Levels: $4,160 → $4,185 → $4,205 → $4,285 → $4,365 The market recently closed multiple 4-hour candles above $4,083, confirming a strong bullish structure. However, the current Resistance Zone ($4,135–$4,160) could trigger a temporary correction if price fails to maintain momentum above this range. 🧩 Potential Scenarios Bullish Continuation: If gold sustains 4H and daily closes above $4,135–$4,160, momentum could accelerate toward $4,205, $4,285, and possibly $4,365–$4,380, which aligns with the previous historical peak. Bearish Rejection / Correction: If price fails to hold above $4,120–$4,135, a pullback toward $4,085, $4,045, or $4,005 is likely before buyers attempt to regain control. 🔭 Outlook Summary The zone between $4,120 and $4,135 remains the core decision area. Holding above = continuation of bullish momentum. Closing below = short-term correction phase. Traders should monitor candle closes rather than quick spikes or wicks, as false breakouts are common in such volatile conditions. ⚠️ Disclaimer: This analysis is for educational purposes only and does not represent financial advice or trading recommendations. Always conduct your own research and risk management before entering the market.
MiddleEastTradingAcademy
طلا در تقاطع حیاتی: آیا مقاومت ۴۰۸۳ دلار شکسته میشود؟ (تحلیل XAUUSD)
Gold is currently trading within an important technical range between $4,005 and $4,083 on the 4H timeframe, approaching a key resistance zone around $4,083, which acts as a major decision point for the next directional move. This area is better viewed as an observation and reaction zone, rather than a direct entry level — as a confirmed close above or below it will define the next directional momentum. 🔹 If price closes and holds above $4,083: Bullish momentum could extend further toward: $4,120 $4,160 🔹 If price remains below $4,083: A short-term correction or pullback could develop toward: $4,048 $4,008 📊 Overall View: The $4,083 zone represents a balance area between buyers and sellers. Waiting for a clear 4H or daily close confirmation is preferable before making any trading decisions. ⚠️ Disclaimer This analysis is published for educational purposes only and does not constitute financial advice or a call to buy or sell. Each trader should make decisions based on their own strategy and risk management approach.
MiddleEastTradingAcademy
طلا در آستانه انفجار: آیا اونس جهانی از سد 4030 دلار عبور میکند؟
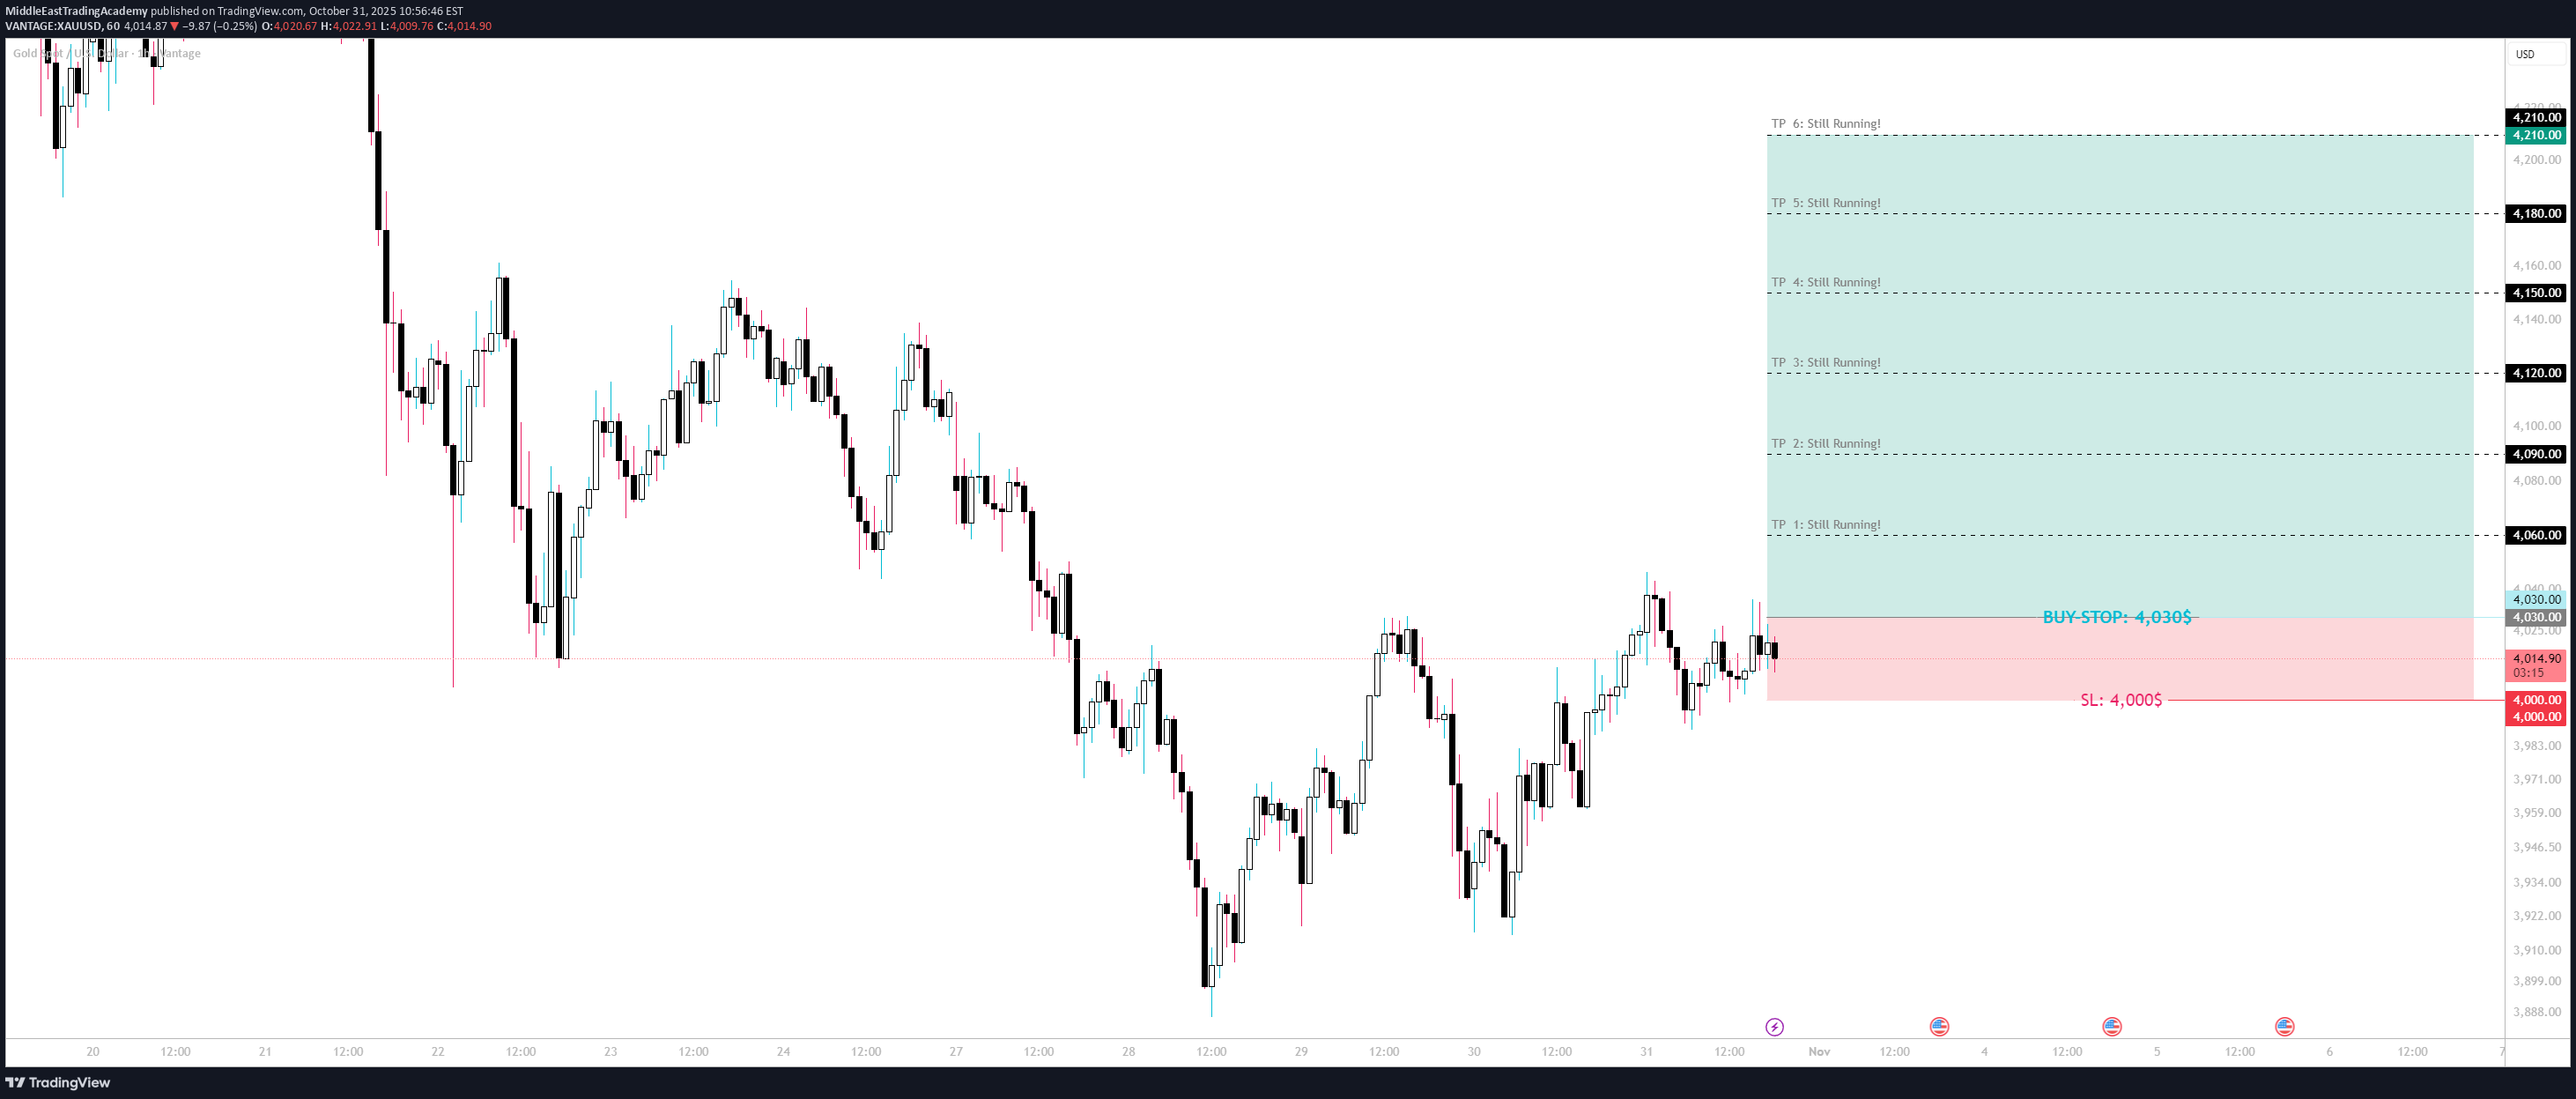
🟢 XAUUSD | Gold Breakout Setup – Educational Analysis Gold continues to show constructive price action following sustained bullish momentum across intraday timeframes. After a healthy consolidation phase, the market is now testing a critical resistance zone around $4,030. A clean breakout and confirmed 1H close above $4,030 would signal renewed strength, aligning with the broader bullish structure observed on higher timeframes (4H & Daily). 🔹 Technical Outlook The current structure suggests the potential for continuation toward higher liquidity zones if the breakout holds. Sustained trading above $4,030 would confirm buyer control, invalidating the short-term correction phase. 📈 Trade Plan (Educational Setup) Entry (Buy Stop): $4,030 Stop Loss (SL): $4,000 Take Profit Targets (TP): TP1 → $4,060 TP2 → $4,090 TP3 → $4,120 TP4 → $4,150 TP5 → $4,180 TP6 → $4,210 💡 Analyst’s Commentary This setup aims to capture the potential breakout continuation, with risk contained below the $4,000 psychological support. Momentum confirmation on H1 and H4 closes will be key for trade validation. Traders may consider partial profit-taking along the way and trailing stops to secure gains. ⚖️ Risk/Reward: ≈ 1 : 3.5 🕓 Timeframe: H1 – Short-Term Swing ⚠️ Disclaimer: This analysis is shared for educational and research purposes only as part of Middle East Trading Academy’s ongoing market study. It does not constitute financial advice or an investment recommendation.⚠️ Update: This trade setup was not activated, as there was no candle close at the entry level to confirm the position.
MiddleEastTradingAcademy
طلا (XAUUSD) در آستانه جهش بزرگ: آیا قیمت از 4030 دلار عبور میکند؟
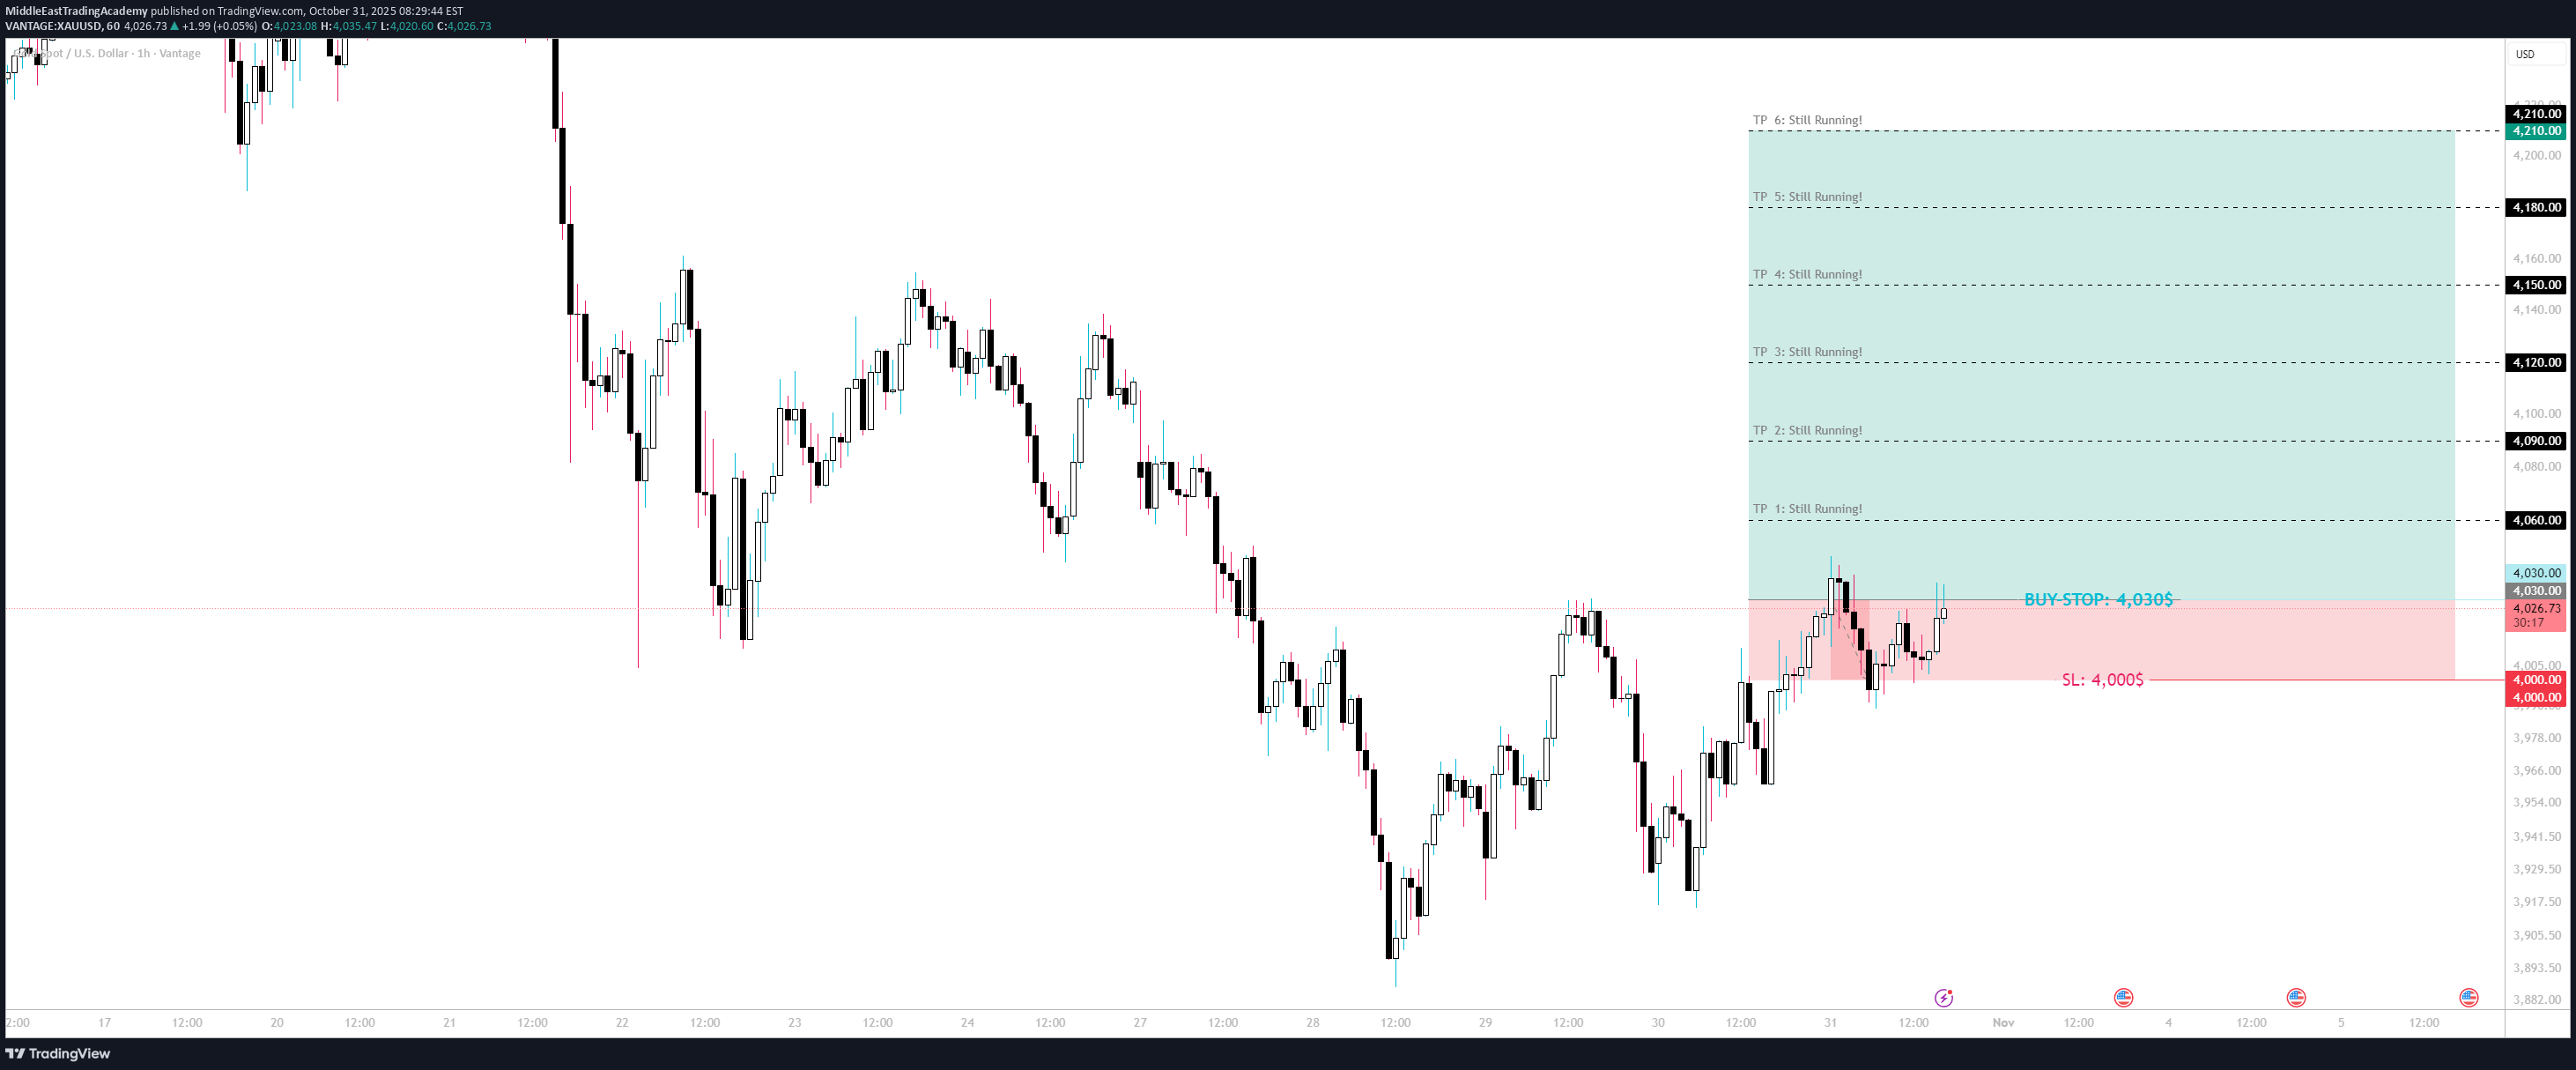
🟢 XAUUSD | Gold Breakout Setup – Educational Analysis Gold continues to show constructive price action following sustained bullish momentum across intraday timeframes. After a healthy consolidation phase, the market is now testing a critical resistance zone around $4,030. A clean breakout and confirmed 1H close above $4,030 would signal renewed strength, aligning with the broader bullish structure observed on higher timeframes (4H & Daily). 🔹 Technical Outlook The current structure suggests the potential for continuation toward higher liquidity zones if the breakout holds. Sustained trading above $4,030 would confirm buyer control, invalidating the short-term correction phase. 📈 Trade Plan (Educational Setup) Entry (Buy Stop): $4,030 Stop Loss (SL): $4,000 Take Profit Targets (TP): TP1 → $4,060 TP2 → $4,090 TP3 → $4,120 TP4 → $4,150 TP5 → $4,180 TP6 → $4,210 💡 Analyst’s Commentary This setup aims to capture the potential breakout continuation, with risk contained below the $4,000 psychological support. Momentum confirmation on H1 and H4 closes will be key for trade validation. Traders may consider partial profit-taking along the way and trailing stops to secure gains. ⚖️ Risk/Reward: ≈ 1 : 3.5 🕓 Timeframe: H1 – Short-Term Swing ⚠️ Disclaimer: This analysis is shared for educational and research purposes only as part of Middle East Trading Academy’s ongoing market study. It does not constitute financial advice or an investment recommendation.⚠️ Update: This trade setup was not activated, as there was no candle close at the entry level to confirm the position.
MiddleEastTradingAcademy
VeChain revisits its 2020 demand zone
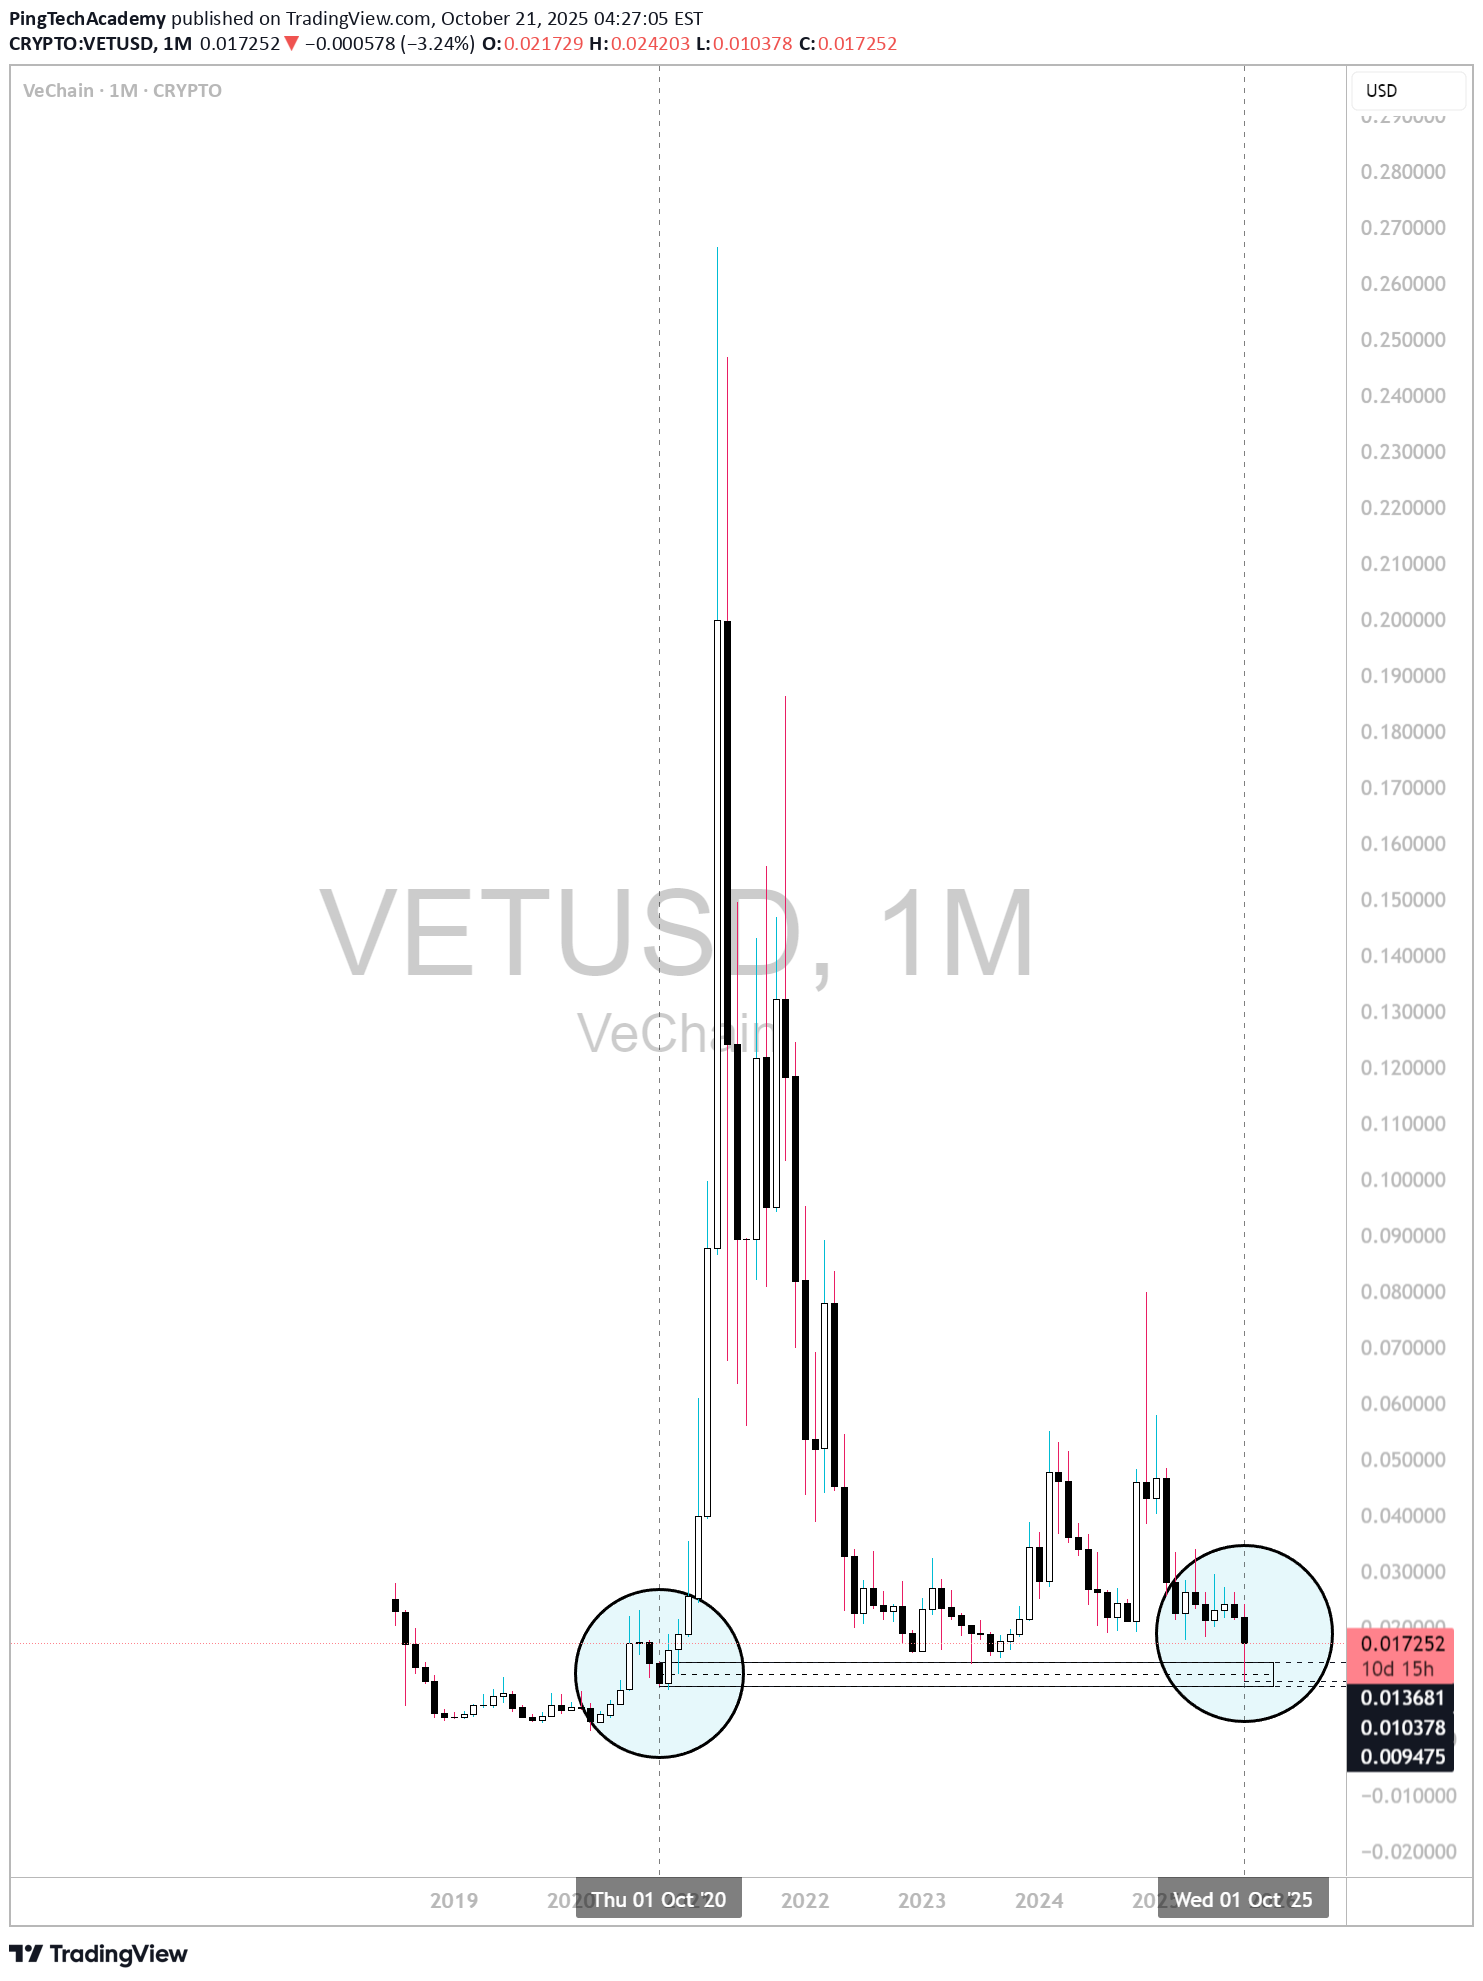
## **VeChain (VET/USD) — Macro Structural Analysis | Monthly Outlook** ### 🧭 **Market Context** As of **October 2025**, VeChain (VET) has returned to the **same macro demand zone** that formed in **October 2020**, the foundation of its previous bull cycle. The **flash crash this month** brought the price down to a historical accumulation level between **$0.009 – $0.013**, creating a structural mirror of the early 2020 setup before the 2021 rally. This move suggests that VET is now testing a **critical long-term support**, aligning with the broader market phase where altcoins typically consolidate before a new expansion cycle. --- ### 📊 **Technical Structure** * **Support Zone:** $0.009 – $0.013 * **Resistance Range:** $0.035 – $0.050 * **Macro Invalidation:** Monthly close below $0.009 The current monthly candle shows **a deep wick and strong price rejection**, signaling possible *liquidity absorption* at the lows. Maintaining this structural base above **$0.013** could confirm a **macro bottom formation**, with potential continuation toward **$0.05 – $0.07** during **Q2–Q3 2026**, particularly if **Bitcoin dominance** begins to decline as projected. --- ### 🪙 **Fundamental Overview** VeChain remains one of the leading **enterprise-focused Layer-1 blockchains**, providing real-world solutions in **supply chain management, logistics, and carbon tracking**. * **Market Cap:** ≈ $1.25B * **Circulating Supply:** ≈ 72.5B VET * **On-Chain Metrics:** Stabilizing activity and rising VTHO consumption indicate renewed network usage. This fundamental resilience supports the idea that VeChain could be entering a **re-accumulation phase**, mirroring the 2020–2021 structural rhythm. --- ### 🔭 **Outlook** If this historical symmetry continues, VeChain could remain within a **sideways accumulation structure** until **April 2026**, before initiating a new bullish expansion phase. A confirmed break above **$0.035** would likely mark the first signal of structural recovery across the altcoin sector. --- ### ⚠️ **Disclaimer** This analysis is for **educational and informational purposes only** and does **not constitute financial advice**. All opinions represent my **personal market perspective** and may change without notice. Trading cryptocurrencies involves **significant risk**, and investors should perform their own research or consult a licensed financial advisor before making decisions.VeChain (VET/USD) — Macro Structural Analysis | Updated November 2025 🧭 Market Context As of November 2025, VeChain (VET) has shown a significant technical rebound, now trading around $0.01770, confirming a steady recovery from the macro demand zone ($0.009 – $0.013) that was highlighted in the previous monthly outlook. This rebound reflects a structural defense of the long-term support base, which aligns with the early accumulation phases observed during the 2020–2021 market cycle. Sustained trading above $0.013 now transitions the market sentiment from capitulation to early re-accumulation, potentially setting the stage for a medium-term bullish continuation. 📊 Technical Structure Key Support Zone: $0.013 – $0.015 Current Price: ≈ $0.01770 Short-Term Resistance: $0.0205 – $0.0220 Major Macro Resistance: $0.035 – $0.050 Macro Invalidation: Monthly close below $0.013 The monthly candle currently holds a strong body above prior support, confirming that buyers are reclaiming control within this structural base. Maintaining closes above $0.017 will likely accelerate momentum toward the $0.022 liquidity area, while a clean breakout above $0.035 remains the structural confirmation for a macro trend reversal. 🪙 Fundamental Overview VeChain continues to strengthen its enterprise adoption narrative, expanding in logistics, carbon tracking, and supply chain verification. Recent increases in on-chain activity and VTHO utility consumption further support the improving network fundamentals. Market Cap: ≈ $1.5B Circulating Supply: ≈ 72.5B VET Ecosystem Note: Development activity remains stable with continued enterprise integrations in Europe and Asia. This confluence of technical and fundamental alignment suggests that VeChain may be transitioning from accumulation to structural expansion, potentially mirroring its 2020–2021 pattern but under a more mature market phase. 🔭 Outlook If VeChain maintains stability above $0.017, the next momentum targets lie between $0.022 – $0.028, while a confirmed monthly close above $0.035 would mark the onset of a macro bullish reversal phase, potentially extending toward $0.05 – $0.07 by mid-2026, especially if Bitcoin dominance weakens as anticipated. The macro structure remains constructive as long as the price holds above $0.013 and continues forming higher monthly closes. ⚠️ Disclaimer This analysis is for educational and informational purposes only and does not constitute financial advice. All views expressed represent a personal market perspective, subject to change based on evolving market conditions. Cryptocurrency markets are highly volatile — always manage risk and conduct your own due diligence before trading or investing.
Disclaimer
Any content and materials included in Sahmeto's website and official communication channels are a compilation of personal opinions and analyses and are not binding. They do not constitute any recommendation for buying, selling, entering or exiting the stock market and cryptocurrency market. Also, all news and analyses included in the website and channels are merely republished information from official and unofficial domestic and foreign sources, and it is obvious that users of the said content are responsible for following up and ensuring the authenticity and accuracy of the materials. Therefore, while disclaiming responsibility, it is declared that the responsibility for any decision-making, action, and potential profit and loss in the capital market and cryptocurrency market lies with the trader.