
Merlia_key
@t_Merlia_key

What symbols does the trader recommend buying?
Purchase History
پیام های تریدر
Filter
Merlia_key
پیشبینی کریسمس بیت کوین: آیا رالی صعودی BTC/USDT یک تله است؟
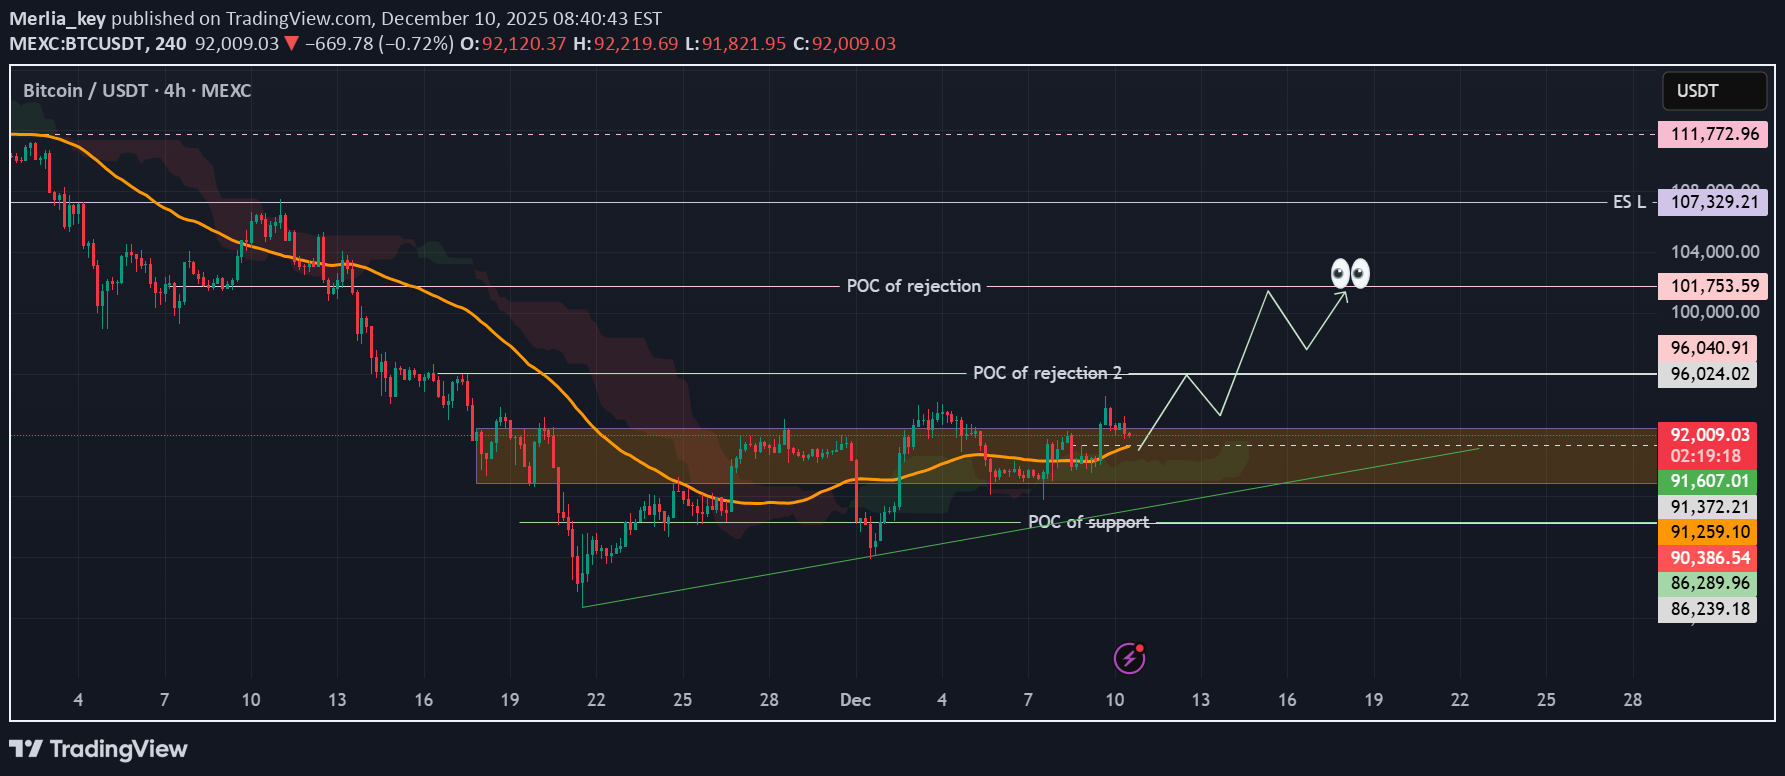
My idea is based on my bias that we are in a range season and the upward movement is a correction. In other words, I take into account the liquidity zones left by previous POCs. If it reaches 101 k at all, for me that's a dangerous zone where any unnecessary FOMO could turn into a trap. But if it breaks through, we'll see again. We're all hoping for a Christmas rally, right?
Merlia_key
استراتژی اسکالپ سریع و کمریسک با الگوی کلاسیک: ورود دقیق و سود تضمینی!

A classic pattern that I love to trade. Clean structure. Clearly defined ChoCh. Entry - 50% retracement. Target - around -0.27 Fib level SL: A must.
Merlia_key
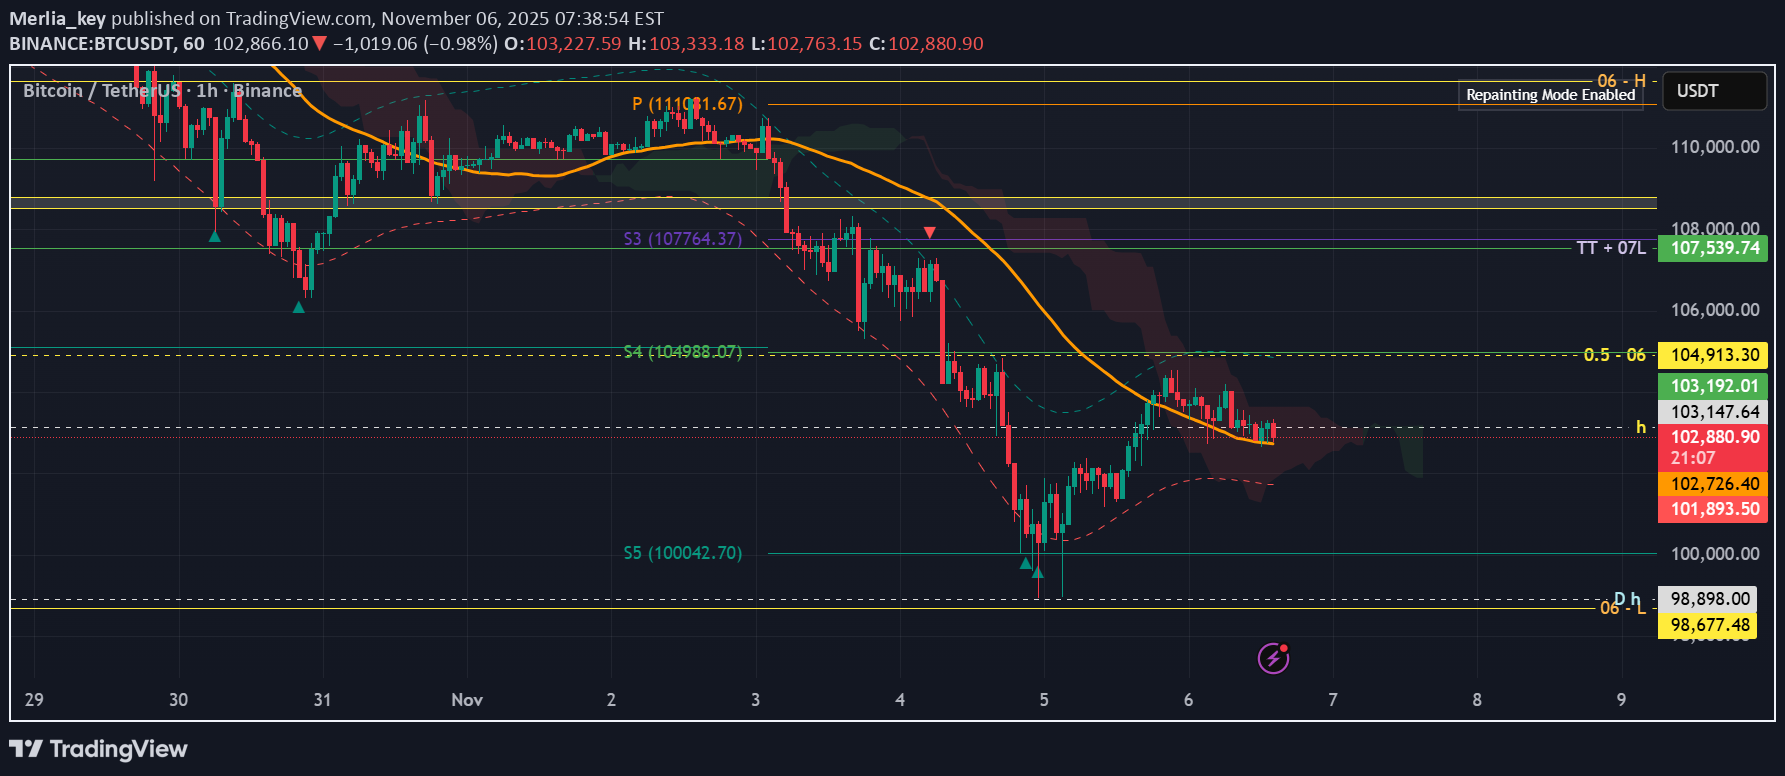
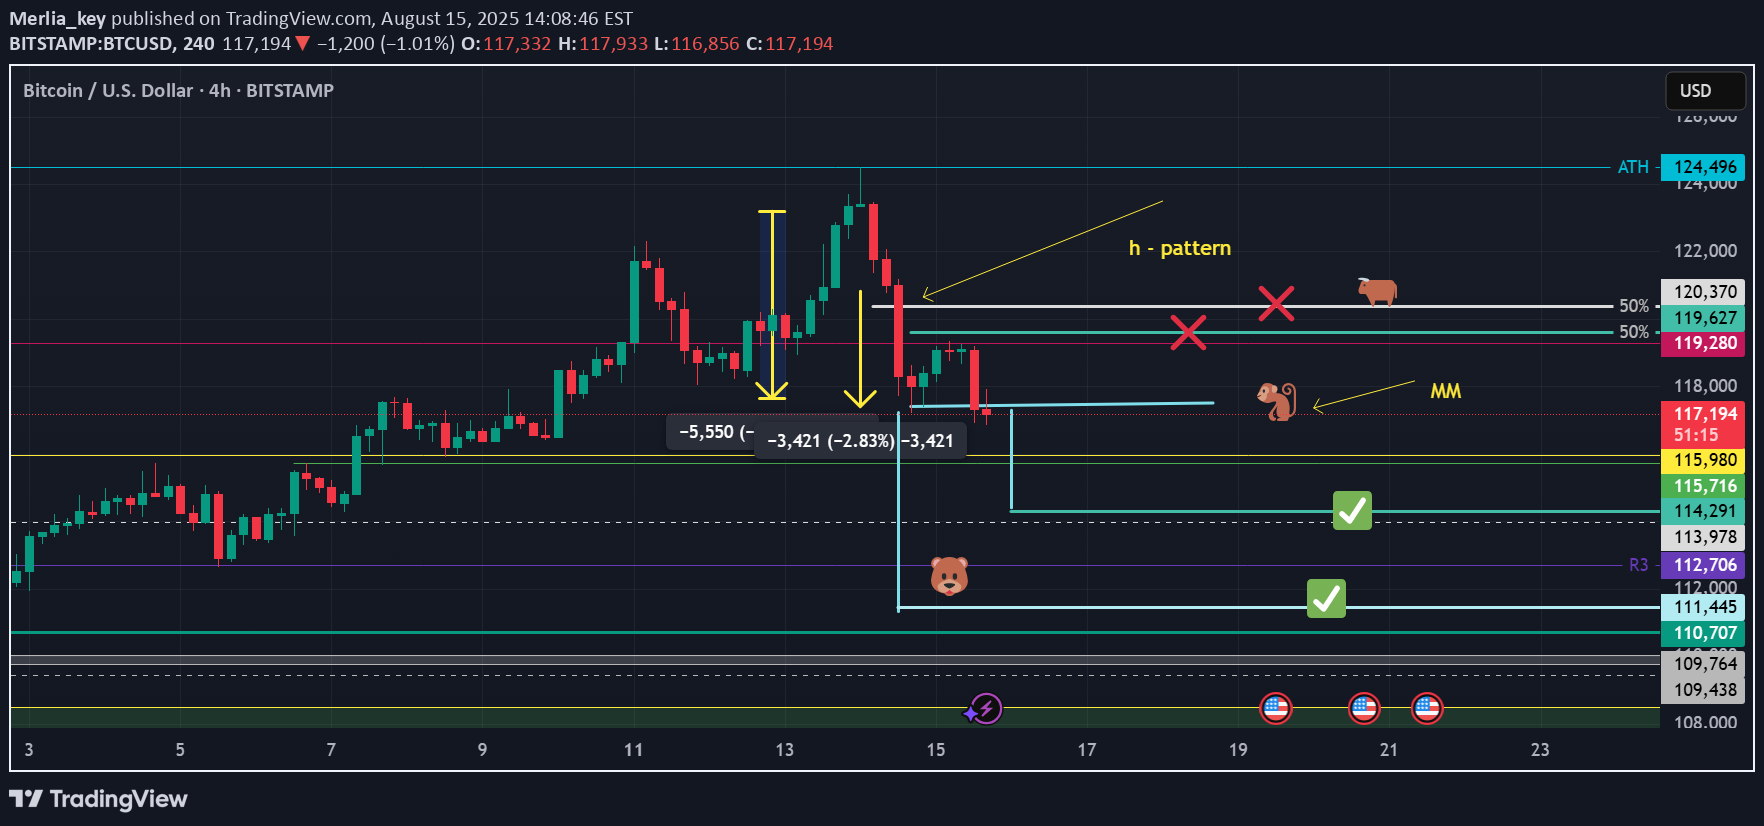
الگوی H: راز بازار که همیشه تکرار میشود (با هدف قیمتی جدید!)

There are patterns that simply play out. Regardless of news, politics, and hopes. The h-pattern is one of them. Further confirmation comes from the rejection of S4 on Camarilla pivots. The usual behavior of assets, not just BTC, is to bounce off S4 and, if the trend is bullish, continue to P—the main pivot point and even up to R4 of time-limited movement within the week. The rejection of S4 is most often a signal that the asset does not have the strength to continue upward. The approximate coincidence between the target of the h-pattern and S5 from Camarilla pivots gives reason to watch for the next support zone in the 93500 - 92500 area. Stay safe. No fear, no fomo, risk management is the key.
Merlia_key
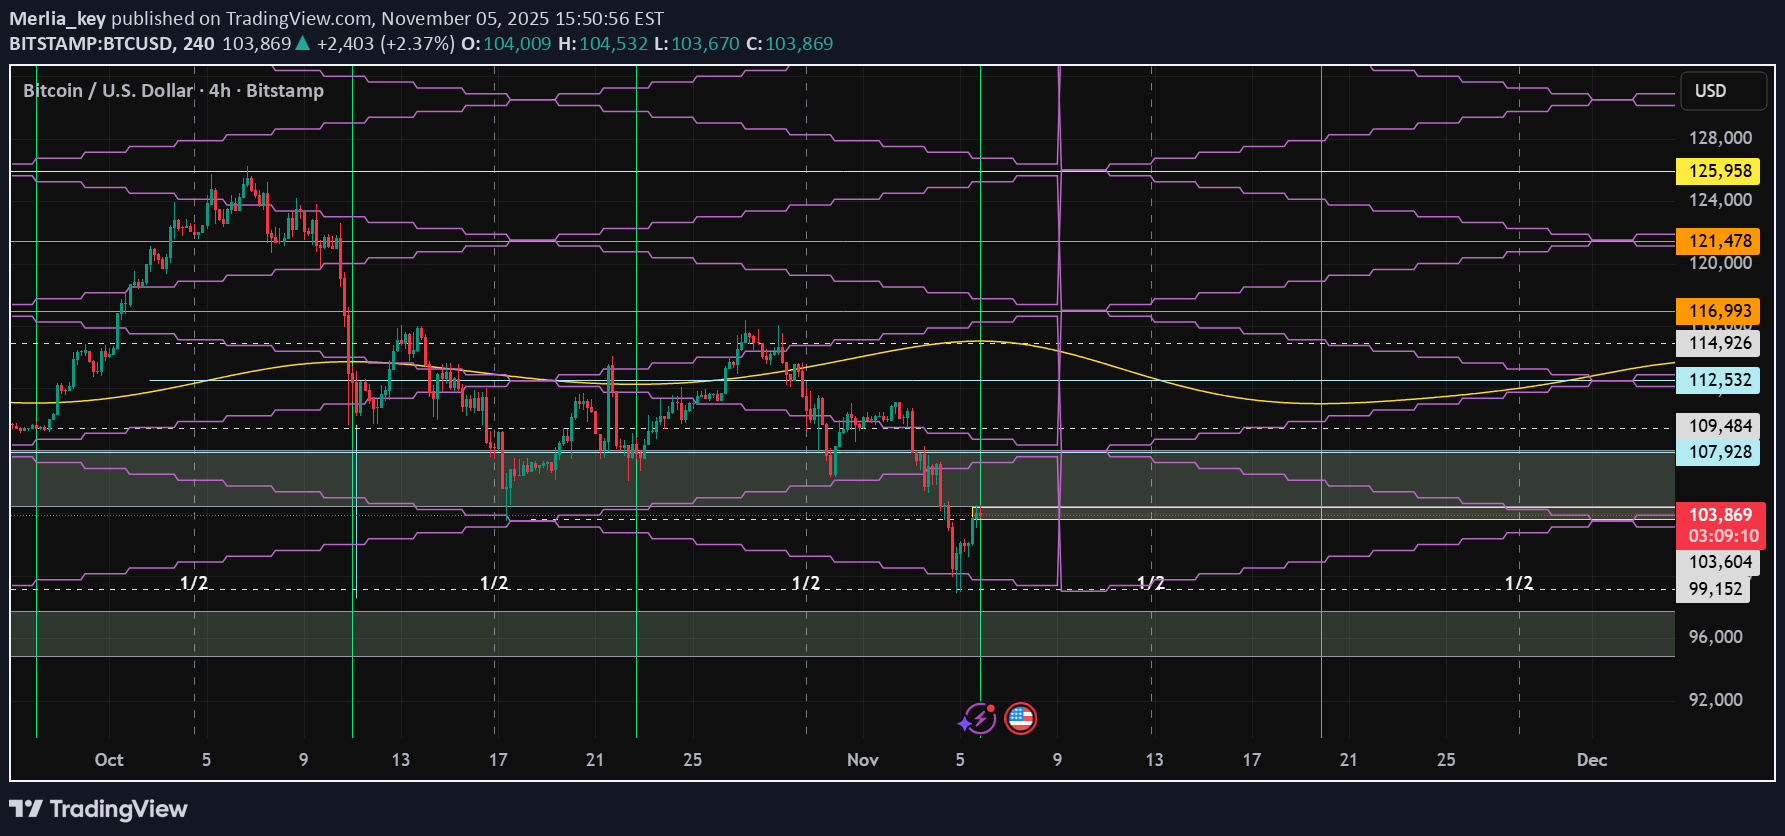
خطوط سیارهای بیت کوین: آیا ریزش پایان مییابد؟ (تاریخ سرنوشتساز نوامبر)

The planetary lines of the Mars/Pluto synodic cycles—the most influential in BTC's natal chart—show no sign of reversal. The rejection is more strong than the slow move towards the liquidity of 107, which was taken. I would wait until around November 19-20-21 for more confirmation of whether there will be a reversal of the downtrend, even if there is a short bounce due to the CME gap. At this stage, I am monitoring the areas around 101 and the area above 99500.
Merlia_key
راز سادگی الگوی H: مشاهده دقیق برای پیشبینی حرکت بازار!
I really like the h-pattern. I share without prediction - just observation how the targets of h-pattern was fully respected. There were two significant ones last month. Their targets have been fully met, and now the range is between the two targets. Observation, not prediction. However, it could be concluded that if it breaks through the upper level, there will be a bullish continuation, and if it breaks through the lower level, it will seek support at lower levels.
Merlia_key
نحوه علامتگذاری نقاط عطف (پیوت) با اندیکاتورهای Time Trades: راهنمای کاربردی
This chart shows one of the latest updates to Time Trades indicators . Essentially, they are astrological, but can also be used by people who do not have in-depth astrological knowledge. Their creator, provides ongoing training on how to work with his indicators. For this chart, the following were used: Outer Current Wheel of 24 and Vibration Sandbox . The green lines mark periods in which a local time pivot is formed. The purple diamond is based on the most influential planets in the BTC horoscope (I choose only this. There are many other options). So, the trader can mark the pivot during the green line time zone and and watch for a retest above this zone or a rejection below it within the time frame between the two green vertical lines. There is often a reversal in the middle of the period, but not always. My choice is to use this interval. As can be seen, specific rebound or rejection zones also fit almost perfectly into BTC's "birth" diamond. The rebound after yesterday's long downward movement received unequivocal support and a reversal to long right at the bottom of the diamond. Now, half of the zone and the upper zone are being monitored. And the pivot now outlines the 104,000 - 104,500 zone as the current key level. No hurry, the retest must be awaited.
Merlia_key
استراتژی ماه نو: راز سادگی و صبر در تریدینگ (بدون عجله!)
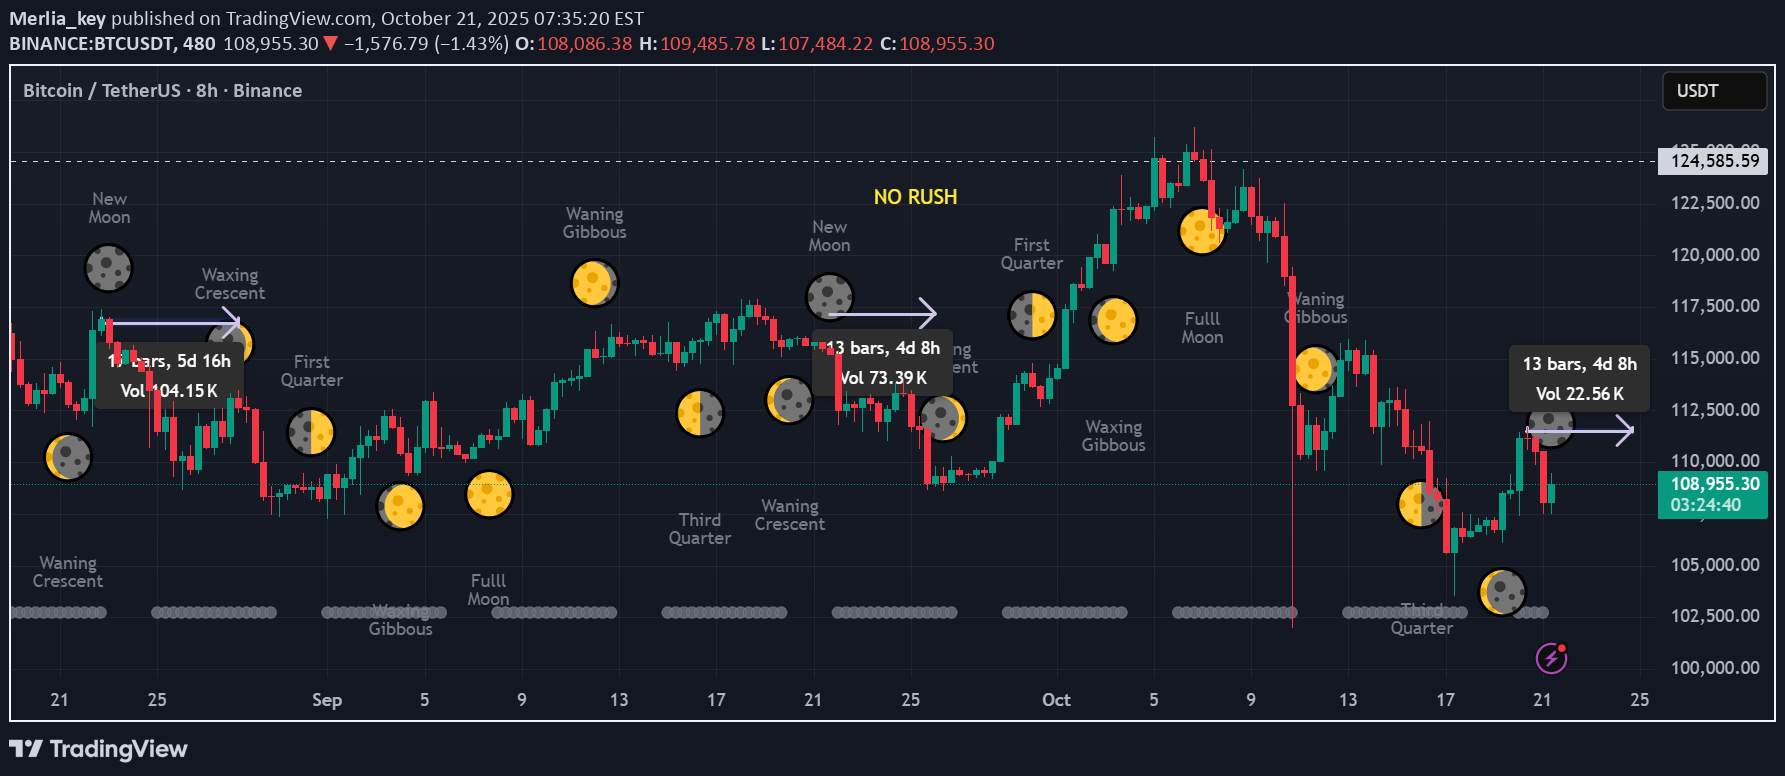
Trading on new moons and full moons has been interesting to me since my early days in trading. But things are not that simple. I found that the nature of the movement - rejection or breakout - after these two points is much more indicative of when windows open for trading with a clearer trend. Furthermore, the market behavior of assets is highly dependent on the astrological sign associated with the new moon itself. I am not an astrologer, so I asked ChatGpt what the usual market behavior is when there is a new moon in Libra. Trading Focus – Libra Phase Strategy 1. Observation before motion. From Oct 21 to 23, stay in awareness mode. Range compression = recalibration. False breakouts will be common; listen for the rhythm behind the chart. 2. Venusian patience. Libra’s ruler Venus reminds us — harmony is not haste. Enter only if the movement feels elegant, not erratic. 3. Conscious capital. Each trade carries vibration. This week, capital alignment > capital expansion. You’re not chasing price — you’re tuning to it. •NASDAQ could echo Venus’ rhythm; mild uptrend if peace talks or tech collaborations emerge. •Gold and Silver likely to mirror the Chiron healing arc — slow, steady revaluation The indicator is Market Session Times by TradeTravelChill. Moon phases are not it's main purpose , only "second opinion". For more information about the indicator, go check TTC community.
Merlia_key
New moon consolidation period & Camarilla pivots hints
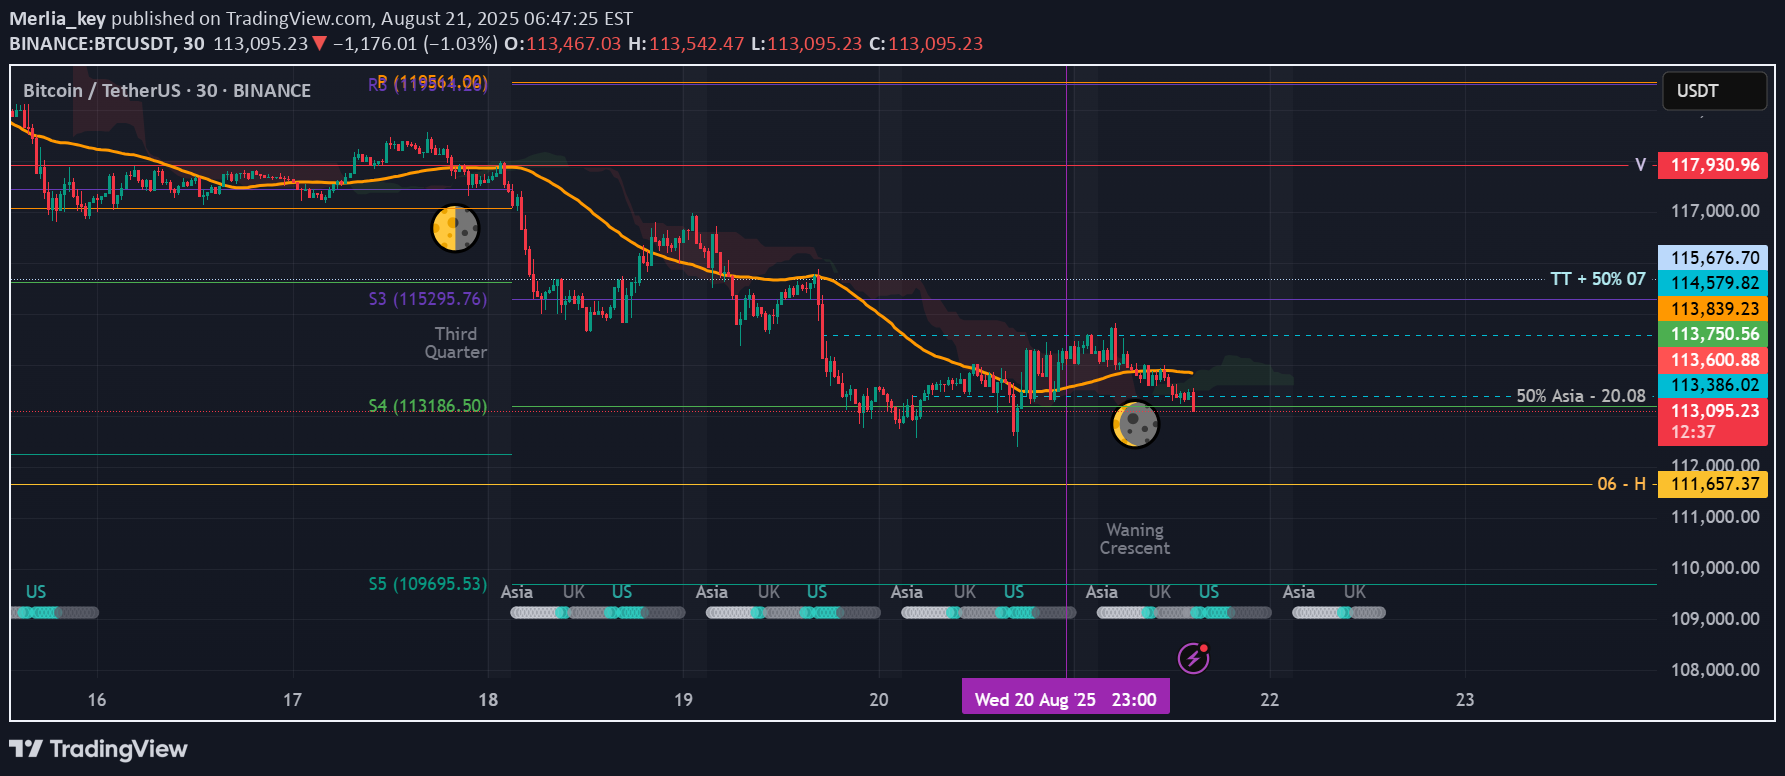
My choice is to use some very basic indicators as Pivot Points Standard - available in every exchange and TV for free. From the settings menu, just choose - Camarilla Pivots. I prefer to hide 1 and 2 and to use only P - pivot and S5, S4, S3, R3, R4, R5. My observation. Usually S4 is support and bounce level. R4 - resistance, rejection level. They could be used on any time frame. 3, 5, 15 minute - daily pivots; 30 minutes up to 8 h - Camarilla pivots for the week. D - monthly; W - pivot levels for the year. BTC reached S4 and still this level gives strong support. Nothing wrong if it goes to S5, but it will mark weakness. And yet, if BTC don't loose it, there is a chance a long term bullish continuation to be held. There is new moon in Virgo - 23.08. Usually new moon is the start of the new cycle, but the start starts with clearing the “floor“ so to say. Move down ant testing the health of lower levels. For now, BTC holds not only S4 - Camarilla pivots, but 50% of Asia - 19.08. It already take 50% from the previous red vector candle. Price projection till the end of the week, based on the factors, indicators and characteristic of the price action, mentioned above. If BTC loose S4 - S5 109700 has to hold. If BTC continue up to S3 before saturday, it could be more build for the short, rather bullish continuation. I will not take any action or trade before Monday 25.08.25
Merlia_key
Merlia_key
Bars pattern bullish idea

Let's say that BTC could mimic the pattern from the 2021 -22 bull run. We can see correction till the beginning of June. It matches the Venus squares and it's 2-nd cycle (Time trade indicators). There is always clear trend during the second Venus cycle. It could be bull or bear, but it is clear, not choppy. So, if the trend continued to be bullish and the downfalls during April and May are consolidation and correction, we can see the second peak, similar to the previous BTC bullish pattern, around the first days of September 2025, with maximum extension up to the end of Sept 25. Just idea, not financial advise. I am not astrologist, just use Time Trade indicators - they are just great even if the one have only basic astro knowledge.
Disclaimer
Any content and materials included in Sahmeto's website and official communication channels are a compilation of personal opinions and analyses and are not binding. They do not constitute any recommendation for buying, selling, entering or exiting the stock market and cryptocurrency market. Also, all news and analyses included in the website and channels are merely republished information from official and unofficial domestic and foreign sources, and it is obvious that users of the said content are responsible for following up and ensuring the authenticity and accuracy of the materials. Therefore, while disclaiming responsibility, it is declared that the responsibility for any decision-making, action, and potential profit and loss in the capital market and cryptocurrency market lies with the trader.