
Max_Pr0fit
@t_Max_Pr0fit

What symbols does the trader recommend buying?
Purchase History
پیام های تریدر
Filter
Signal Type
Max_Pr0fit
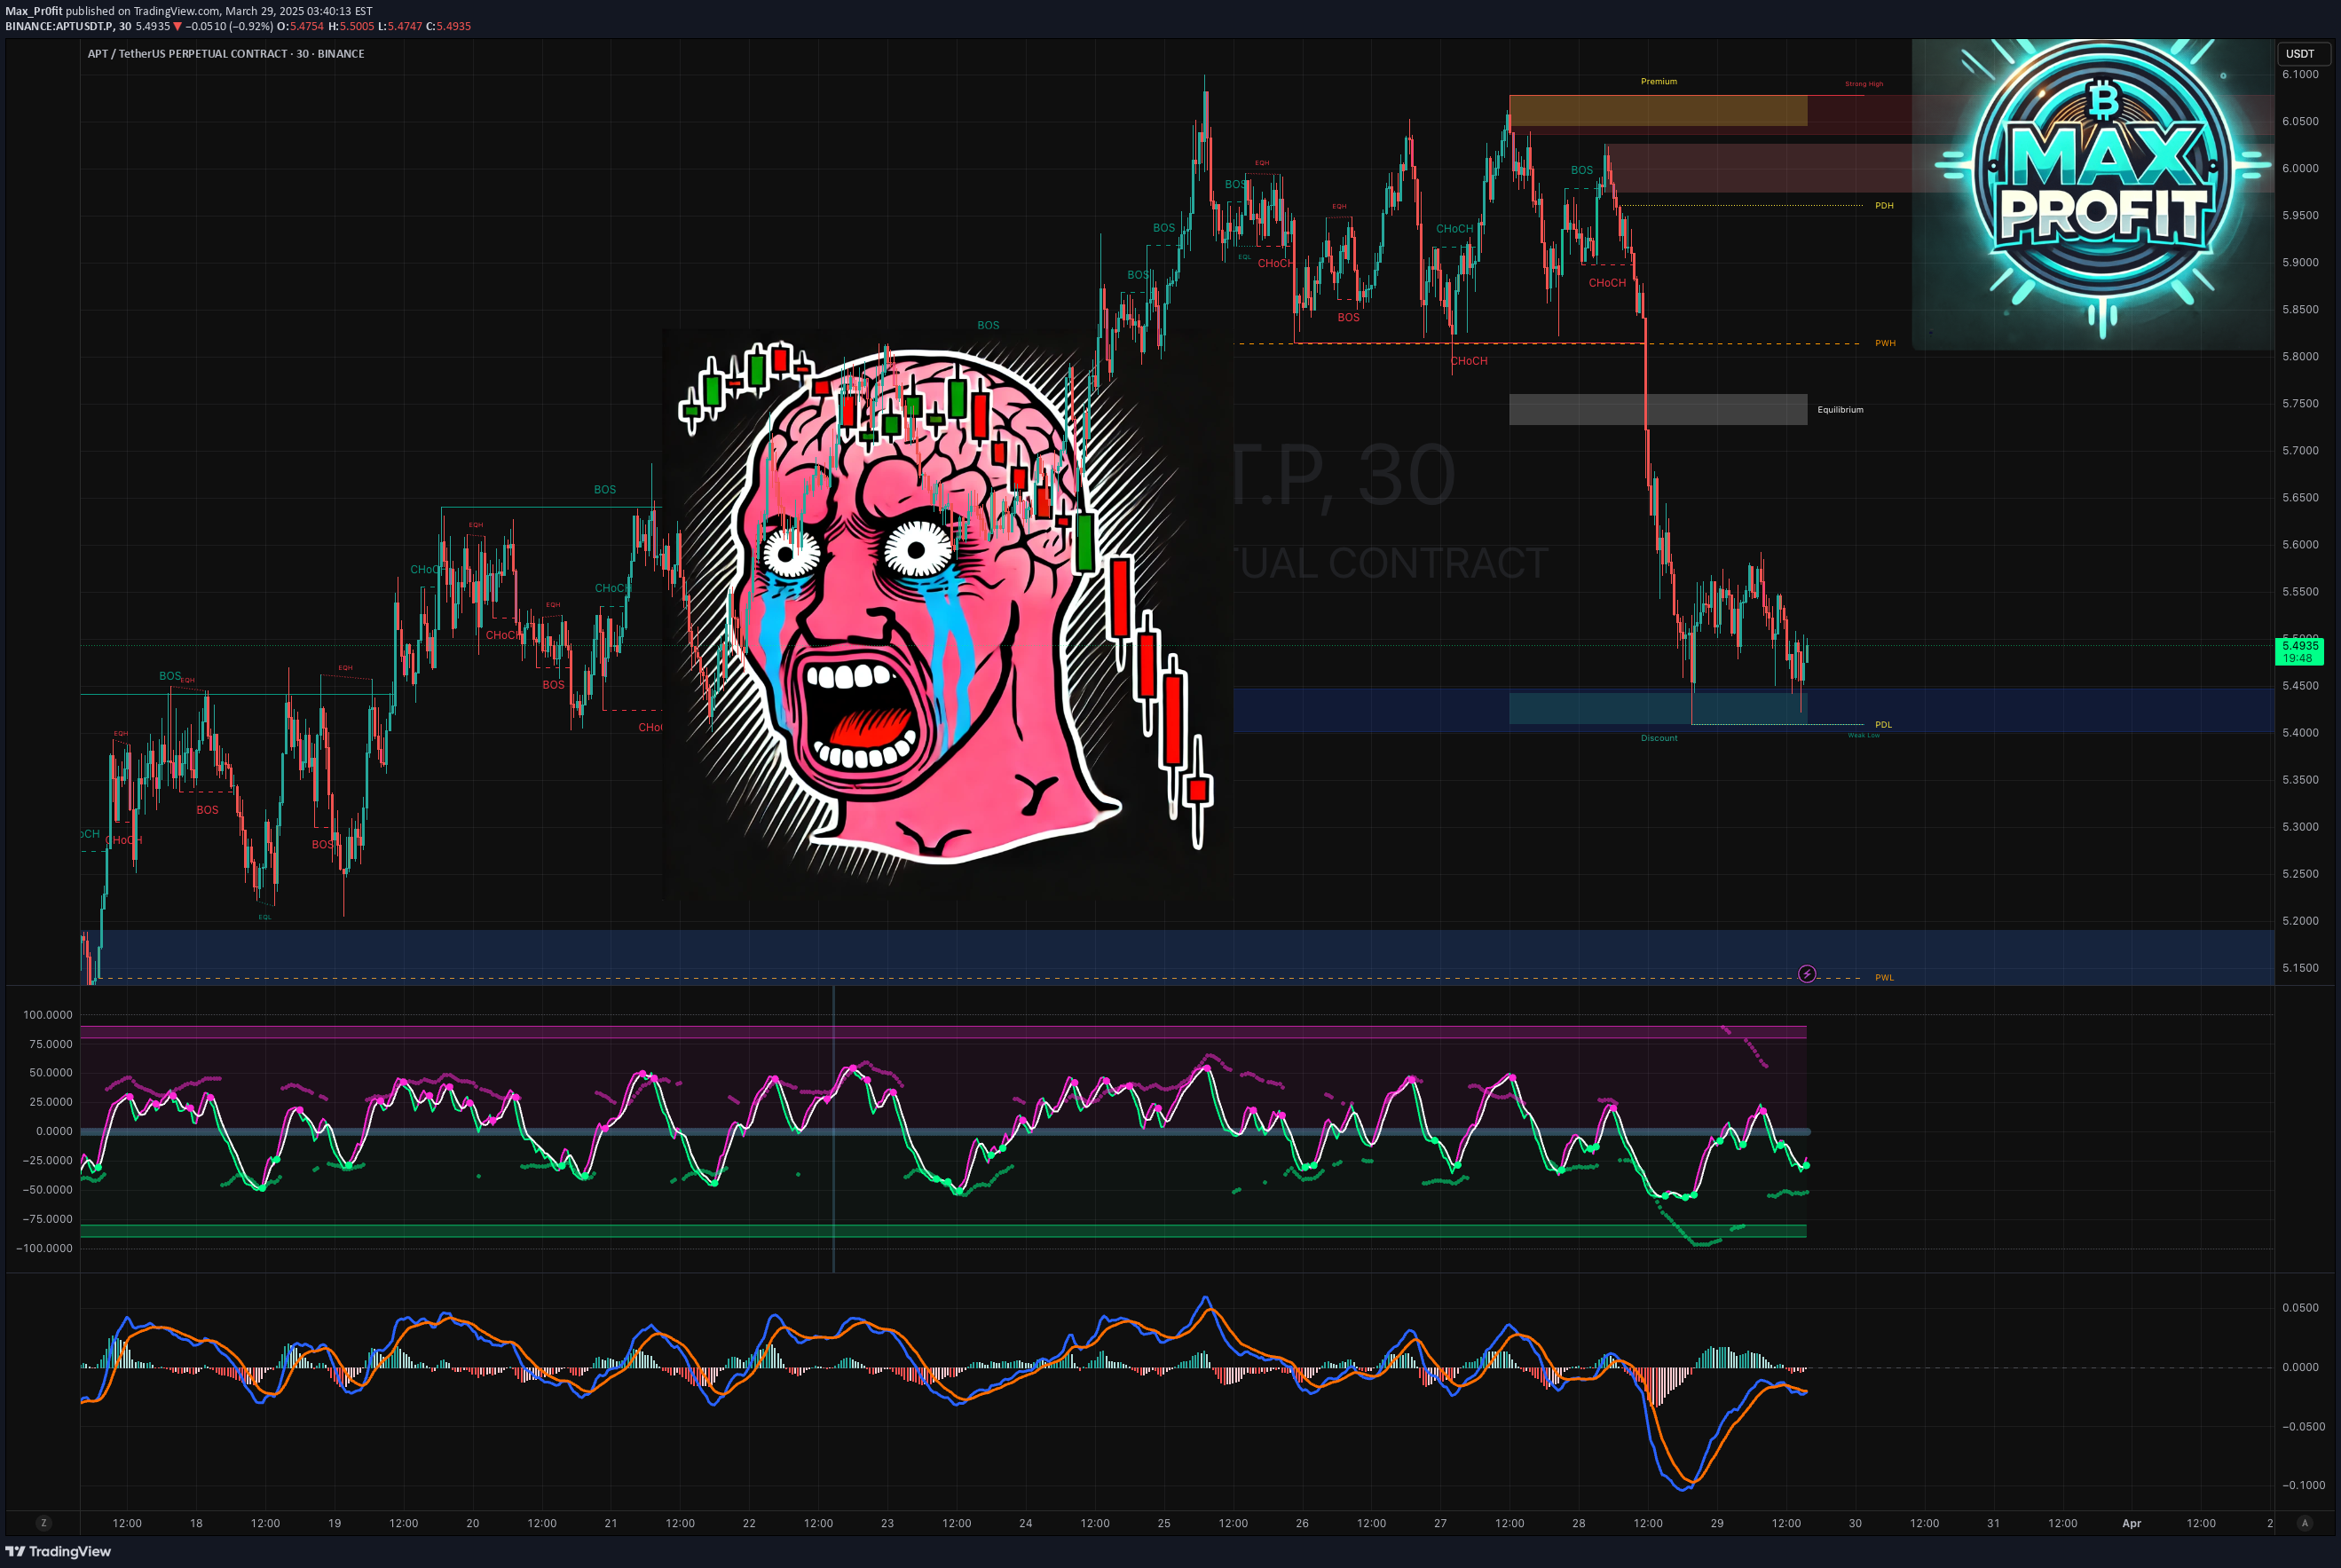
APTUSDT.P🚨 APTUSDT is sitting at a crucial level. After multiple CHoCH and BoS signals, price has dumped into the key Demand Zone (PDL). Now it’s either a spring up or a deeper dump to the next liquidity zone.📌 Technical Outlook:CHoCH → BoS → Liquidity Grab: Clear bearish structure.Equilibrium broken: Bulls failed to hold control.Now: Price is testing the blue Demand Zone (PDL) with big orders possibly resting.🎯 Trade Plan:Scenario 1: Long from support zoneEntry: bounce from 5.45–5.50 USDTStop-Loss: under wick low at <5.38 USDTTake-Profits:TP1: 5.70 USDTTP2: 5.90 USDT (Equilibrium zone)TP3: 6.00–6.15 USDT (Imbalance + Premium zone)Scenario 2: Short after PDL breakdownEntry: break and retest below 5.45 USDTStop-Loss: above 5.55 USDTTargets:TP1: 5.20 USDTTP2: 5.00 USDT📊 Confluence Factors:Volume spike = buyer activityLocal CHoCH inside zone = reversal signalStrong impulse down may sweep liquidity💬 Final Thought:APT is at a pressure point — it’s spring or capitulation. Clear setup, no tilt.Good signal + 3%
Max_Pr0fit
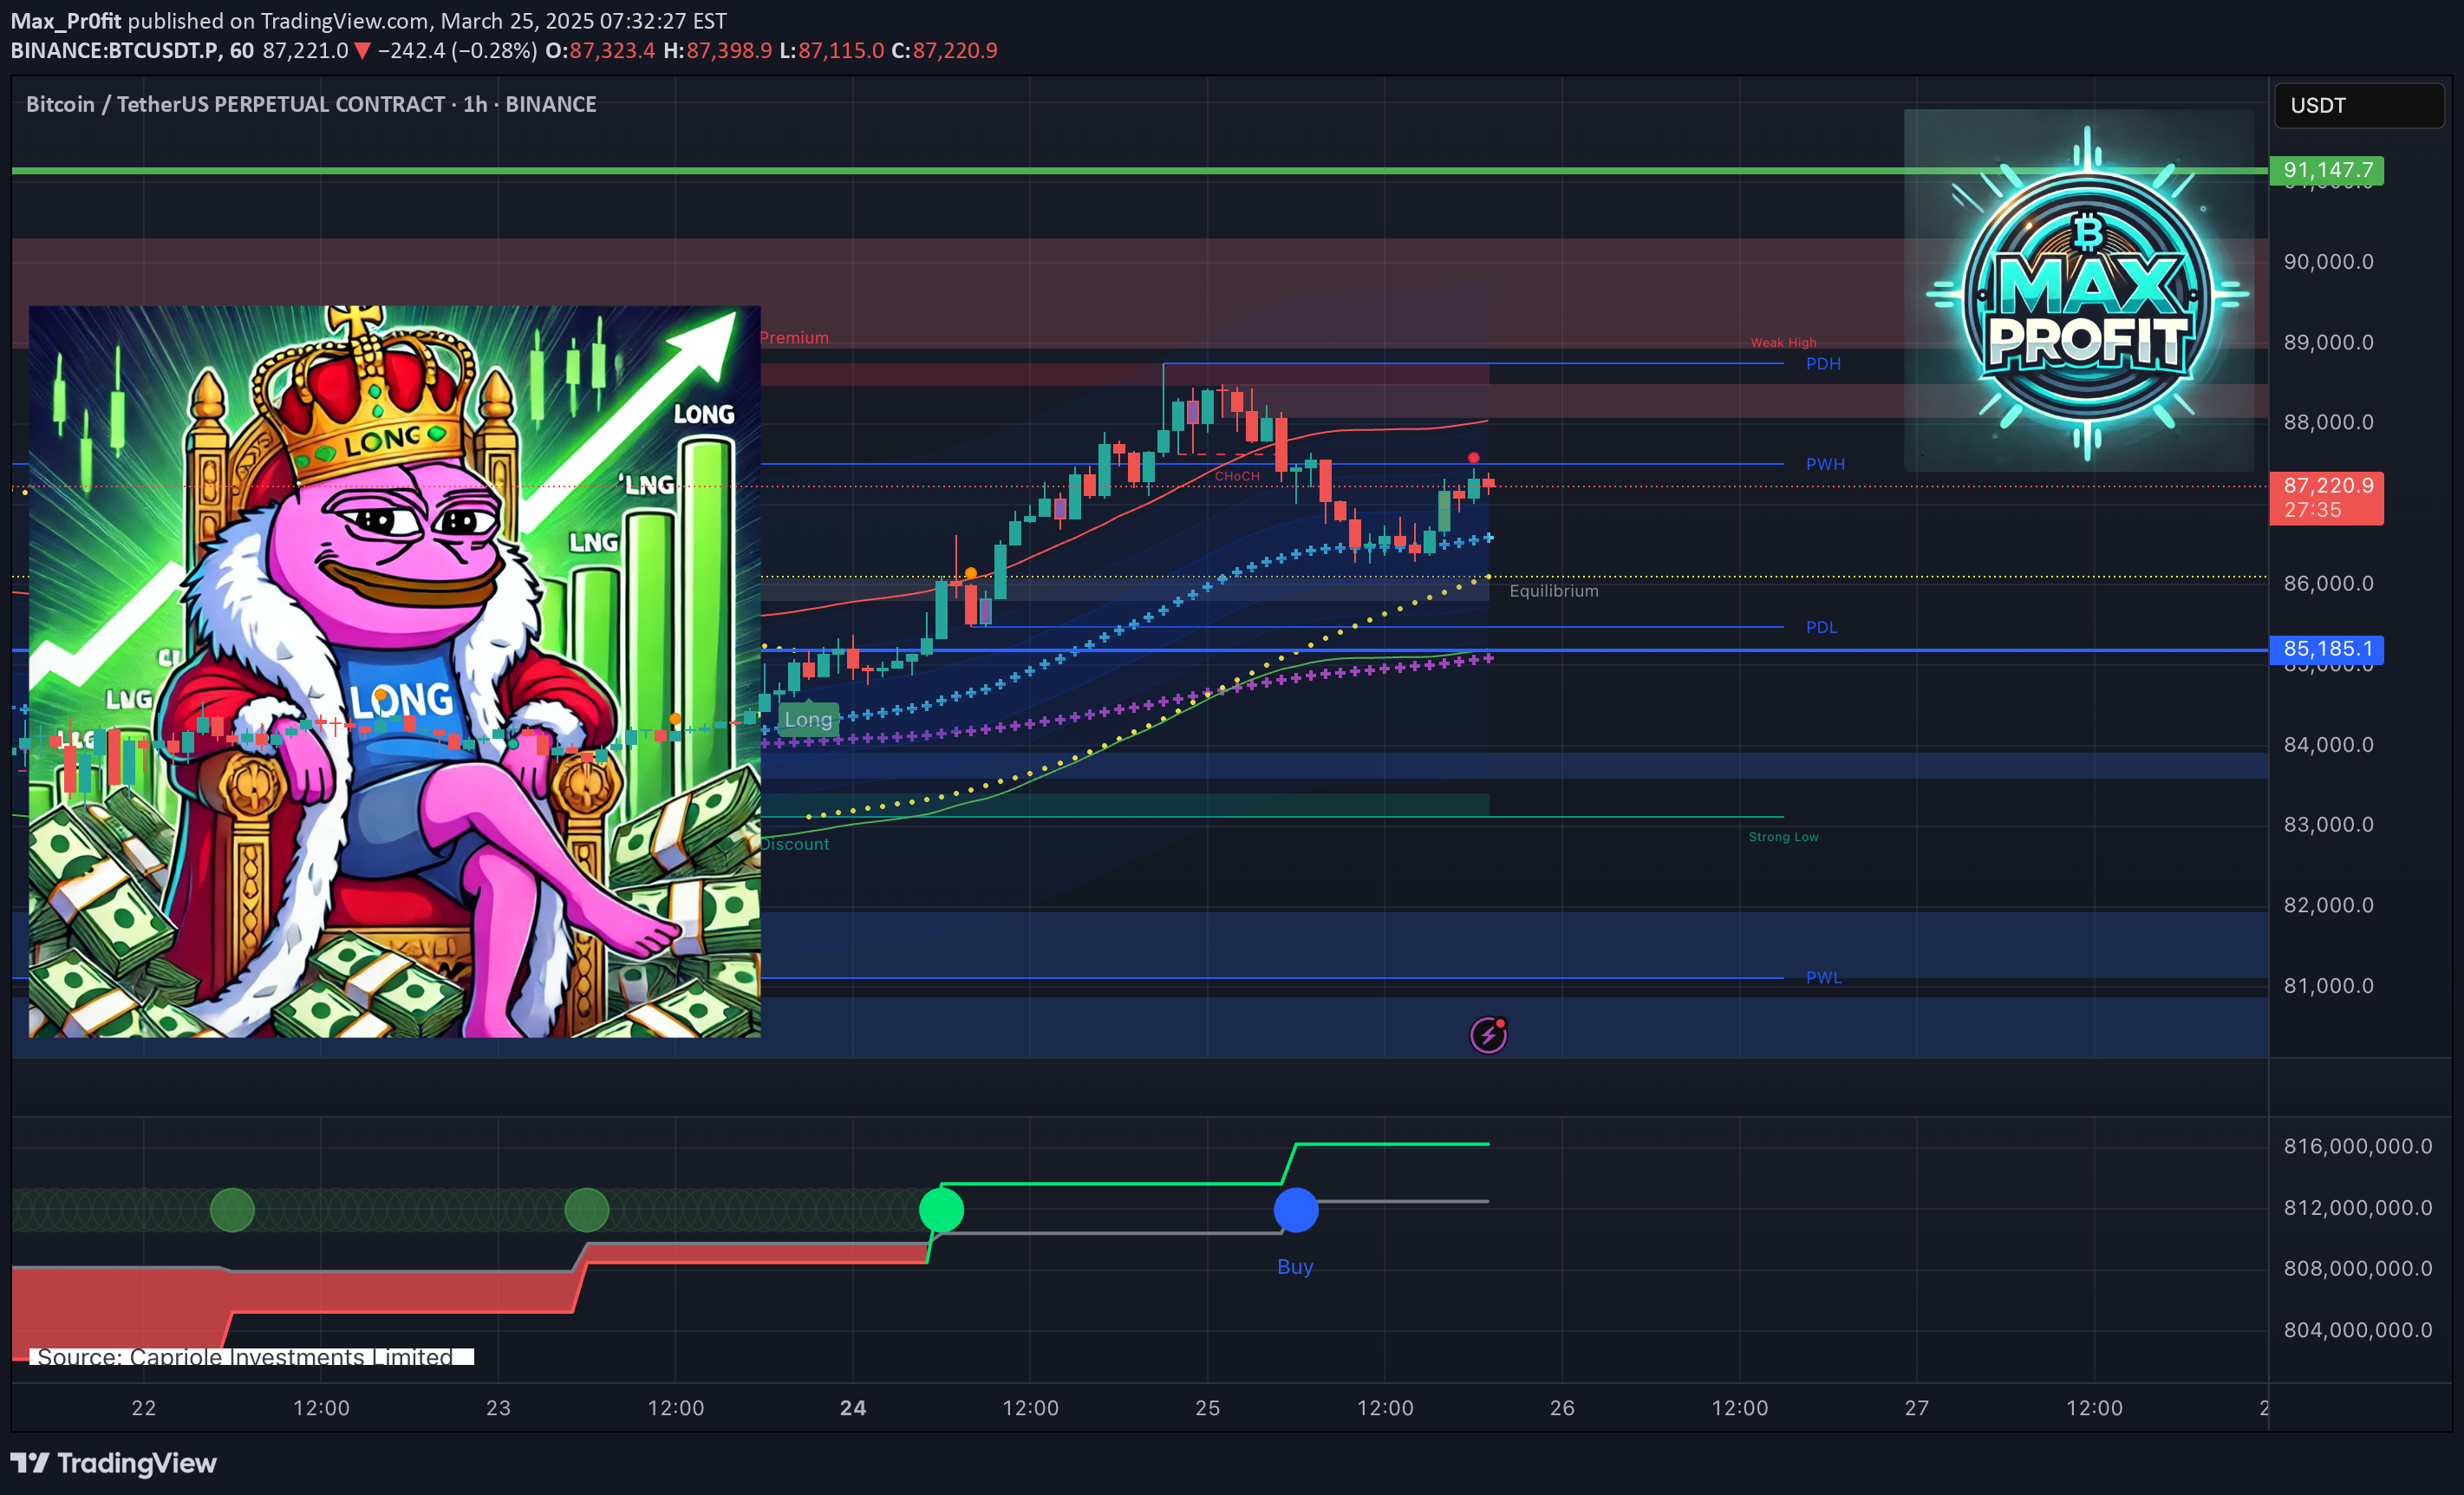
💥 The Hash Ribbon indicator has flashed a buy signal for the first time in 8 months. On the chart, we see a clear CHoCH (Change of Character) and price holding above the Equilibrium level — adding confluence for a bullish setup.Chart Highlights:Key support at 85,185 USDT (PDL zone).Parabolic SAR & EMA trendlines are confirming bullish bias.Resistance near 88,000–89,000 USDT could trigger short-term sell-offs.Conclusion:If BTCUSDT.P holds above the PWH level, momentum may push it toward the 90K zone. Bulls still in control — for now.
Max_Pr0fit
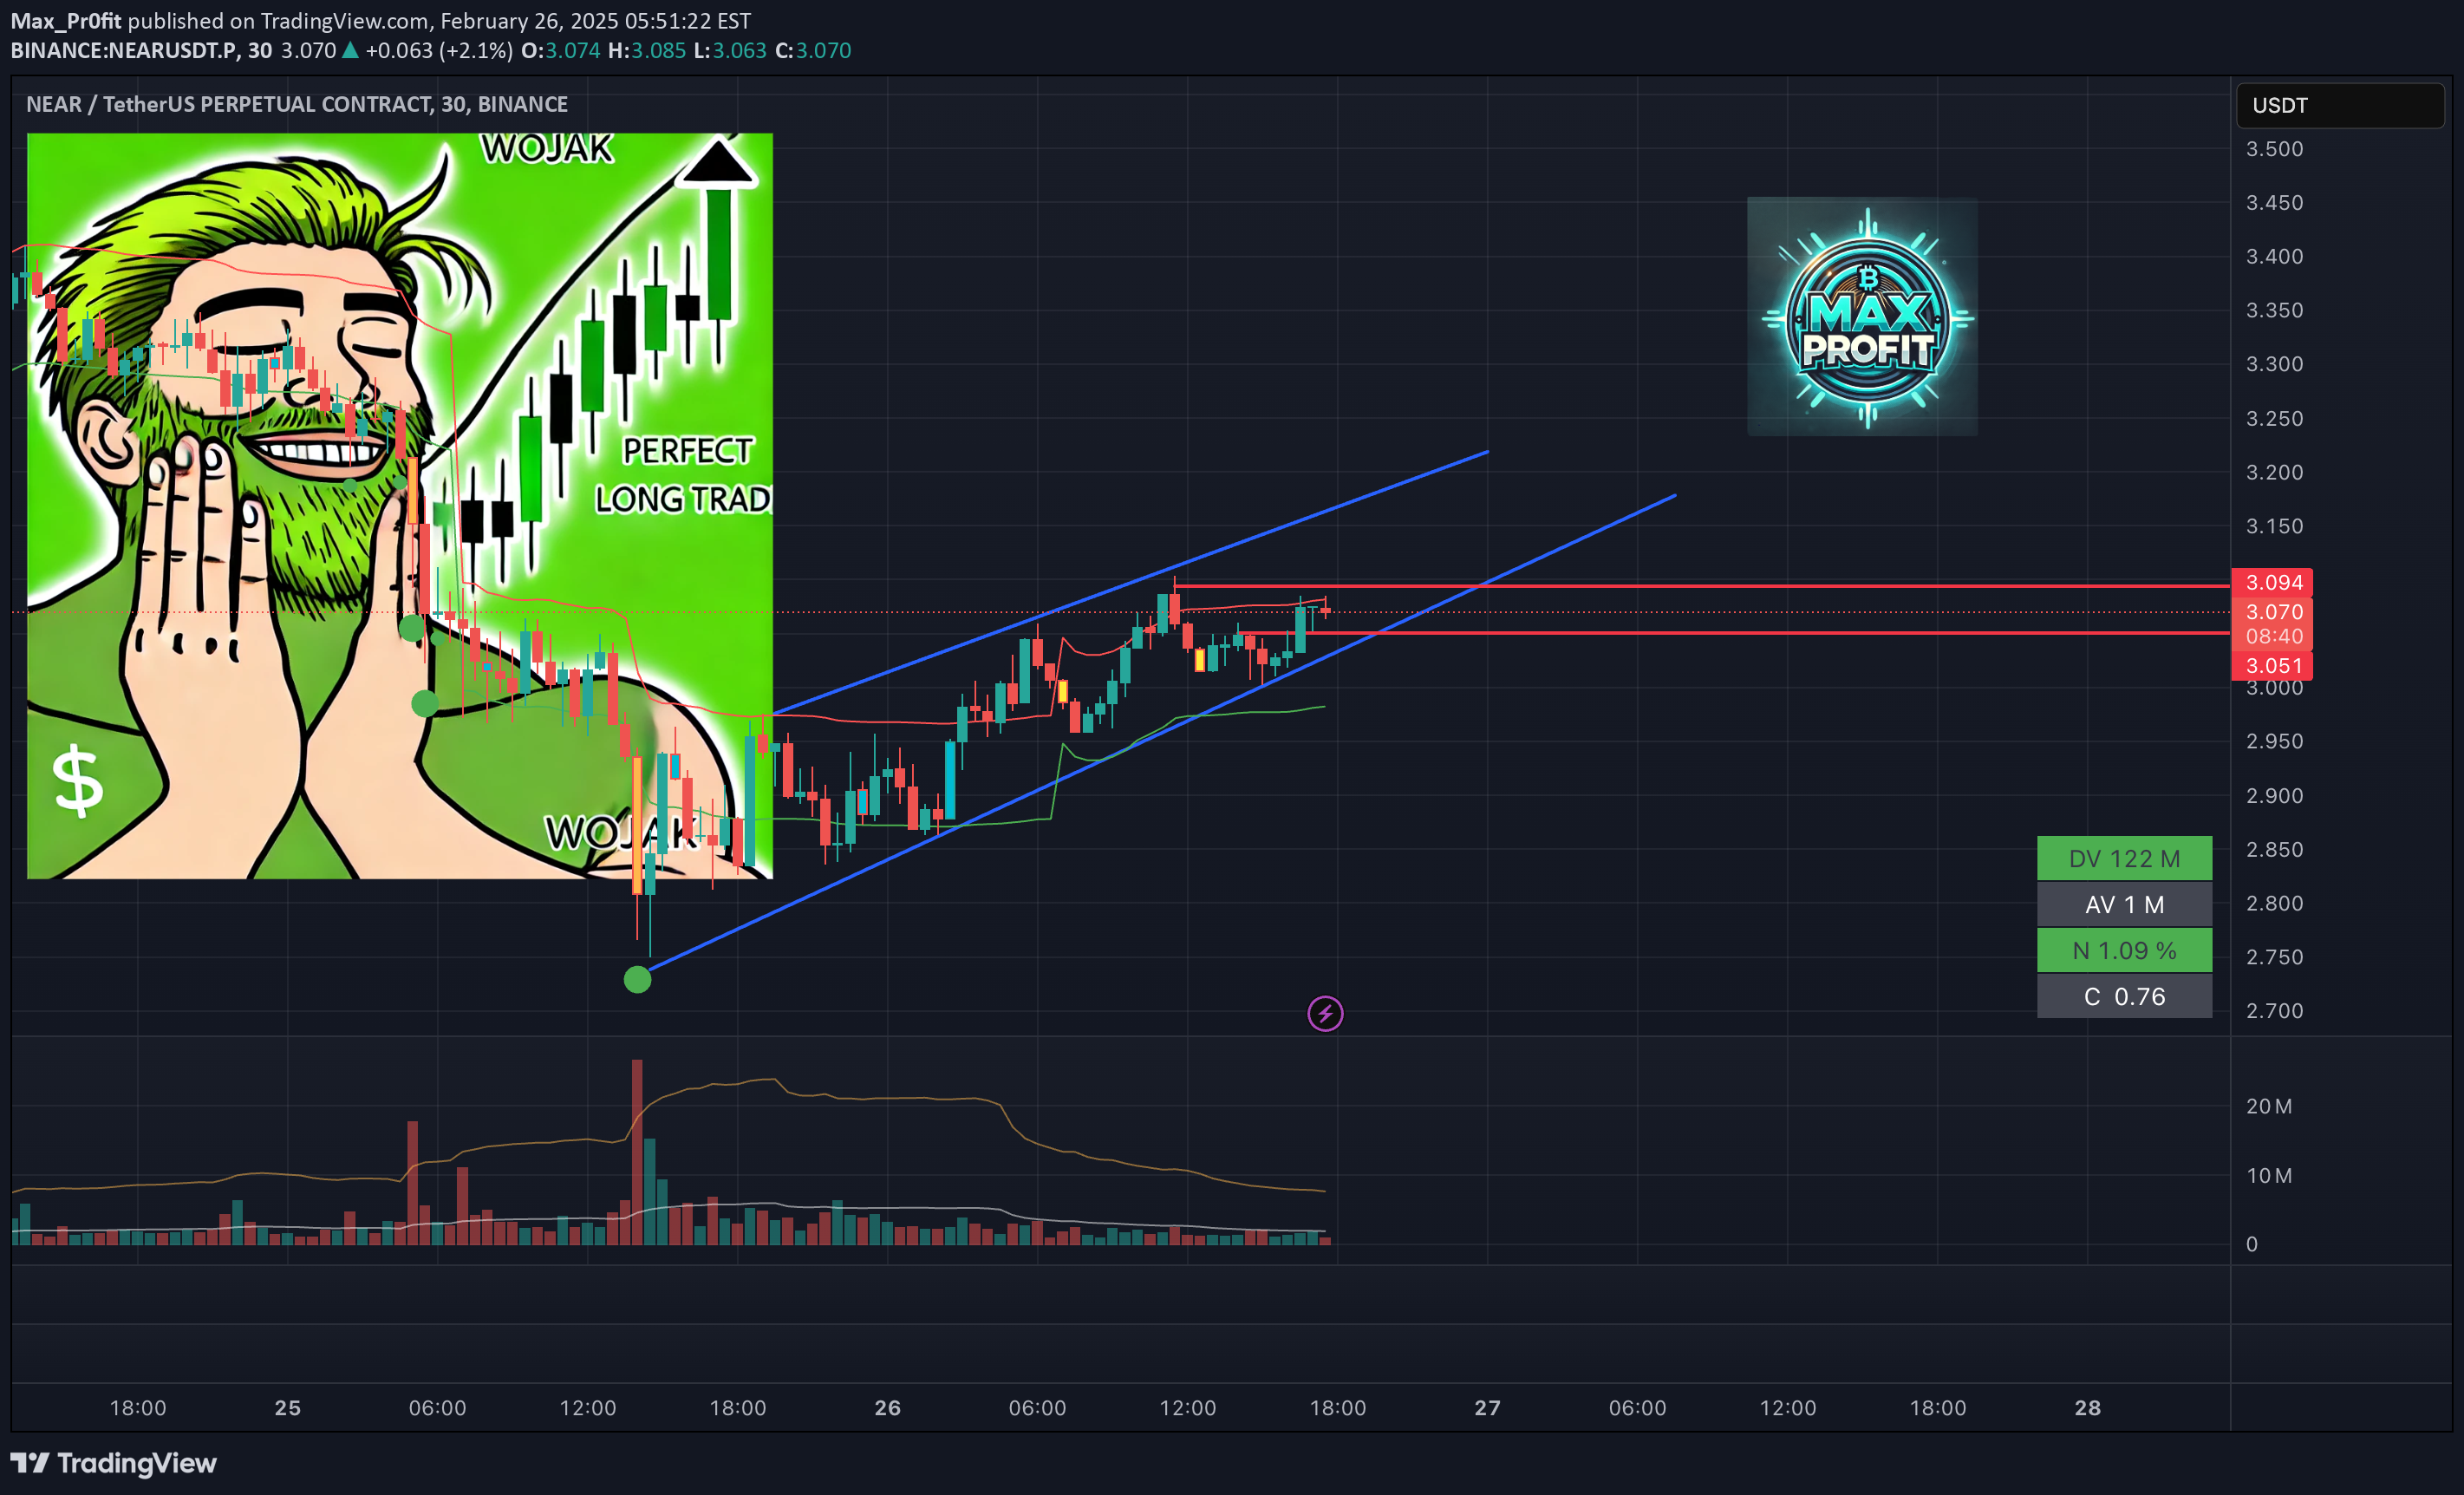
🚀 The price NEARUSDT.P is moving steadily inside an ascending channel, testing **3.080 USDT** resistance. If the breakout holds, we could see a push toward higher levels!🔑 **Key Levels:****Support:** * **3.051 USDT** – main level keeping the trend intact. * **3.000 USDT** – deeper support if retracement kicks in. **Resistance:** * **3.094 USDT** – key breakout point. * **3.150 USDT** – potential next stop for bulls. 🚀 **Trading Strategy:** **Long Entry:** After confirming a breakout above **3.094 USDT**. **Stop-Loss:** Below **3.051 USDT** – protecting against fakeouts. **Profit Targets:** **3.120 USDT** – quick scalp target. **3.150 USDT** – solid take-profit zone. **3.200 USDT** – full bullish extension if momentum builds. 📊 **Technical Outlook:** * Price respecting the channel = continuation likely. * Volume picking up – signals increasing bullish interest. * Failure to break resistance could lead to a pullback to support. 💡 **What to Watch?** * Watch for volume confirmation on breakout! * If resistance rejects, look for a retest at lower support before re-entering. * Bulls in control, but risk management is key. Are we heading for a breakout or a pullback? Drop your thoughts! 🚀🔥
Max_Pr0fit

Hey, traders! 😱📉 TONUSDT.P is in a high-risk zone, and the market is tense. We see the price testing support at *3.6191 USDT*, while resistance at *3.6891 USDT* is keeping the pressure on.The classic scenario: if support fails, we could see a sell-off. But what if the whales are lurking, ready to turn the price around?🔑 *Key Levels:**Support:** *3.6191 USDT* – bulls are defending this level aggressively. * *3.0087 USDT* – deep liquidity zone, where the price could drop if support breaks. **Resistance:** * **3.6891 USDT** – if sellers hold this level, the downtrend continues. * **3.8000 USDT** – a breakout above here could mean a bullish reversal. 🚩 *Trading Strategy:* *Short Entry:* After breaking *3.6191 USDT* with a retest. *Stop-Loss:* Above *3.6891 USDT* – if bears are wrong, it's time to exit. *Profit Targets:* *3.5000 USDT* – quick scalp target. *3.3000 USDT* – solid take-profit zone. *3.0087 USDT* – full breakdown potential if panic selling intensifies. 📈 *Technical Analysis Insights:* * Sellers are dominating – market structure remains bearish. * Volume shows liquidity accumulating in this range. * If we see a bounce from *3.6191 USDT*, a short squeeze could trigger a sharp move up. 💡 *What to Watch For?* * *Manage risk!* A downtrend doesn’t mean going all-in. * *Wait for confirmation!* No clear break = possible liquidity grab. * *Watch volume!* False breakouts are common without strong volume support. Is TONUSDT.P about to dump, or will bulls hold the line? Share your thoughts below! 🧐🔥
Max_Pr0fit

🔥 **SOLUSDT.P** is bouncing off the support zone, showing strength from the bulls! After a sharp dump, price held a key level and is now pushing up. The big question — is this a true reversal or just a "bearish retest" before another drop? ---🔑 **Key Levels:** **Support:** **171.06 USDT** — strong demand zone. **160.23 USDT** — critical level, breaking below could trigger more downside. **Resistance:** **199.55 USDT** — local resistance; breaking above could accelerate movement. **272.53 USDT** — key target for profit-taking. **295.16 USDT** — strong supply zone; breaking above opens the door to 300 USDT+. ---🚀 **Trading Strategy:** **Entry Point:** - Long from **171.06 USDT** with volume confirmation. - Conservative entry after a breakout of **199.55 USDT**. **Stop-Loss:** - Below **160.23 USDT** to avoid stop hunts. **Take-Profit Targets:** **198.45 USDT** — first target to reduce risk. **272.53 USDT** — primary target for the bullish move. **295.16 USDT** — extended target if the uptrend continues. ---📈 **Technical Analysis:** Increasing volume on the bounce signals strong buyer interest. A breakout above **199.55 USDT** confirms bullish momentum. If price drops below **171.06 USDT**, expect a potential retest of **160.23 USDT**. ---💡 **Conclusion:** SOLUSDT.P is showing bullish reversal signs, but without breaking **199.55 USDT**, we can't confirm a full trend shift yet. Is this just a retest before another sell-off or the start of a new uptrend? Let’s discuss! 🚀💬
Max_Pr0fit

Hey traders! Today we’re watching TURBOUSDT.P The price is consolidating around 0.0084450 USDT, testing a key resistance level. We’re seeing a classic ascending triangle forming — a textbook pattern before a big move. Will we see a breakout, or is this just another fakeout?---🔑 Key Levels:Support:0.0082000 USDT — a key level where buyers could step in again.0.0080000 USDT — the last line of defense before a potential drop.Resistance:0.0087261 USDT — the first barrier keeping price in check.0.0087928 USDT — the final line before a potential surge.---🚩 Trading Strategy:Entry Point:- Long entry on a confirmed breakout above 0.0087261 USDT with volume confirmation.Stop-Loss:- Place a stop below 0.0082000 USDT to avoid unnecessary drawdowns.Take-Profit Targets:0.0087928 USDT — the first level to lock in some profits.0.0090000 USDT — a target in case of a strong impulse.---📈 Technical Analysis:An ascending triangle is forming, signaling potential accumulation.Increasing volume near resistance indicates strong buyer interest.If the breakout fails, we may see a retest of support before another attempt.---💡 Conclusion:This setup looks promising, but confirmation is key. What do you think? Seeing order book liquidity or potential rejection signs? Let’s discuss in the comments!
Max_Pr0fit

Hey, traders! Today, we’re focusing on ETHUSDT. The price is trying to recover after a sharp dump, currently sitting at 3,345.52 USDT. We see a support level at 3,308.46 USDT, which has held up under pressure, but its retention remains critical.---🔑 Key Levels:Support:3,308.46 USDT — the key zone where buyers might keep the market steady.3,302.52 USDT — an additional defense level in case of renewed pressure.Resistance:3,360.00 USDT — the nearest target to test the bulls' strength.3,400.00 USDT — a zone for partial profit-taking if the upward momentum continues.---🚩 Trading Strategy:Entry Point:- Consider a long position after confirming the support at 3,308.46 USDT and observing a bullish impulse.Stop-Loss:- Place your stop below 3,302.52 USDT to minimize risks.Take-Profit Targets:3,360.00 USDT — the first profit-taking point.3,400.00 USDT — the final target for this upward move.---📈 Technical Analysis:The sharp volume dump indicates a liquidity grab attempt.If bulls can hold the 3,308.46 USDT level, recovery toward resistance is possible.It’s important to monitor volume and price reaction at key levels.---💡 Conclusion:Ethereum is clearly attempting to recover after a strong dump, but buyers must hold support. Will the market manage to reclaim lost ground? Share your thoughts in the comments!
Max_Pr0fit

Hey, traders! 🐂🐻Today’s radar is on PEOPLEUSDT, and the market is definitely "buzzing". The price is sitting at 0.04588 USDT, and we’ve seen it knock on the resistance at 0.04689 USDT a couple of times. What is that level? A wall of liquidity! Whales are clearly capping the price.Now, let’s get to business. The chart is forming an ascending triangle – a classic setup. If the price breaks through the liquidity up top, we’re in for a pump. But as they say, "don’t go all in until you see a clean breakout."🔑 Key Levels:Support: 0.04300 USDT – buyers are stacked here. If this level breaks, get ready for a dump.0.04100 USDT – the bulls’ last stand. Reaching here puts the trend at risk.Resistance: 0.04689 USDT – the critical level. Break it, and we’re flying; fail, and the whales keep pushing us down.0.04900 USDT – the first target to "skim the cream".0.05050 USDT – the ultimate target if the market picks up speed.🚩 Strategy:Entry Point:Enter long after a clean breakout above 0.04689 USDT (let the volume confirm it).Stop-Loss:Place stops below 0.04300 USDT to avoid "liquidity grabs".Take-Profit Targets: 0.04800 USDT – lock in some gains to avoid FOMO.0.04900 USDT – for those who like "cold, calculated moves".0.05050 USDT – the final stop when the market gives everything it can.📈 Technical Breakdown:The triangle is screaming: the market is gearing up for a move.Rising volumes – a signal that buyers are revving up.A retest of 0.04689 USDT before the breakout is a great chance for scalpers or those "hunting setups."💡 What’s next?The big question: are we catching a pump, or will it fizzle out? If 0.04689 USDT doesn’t break, expect bulls to pull the plug ("handbrake") and possibly some tilt for those who entered too early.Your thoughts? Maybe someone spots a sell wall or a divergence on the indicators? Share your observations – the collective mind wins, as they say. 🚀
Max_Pr0fit

30m TF. ZECUSDT is showing growth alongside increasing volumes, indicating heightened buyer interest. The price has reached 67.93 USDT and is targeting a breakout of key resistance.🔑 Key LevelsSupport:*67.45 USDT – the nearest support level where demand has been observed.*63.71 USDT – a stronger support level maintaining the current uptrend.Resistance:*75.33 USDT – the first target after a breakout.*76.88 USDT – the secondary resistance level.*79.50 USDT – the key target for profit-taking.🚩 Trading StrategyEntry Point:Consider opening a long position above 67.93 USDT.Stop-Loss:Place a protective stop order below 67.45 USDT to minimize risks.Take-Profit Targets:75.33 USDT – the first target for partial profit-taking.76.88 USDT – an intermediate target.79.50 USDT – the final target.📈 Technical AnalysisRising volumes confirm buyers’ readiness for further growth.A price consolidation above 67.93 USDT will strengthen the upward impulse.A retest of 67.45 USDT before the breakout could provide a good entry point.💡 RecommendationsMonitor Volumes: Increased volumes during the breakout will confirm the strength of the move.Manage Risks: Use sensible stop-loss orders to limit potential losses.Analyze Dynamically: Use smaller timeframes (15m and 1h) for precise entry points.ConclusionZECUSDT shows strong upward potential. Watch for a breakout above 67.93 USDT to take advantage of the current market conditions.
Max_Pr0fit

Current State: On the BTCUSDT chart, we observe a corrective movement after breaking the POC (Point of Control), which marks the area of maximum trading volume in the current range. The price tested the support level near 91,000 USDT, where buyers actively stepped in to prevent further decline.The previously broken ascending trendline now acts as resistance. The price is recovering and approaching the key resistance level at 94,000 USDT.🔑 Technical ContextPOC (Point of Control): The maximum trading volume level is located around 91,400 USDT and serves as a key demand zone.Support: A strong demand zone exists between 90,000–91,000 USDT, where significant buying volume was observed.Resistance: The area around 94,800 USDT acts as the nearest resistance. A breakout above this level may lead to higher targets.🚩 Trading StrategyPotential Scenarios:Bullish Breakout Scenario:If the price consolidates above 94,800 USDT, consider long positions with targets:96,500 USDT98,000 USDTContinuation of Correction:If the price fails to break the resistance, expect a retest of the 91,000 USDT support zone. A break below this area could lead to a further drop towards 88,500 USDT.Stop-Loss:For long positions: below 91,000 USDT.For short positions: above 94,800 USDT.📈 RecommendationsVolume Profile: Monitor volume accumulation near current levels to gauge market sentiment.Trendline Resistance: Consider the role of the broken ascending trendline as a resistance level.Risk Management: Use sensible stop-loss orders to minimize losses in case of adverse movements.ConclusionBTCUSDT is at a key juncture between resistance and support zones. Watch for price action near 94,800 USDT to determine the next directional move.
Disclaimer
Any content and materials included in Sahmeto's website and official communication channels are a compilation of personal opinions and analyses and are not binding. They do not constitute any recommendation for buying, selling, entering or exiting the stock market and cryptocurrency market. Also, all news and analyses included in the website and channels are merely republished information from official and unofficial domestic and foreign sources, and it is obvious that users of the said content are responsible for following up and ensuring the authenticity and accuracy of the materials. Therefore, while disclaiming responsibility, it is declared that the responsibility for any decision-making, action, and potential profit and loss in the capital market and cryptocurrency market lies with the trader.