
MarxBabu
@t_MarxBabu

What symbols does the trader recommend buying?
Purchase History
پیام های تریدر
Filter
MarxBabu
Bitcoin (BTCUSD) is showing interesting price action on the 3D

🔥 BTCUSD Analysis: Potential Move Ahead on the 3D Chart 📊 Bitcoin (BTCUSD) is showing interesting price action on the 3D chart, with signals indicating a possible correction or a breakout depending on key levels. Let's analyze the current situation and potential scenarios. 📈 Current Price:** $97,706** Potential Target:** $95,000 (Bearish) / $100,000 (Bullish) 🔑 Key Levels to Watch: 🔹 **Support Zone:** $96,000 - $95,000 🔹 **Resistance Zone:** $98,500 - $100,000 📊 Technical Insights: 🔸 **RSI Neutral:** No clear overbought or oversold signal yet. 🔸 **MACD Crossover:** Bearish signal on the 3D timeframe. 🔸 **Descending Trendline:** Acts as strong resistance. Pine Script® BTCUSD has been forming a potential descending wedge pattern, indicating a possible retest of the $95,000 level before a bounce. **Bearish View:** If BTCUSD loses $95,000 support, we may see an extended correction toward $92,000. **Bullish View:** A breakout above $98,500 could push the price back to $100,000 and beyond. ⚠️ **Note:** If BTCUSD drops below $95,000, more downside may be expected. ⚠️ 🔔 **Be sure to follow updated ideas for real-time insights!** 🔔 ⏰ **Analysis Time:** BTCUSD 3D chart, long-term perspective. ⚖️ **Always set a Stop Loss** to manage your risk! 🚨
MarxBabu
ETHUSD is showing signs of a possible correction

🔥 ETHUSD Analysis: Potential Correction Ahead 📉 ETHUSD is showing signs of a possible correction across multiple timeframes – **Daily**, **4-hour**, and **1-hour** – with current bearish signals emerging. 📉 Current Price:** $1,780** Potential Target:** $1,700 - $1,650 zone** 🔻 Key Levels to Watch: 🔹 **Immediate Support:** $1,750 - $1,700 🔹 **Resistance:** $1,800 - $1,850 🔒 Suggested Stop Loss:** Above $1,820** 📊 Technical Signals: 🔸 **RSI Falling:** Indicates weakening bullish momentum 🔸 **Descending Trendline:** Resistance holding strong 🔸 **Bearish Divergence:** Observed on the 4-hour chart Pine Script® ETHUSD is forming a descending triangle, increasing the likelihood of a bearish breakout toward the $1,650 support level. **Bearish View:** Expecting ETHUSD to drop to $1,650 if support at $1,700 fails. **Bullish View:** A breakout above $1,800 could push the price back toward $1,850 and beyond. ⚠️ **Note:** If ETHUSD falls below $1,650, we could see an extended correction to $1,600. ⚠️ 🔔 **Be sure to follow updated ideas for real-time insights!** 🔔 ⏰ **Analysis Time:** ETHUSD across multiple timeframes. ⚖️ **Always set a Stop Loss** to protect your capital! 🚨
MarxBabu
BTCUSD shows a clear downtrend

🚀 BTCUSD Analysis: Preparing for a Potential Move 📉 Analyzing BTCUSD across multiple timeframes – **Weekly**, **Daily**, and **4-hour** – suggests a bearish correction is imminent. 📉 Current Price:** $97,706** Potential Target:** $94,000 - $92,500 zone** 🔻 Key Levels to Watch: 🔹 **Immediate Support:** $95,000 - $94,000 🔹 **Resistance:** $100,000 - $102,500 🔒 Suggested Stop Loss:** Above $102,000** 📊 Technical Signals: 🔸 **RSI Overbought:** Indicates a possible correction 🔸 **Lower Highs:** Suggests weakening bullish momentum 🔸 **Bearish Divergence:** Detected on the 4-hour chart Pine Script® BTCUSD shows a clear downtrend, with potential for further downside after breaking the $95,000 support. **Bearish View:** Expecting a drop toward the $92,500 range if support at $95,000 fails. **Bullish View:** Breakout above $100,000 may resume the uptrend. ⚠️ **Note:** If BTCUSD falls below $92,500, we could see an extended bearish correction. ⚠️ 🔔 **Be sure to follow updated ideas for real-time insights!** 🔔 ⏰ **Analysis Time:** BTCUSD across multiple timeframes. ⚖️ **Always set a Stop Loss** to protect your capital! 🚨
MarxBabu
XRPUSD is showing consistent lower highs

📊 XRPUSD Analysis: Preparing for a Potential Downward Move Analyzing multiple timeframes – **22-day**, **Weekly**, **Daily**, and **4-hour** – shows signs of weakness in XRPUSD. 📉 Current Price:** $0.5270** Potential Target:** $0.4900 - $0.4700 zone** 🔻 Key Levels to Watch: 🔹 **Immediate Support:** $0.5000 - $0.4900 🔹 **Resistance:** $0.5400 - $0.5500 🔒 Suggested Stop Loss:** Above $0.5550** 🔍 This analysis is based on trend breakdowns, moving averages, and volume patterns confirming bearish momentum. Pine Script® XRPUSD is showing consistent lower highs, aligning with the bearish outlook. **Bearish View:** Expecting a drop towards the $0.4900 range if support at $0.5000 fails. **Bullish View:** Breakout above $0.5500 may reverse the trend. ⚠️ **Note:** If XRPUSD breaks below $0.4900, a deeper correction could follow. ⚠️ 🔔 **Be sure to follow updated ideas for real-time insights!** 🔔 ⏰ **Analysis Time:** XRPUSD across multiple timeframes. ⚖️ **Always set a Stop Loss** to protect your capital! 🚨
MarxBabu
BTCUSD's lower high formation aligns with a potential short-term

📊 Analyzing **BTCUSD** across multiple timeframes: **22-day time frame**, **Weekly time frame**, **Daily time frame**, and **4-hour time frame**. 📉 BTCUSD is currently trading around **$97,706** and showing signs of a potential pullback. A correction towards the support level at **$95,000 - $93,500** seems likely based on current price action. 🔻 Key Levels to Watch: 🔹 **Immediate Support:** $95,000 - $93,500 zone. 🔹 **Resistance Levels:** Watch for rejection around $98,500 - $99,000. 🔒 Stop Loss can be placed above $99,500 to minimize risk. 🔍 We are using trend analysis, Fibonacci levels, and volume confirmation to identify this setup. Pine Script® BTCUSD's lower high formation aligns with a potential short-term downtrend. **Bearish View:** Expecting a drop towards $95,000 if current levels fail. **Bullish View:** Only a breakout above $99,000 can invalidate this view. ⚠️ Always confirm price action before entering. Risk management is key! 🚨 ⚠️ **Note:** If BTCUSD breaks below $93,500, further decline may accelerate. ⚠️ 🔔 **Be sure to follow the updated ideas for real-time insights!** 🔔 ⏰ **Analysis Time:** BTCUSD across multiple timeframes. ⚖️ **Do not forget to set a Stop Loss** for risk management! Protect your capital! 🔒
MarxBabu
Gold looks weak short

📊 Analyzing **Gold (XAUUSD)** across multiple timeframes: **22-day time frame**, **Weekly time frame**, **Daily time frame**, and **4-hour time frame**. 📉 Gold is likely to decline from **$2,797** to **$2,700**, forming a potential short setup. Key resistance has been identified, and a downward move is expected in the short term. 🔒 Stop Loss can be set above resistance to manage risk effectively. 🔍 We are using key support and resistance levels to identify this trade setup. Pine Script® Gold is approaching a crucial resistance zone, indicating a possible rejection. **Bearish View:** Expecting a move from **$2,797** down to **$2,700**. **Bullish View:** If Gold breaks above **$2,797**, further upside may follow. 🌟 This setup presents a very interesting opportunity! Watch price action near **$2,797** for confirmation. 📉 ⚠️ **Note:** Further downside is expected if Gold breaks below **$2,700**. ⚠️ 🔔 **Be sure to follow the updated ideas for real-time insights!** 🔔 ⏰ **Analysis Time:** Gold (XAUUSD) across multiple timeframes. ⚖️ **Do not forget to set a Stop Loss** for risk management! Protect your capital! 🔒 💡 **Follow your trading plan; this is just my analysis. I’d love to see your thoughts in the comments!** ✅ **Don't forget to hit the 'Like' button** ✅ 🙏😊 & share it with your friends; thanks, and happy trading! 📉
MarxBabu
Gold (XAUUSD) Targeting $2,790 in Upcoming Rally

Gold has shown strong bullish momentum recently, with technical indicators pointing toward a potential rally to the $2,790 level. This target aligns with key resistance levels and is supported by ongoing market conditions that favor safe-haven assets. Key Highlights: Price Target: $2,790 Market Sentiment: Bullish on safe-haven demand and macroeconomic factors driving gold’s value. Technical Support: Strong base established around current support levels, building a solid foundation for this potential uptrend. 📌 Trading Plan: Consider entering on dips or confirmation signals of breakout above recent highs. Tight stop-losses near support levels are recommended to manage risk effectively in this setup. 🚨 Disclaimer: This is not financial advice. Perform your own analysis before investing.The price is moving in sideways ,channel is not broken yet .Gold not respected the Channel ,Heavy fall damaged the analysis .
MarxBabu
BTCUSD: Volume Surge Signals Potential Breakout to $70K

Title: BTCUSD: Volume Surge Signals Potential Breakout to $70K Overview: Hello Traders, BTCUSD is experiencing a surge in volume alongside a notable price breakout, suggesting a potential rally towards the $70,000 mark. BTCUSD Key Points: - BTCUSD is witnessing a significant surge in trading volume, indicating heightened market activity and increasing interest in the cryptocurrency. - The price breakout signals a potential bullish momentum shift, with traders eyeing a move towards the psychologically significant level of $70,000. - Market sentiment appears to be overwhelmingly positive, with investors anticipating further upside potential in BTCUSD's price trajectory. Technical Analysis: BTCUSD's price chart exhibits clear signs of a breakout, with price action breaking above key resistance levels and forming higher highs. The surge in volume confirms the strength of the bullish momentum and supports the likelihood of a continued uptrend. Conclusion: With BTCUSD demonstrating strong volume and a decisive price breakout, traders may anticipate a rally towards the $70,000 level in the near term. However, it's important to exercise caution and monitor price action closely for confirmation of the bullish trend continuation. Don't Forget to Engage: Please LIKE 👍 FOLLOW ✅ SHARE 🙌 COMMENT ✍ If you found this idea insightful! Your engagement contributes to the community's knowledge and helps broaden the reach of valuable insights. Leave your feedback in the comment section below or by boosting /Liking this. See you in the next idea post. Happy trading!
MarxBabu
MSTR Long Momentum Seen: New High Possible?
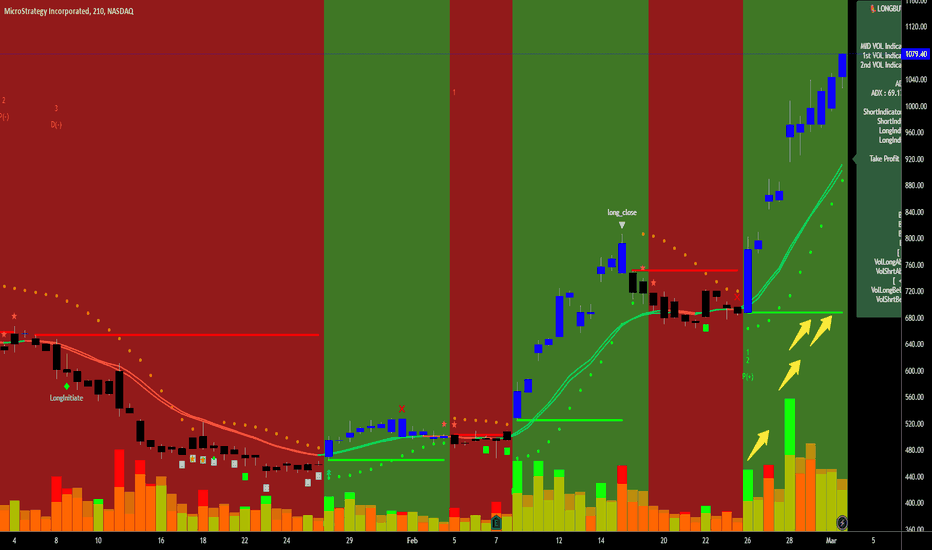
Title: MSTR Long Momentum Seen: New High Possible? Overview: Hello Traders, MSTR is showing strong long momentum with high volume, fueling speculation of a potential push towards new highs. MSTR Key Points: - MSTR is exhibiting robust long momentum, supported by high trading volume, suggesting significant buying interest in the stock. - The combination of strong momentum and high volume often indicates a continuation of the current uptrend, potentially leading MSTR to achieve new highs. - Traders are closely monitoring MSTR's price action for confirmation of the bullish trend continuation and potential entry points for long positions. Technical Analysis: MSTR's price chart displays clear signs of bullish momentum, with price consistently making higher highs and higher lows. Volume indicators confirm strong buying pressure, reinforcing the bullish bias and suggesting further upside potential. Conclusion: With MSTR demonstrating strong long momentum and high volume, traders may anticipate a push towards new highs. However, it's essential to remain vigilant and monitor price action closely for confirmation of the uptrend continuation before entering into new positions. Don't Forget to Engage: Please LIKE 👍 FOLLOW ✅ SHARE 🙌 COMMENT ✍ If you found this idea insightful! Your engagement contributes to the community's knowledge and helps broaden the reach of valuable insights. Leave your feedback in the comment section below or by boosting /Liking this. See you in the next idea post. Happy trading!
MarxBabu
GLMUSD Consolidates After 80% Long Move: What's Next?

Title: GLMUSD Consolidates After 80% Long Move: What's Next? Overview: Hello Traders, GLMUSD has entered a consolidation phase following an impressive 80% long move, prompting traders to anticipate its next move. GLMUSD Key Points: - GLMUSD recently experienced a substantial 80% long move, reflecting strong bullish sentiment and investor interest in the cryptocurrency. - However, the price has since entered a consolidation phase, indicating a period of price stabilization and indecision among market participants. - Traders are closely monitoring GLMUSD's price action for signs of directionality, as consolidation often precedes a continuation of the previous trend or a reversal. Technical Analysis: GLMUSD's price chart shows clear evidence of consolidation, with price action confined within a narrow range and volatility diminishing. Technical indicators reflect the market's indecision, suggesting a period of uncertainty before the next significant move. Conclusion: As GLMUSD consolidates after its remarkable long move, traders should exercise patience and wait for a clear breakout or breakdown before establishing new positions. It's essential to monitor key support and resistance levels for potential trading opportunities and adjust strategies accordingly. Don't Forget to Engage: Please LIKE 👍, FOLLOW ✅, SHARE 🙌, and COMMENT ✍ if you found this idea informative! Your engagement helps foster discussion and enrich the trading community. Trading based on this analysis carries inherent risks. Conduct your own research and consult with a financial advisor before making any investment decisions. Happy trading!
Disclaimer
Any content and materials included in Sahmeto's website and official communication channels are a compilation of personal opinions and analyses and are not binding. They do not constitute any recommendation for buying, selling, entering or exiting the stock market and cryptocurrency market. Also, all news and analyses included in the website and channels are merely republished information from official and unofficial domestic and foreign sources, and it is obvious that users of the said content are responsible for following up and ensuring the authenticity and accuracy of the materials. Therefore, while disclaiming responsibility, it is declared that the responsibility for any decision-making, action, and potential profit and loss in the capital market and cryptocurrency market lies with the trader.