
MarkitMaven
@t_MarkitMaven

What symbols does the trader recommend buying?
Purchase History
پیام های تریدر
Filter
MarkitMaven
Does the Market Rally When the Fed Begins to Cut Rates?
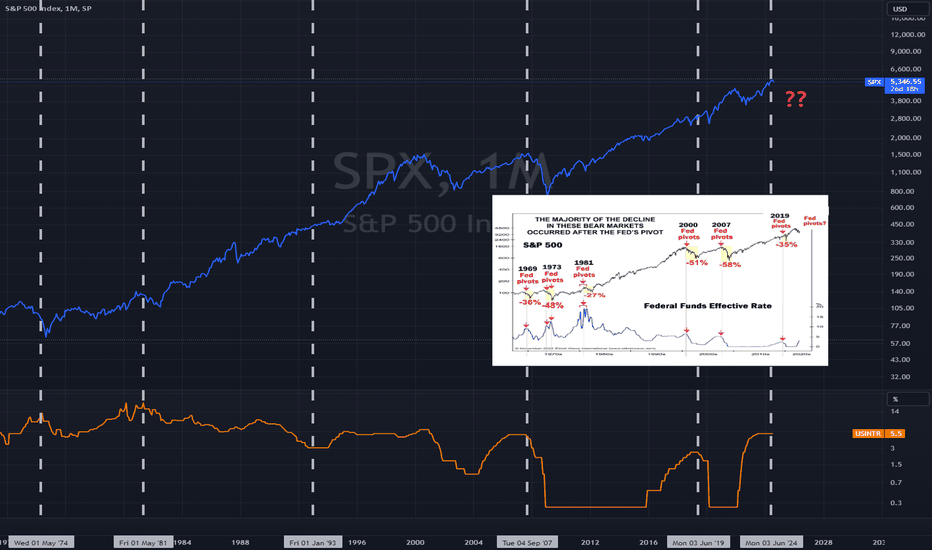
The relationship between rate cuts and the stock market, as illustrated in the provided graph, shows that major market declines often occur after the Federal Reserve pivots to lower interest rates. This pattern is evident in historical instances where the Fed's rate cuts were followed by significant drops in the S&P 500. Several factors contribute to this phenomenon, which are crucial for investors to understand. Economic Weakness: Rate cuts typically respond to economic slowdown or anticipated recession. Each instance of the Fed pivoting to lower rates (1969, 1973, 1981, 2000, 2007, 2019) corresponds to significant market declines soon after. Rate cuts signal concerns about economic health, causing investors to lose confidence, as reflected in the graph. Delayed Impact: Rate cuts do not immediately stimulate the economy; it takes time for their effects to propagate. The graph shows that the majority of the market decline occurs after the Fed's pivot, indicating that initial rate cuts were insufficient to halt the downturn. During this lag period, the market may continue to decline as economic data reflects ongoing weakness. Investor Sentiment: Rate cuts can trigger fear among investors, who interpret the move as an indication of severe economic issues. The graph shows substantial percentage drops in the S&P 500 following each pivot, demonstrating how negative sentiment can exacerbate declines. The fear of a worsening economy leads to a sell-off in stocks, contributing to further market drops. Credit Conditions: During economic stress, banks may tighten lending standards, reducing the effectiveness of rate cuts. Post-rate cut periods in the graph align with times of economic stress, where credit conditions likely tightened. Businesses and consumers may not be able to take advantage of lower borrowing costs, limiting economic recovery and impacting the market negatively. Historical examples such as the crises in 2000 and 2007 highlight substantial market drops after rate cuts, as seen in the graph. In both cases, the rate cuts responded to bursting bubbles (tech bubble in 2000, housing bubble in 2007), and the economic fallout was too severe for rate cuts to provide immediate relief. The graph underscores that while rate cuts aim to stimulate the economy, they often follow significant economic downturns. Investors should be cautious, recognizing that initial market reactions to rate cuts can be negative due to perceived economic weakness, delayed policy impact, and deteriorating sentiment.We are also expecting the housing situation to resolve soon. As the rates are dropping, many new home buyers are going to bailout and increase the supply. Institutions would also have to release their properties to deal with the incoming recession. The false narrative that many realtors are spreading these days is not pan out. But the good news is, most millennials are soon going to be homeowners with low rates and affordable pricing!
MarkitMaven
Is The US Stock Market Overvalued? Ask Buffet Indicator.
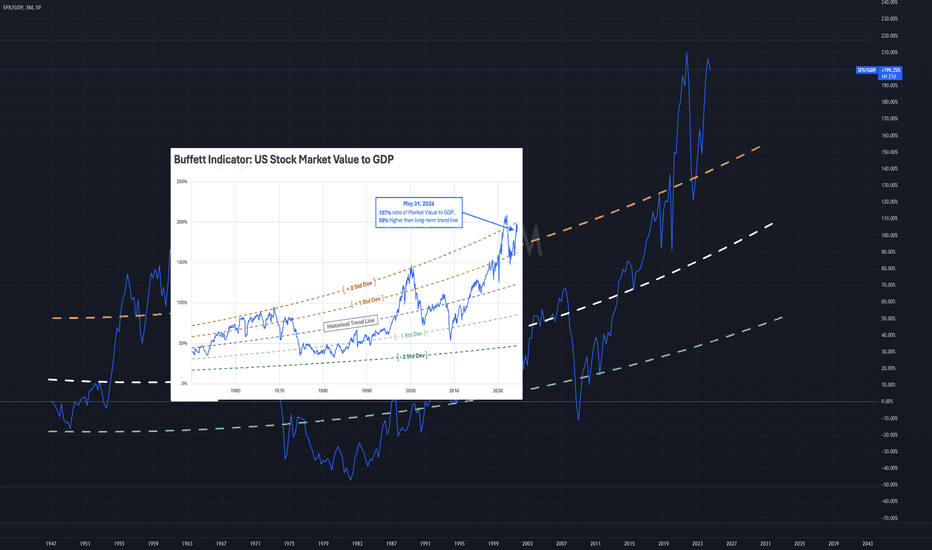
The Buffett Indicator, named after renowned investor Warren Buffett, is a popular metric used to assess the valuation of the US stock market by comparing it to the nation's Gross Domestic Product (GDP). This ratio provides a clear picture of how the market's value stacks up against the economy's overall output. Understanding the Buffett Indicator - Buffett Indicator measures the ratio of total US stock market value to GDP. - Current value: 197% as of May 31, 2024. - Historical trend suggests a typical value closer to 100%. - 1.9 standard deviations above the trend line indicates significant overvaluation. Market Growth vs. Economic Growth - High Buffett Indicator value suggests a potential market bubble. - Disparity between market growth and economic output. - Historically, high ratios have led to market corrections. - Overvalued markets increase the risk of significant retracements. Impact of Interest Rates - Low interest rates drive investors towards equities, inflating stock prices. - Bonds offer lower returns, pushing capital into the stock market. - Rising interest rates could shift money back to bonds, pressuring stock prices. - The indicator's high value underscores the risk of a correction if interest rates increase. International Sales and Overvaluation - The indicator does not account for international sales of US companies. - Global revenues can distort the picture of domestic economic health. - High Buffett Indicator may reflect these global sales, adding to overvaluation. - Investors should consider conservative strategies until valuations return to historical norms.
MarkitMaven
ETH.X: Everything points to one direction.
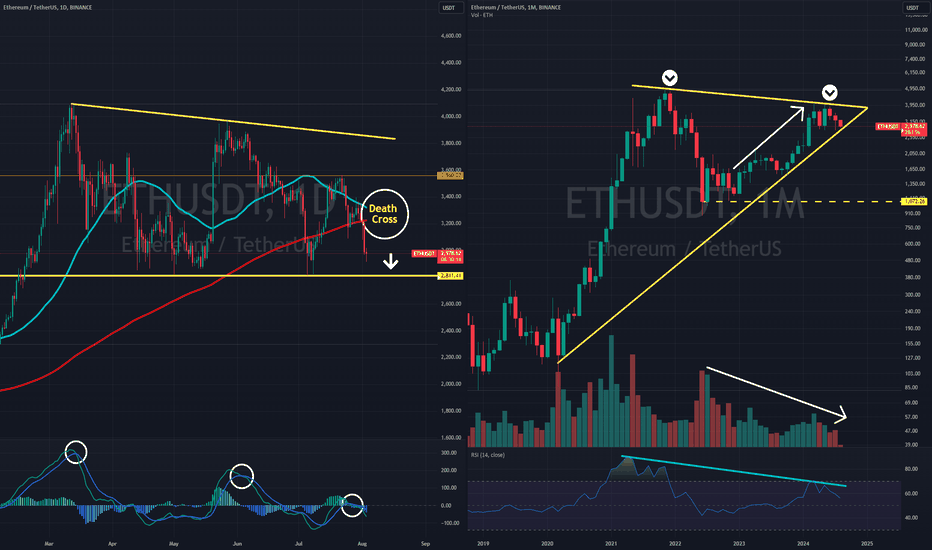
There is no reason to be long here but here is all the signals to go short: Death cross Rising wedge Double top MACD cross down RSI divergenceboth lines broke down. We will see 1000 soon.continues to trend lower.
MarkitMaven
BTC.X: Wyckoff and Elliot Analysis

In addition to the risk of bearish death cross, both Wyckoff and Elliot analysis are pointing to a high risk of further drops. Hoping the rising wedge does not break down, our conservative target remains between 37-39k.Also see:Wyckoff playing out tick by tick!
MarkitMaven
BTC.X: Bearish Death Cross Approaching

The left panel shows daily 50ma and 200ma approaching to form a death cross sometime in August. Last time we saw a death cross during a bull market reversal was in 2022 and prices dropped nearly ~70%. With current integration of Bitcoin in financial markets, we estimate to retest the trendline forming since lows of 2019 at 37k sometime in 2025, with a conservative estimate of 50% downturn from current prices.back to 55k and soon to break below 50k toward 45k
MarkitMaven
SPX: Sector Performance and Economic Outlook
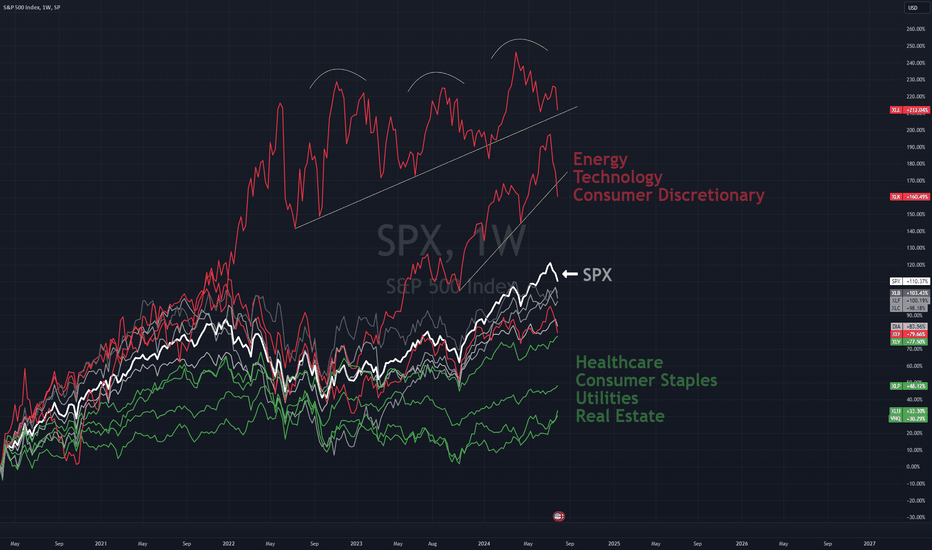
The chart shows the strong past performance of the Energy and Technology sectors, which have significantly outpaced the S&P 500. Technology saw a 55% increase in 2023 and continued to perform well into 2024. Energy, despite some volatility, remains strong due to high oil prices and investments in production infrastructure. On the other hand, sectors like Healthcare, Consumer Staples, Utilities, and Real Estate have underperformed, showing steady but modest growth compared to other sectors. Looking ahead, the outlook for Technology, Energy, and Consumer Discretionary sectors is bearish. Rising inflation and the potential for a recession are expected to drive these sectors lower. Meanwhile, Healthcare, Consumer Staples, Utilities, and Real Estate are anticipated to continue their upward trend due to their defensive nature. Financials, Communications, and Industrials are likely to remain stable without significant moves until there are interest rate cuts. Given the current economic conditions, it's prudent to focus on more stable investments amid ongoing inflation and recession concerns.seems like nothing is safe right now, but the green sectors saw the lowest decline compared to the rest.
MarkitMaven
BTC.X: Crypto Market Faces Potential Major Downturn

We are currently on high alert as Bitcoin tests the trend line from its recent recovery. While we hope this trend line will hold, leading to a rebound, we are prepared for significant concerns if it breaks. Should the trend line break and Bitcoin falls below the 0.38 Fibonacci retracement level, we could see a further decline alongside the US market amid political uncertainty. The key support level to watch is around $60,000. Any fall below this could push Bitcoin down to approximately $40,000 by the US election. Despite the recent downtrend, the volume has been decreasing, providing some relief. However, if we see an increase in selling pressure, we may need to adjust our positions accordingly and consider shorting the market until November 2024. Several indicators are crucial for monitoring this situation. The RSI, currently around 61.39, suggests bullish momentum, but any move below 50 could indicate increased bearish pressure. Additionally, the MACD is showing bearish momentum on the weekly timeframe, which warrants caution. Overall, we are closely watching these technical indicators and market trends to make informed decisions. We aim to position ourselves appropriately based on how these factors evolve leading up to the US electionfailed to break out. Now following the US market toward 60k. Last hope is FOMC meeting.Bitcoin is struggling with breaking out. Breaking below 63k could put higher pressure on the crypto market for a larger correction.Correction continues to progress. Soon should drop below 60k. Crypto diehard fans are still in denial.crypto falling hard again. The disbelief going around the crypto market is going to send huge shockwaves.Things might turn out more bearish than our initial estimates.Breaking below 60k would be a pivotal point for initiation of this downturn.We've been screaming about this drop! Would be a shame if some of y'all didn't hear out voice.Rejection after rejection! This scenario is forced to play out.continues to drift lower.
MarkitMaven
ETH.X: Crypto Market at Risk of a Major Drop

Given the political and economic challenges ahead, the crypto market is at risk of a significant drop. If the support level at $2800 does not hold during its next test, there is a high chance of falling to $2100. The market has formed a lower high in three consecutive attempts, and the failure to reverse at these levels would increase downward pressure. This, combined with the pressure on tech stocks in the US equity market, poses a major threat to the crypto market in the medium term. We are closely monitoring this situation and the support level. Considering the volume has been consistently decreasing since March, we are on high alert. If the support breaks on the recent downtrend starting July 21st, we expect further declines. There are many warning signs across different markets, and until the economic and political climate stabilizes, we anticipate this downturn to continue until the US election.ETH has been rejected a few times and it's struggling to keep up with the selling pressure. As the US market is under too much downside pressure, Crypto is going to feel the volatility and break supports.ETH has been stagnant and crypto die-hard fans are still in disbelief. 3000 mark is extremely important if it breaks down. Following such an event, the shockwaves should hit the market sooner than later.We have been warning about a crypto crash. Early signs are now showing themselves.lower and lower everyday.Too bad this post didn't get enough attention. It could've save you a lot of money. We tried hard to spread the word and warn our followers. We hope at least some of you were following and was able to secure some profit.Another rejection from the top. Crypto market is about to enter a very long winter.Target hit once already.
MarkitMaven
BTC.X: Cup & Handle Theory

Today, Bitcoin hit 200ma for the first time since August 2023. Historically, that not a good sign for Bitcoin. There is also not enough volume to support a full recovering and it's beginning to show significant underlying weakness. This move, in the most bullish way possible, may be the formation of the handle of this a c&h around 40k.
MarkitMaven
BTC: Are we near a bottom?

The economic climate is not great and rates are going to go higher so I don't expect this to be a definitive bottom. Bitcoin seems to be close or above a temporary bottom preparing for a bear market rally. The bounce is happening off the weekly 200MA and should touch daily 200MA close to 0.382 fib level. Weekly RSI is similar to where December 2018 hit which started our recent bull run, but this time we have QT and rate hikes so a new bull run is near impossible. At best, this will be bear market rally. All in all, this is a risky investment because today the feds raised rates by 75 bps and expect to do the same in July if the data suggest they need to. The stock market which is closely correlated with BTC has prices in a 100 bps for today so a 75 bps caused a rally. However, July 75 bps may not be priced in. That means if we get any data that is unfavorable and suggest inflation is more persistent than fed's estimation, we are going to see a massive sell off. The next support is at 19.7k, 2017's high.Market is following 2008 crashing pattern and Bitcoin will go down with it. Stop loss at 19600.
Disclaimer
Any content and materials included in Sahmeto's website and official communication channels are a compilation of personal opinions and analyses and are not binding. They do not constitute any recommendation for buying, selling, entering or exiting the stock market and cryptocurrency market. Also, all news and analyses included in the website and channels are merely republished information from official and unofficial domestic and foreign sources, and it is obvious that users of the said content are responsible for following up and ensuring the authenticity and accuracy of the materials. Therefore, while disclaiming responsibility, it is declared that the responsibility for any decision-making, action, and potential profit and loss in the capital market and cryptocurrency market lies with the trader.